
ABSTRACT
The paper presents a new Lean Logistics tool specifically designed for Engineer and Design-To-Order (ETO and DTO) industrial environments. The new tool, namely Plan For Every Order (PFEO), conceptually derives from the well-known Plan For Every Part used in the automotive serial production context. PFEO is proposed as a tool for industrialization, focusing on the design and logistics optimization of internal material flows at ETO and DTO plants. In the paper, the principles, and concepts behind PFEO are presented and developed. The tool collects information on both suppliers and materials, improving both the management of materials and spaces and communication between the company and suppliers. The operability of the tool is proven in a real business case involving an shipyard. The PFEO has provided a solid database for the development of auxiliary monitoring and visualization tools, the application of which increases order in the warehouse and assembly areas and reduces costs and errors.
1. Introduction
Applying Lean Manufacturing methodologies and tools to production lines or cells may not suffice to improve the production system performance (Hasle et al., Citation2012; Soliman & Abreu Saurin, Citation2017; Wronka, Citation2016). To achieve this goal, it is necessary to introduce a Lean procurement system, which enables an efficient materials flow at lower costs and with maximum accuracy (Inman et al., Citation2011). This is a fundamental rule, valid for any industrial system, from the automotive to one-of-a-kind production environments (Arash et al., Citation2013).
The term ‘Lean Logistics’ refers to the set of tools and methods useful to realize an effective improvement in logistics. In its most general conception, Lean Logistics is the application of Lean Thinking to improve the three kinds of logistics processes (Baudin, Citation2005):
Incoming logistics, from the suppliers to the warehouse
Internal logistics (or in-plant logistics), from the warehouse to the production
Outbound logistics, from the production to the customer
Similar to Lean Manufacturing, Lean Logistics has focused on repetitive production environments, such as series production with a low-mix high-volume production (Hasan et al., Citation2022; Zhang et al., Citation2015). In any case, the basic principles of Lean Logistics remain valid for any industrial environment and, if applied correctly, may help to eliminate the wastes that are inherently present in the management of the logistics area (Garza-Reyes et al., Citation2019). Therefore, we can think of exporting and implementing these principles within several different production contexts, such as the world of Engineer-to-Order (ETO) and Design-to-Order (DTO)
A production system is classified as ETO when engineering activities are part of the product lead time, and, upon receipt of a customer order, a substantial number of design, engineering, and assembly activities are still required (Cannas et al., Citation2018). An extremization of the ETO world is the so-called DTO, or Project-To-Order, production system. In DTO, unlike ETO, each new project requires that even the basic design of the product is started from scratch or heavily modified by a previous release, thus generating highly customized and unique productions (Ramasesh & Browning, Citation2014). These characteristics translate into a layout (substantially) based on fixed location or project shop systems (Black & Hunter, Citation2003), mainly with manual processing (assembly) whose special components are delegated to specialized contractors. We, therefore, fall into specific industrial systems, that are widely known as One-of-a Kind Productions (OKPs). In short, these are advanced manufacturing companies that produce customized products within a product domain (Tu & Dean, Citation2011). The characteristics of DTO-OKP can be briefly summarized as follows (Mello et al., Citation2015):
High customization
Great uncertainties in production control
Complicated and dynamic supply chains
Dynamic production systems
A production context with such features presents several challenges. Firstly, the demand for high customization necessitates an efficient production schedule coordination system to meet delivery deadlines without compromising client satisfaction. The unique nature of products complicates accurate forecasting of required materials, resources, and spaces. Additionally, the diverse and specialized components contribute to a complex and risky supply chain. Another critical aspect is the interrelation among different departments. Maintaining effective communication between sales, production, and design is paramount to address unforeseen changes that may arise during product realization (Birkie & Trucco, Citation2016).
For the above-mentioned reasons, ETO and DTO companies cannot base the management and the organization of production on the presence of stocks, as it typically happens in the automotive industries. It is therefore clear that both the internal logistics and the management and the organization of the supply chain are profoundly different from those in the automotive world. This does not mean that the principles of Lean Manufacturing and the objectives that it aims to achieve in the two industrial contexts are different. In fact, they are still addressed to the synchronization of the flows of supply materials with the planned execution of the production activities, while minimizing the amount of items present on the line and/or the assembly area. This second aspect allows to improve both order and factory organization, facilitating not only the implementation of the 5S within the construction sites, but also the improvement and the consolidation of the results obtained over time.
However, it should be emphasized that the implementation of a Lean Logistics and/or Manufacturing improvement project in ETO and DTO companies requires the adoption of techniques and approaches that are significantly different from those traditionally known and used in the Toyota Production System (TPS) (Braglia, Frosolini, et al., Citation2019). Unfortunately, the standard Lean tools and methods, developed for and applied to repetitive production environments, in general do not fit for companies belonging to the ETO and DTO manufacturing categories (Romero & Chavez, Citation2011). Industrial experiences from several case studies illustrate that the suitability of certain Lean tools and methods, such as Value Stream Mapping (VSM) or Kanban, is very limited (Matt & Rauch, Citation2014). It follows that, in order to effectively implement the Lean principles, both methods and tools must be adapted to the specific ETO environments and that alternative methods are adequately embraced (Yang, Citation2013). We should never experience the fault of applying the wrong Lean tools in an unsuitable production context: at best, things do not improve and, more easily, they end up worsening sensibly (Lane, Citation2007).
Therefore, even if the Lean principles remain substantially unchanged, within the ETO and DTO production systems the methodologies and the operational tools for the implementation of Lean projects must necessarily and profoundly change (Hopp & Spearman, Citation2021). However, the noticeable problem that now opens is the following: while for the automotive (and similar) production systems, the operational theory of Lean Manufacturing is quite structured and consolidated, this can certainly not be said for the ETO and DTO world, especially when it comes to Lean Logistics.
Among Lean Logistics’ tools, Plan For Every Part (PFEP) is widely recognized as one of the most effective means to optimize policies that define how to procure a component. PFEP is used to define a plan (at the item level) for the most efficient replenishment and movement strategies of every single item managed in business through, in general, the complete Supply Chain. PFEP represents a foundation for the Materials Management Strategy and the continuous improvement of the material storage and handling system of an industry. Whenever logistics teams develop inventory optimization goals to reduce shortages, improve working capital, and ultimately maximize production throughput, PFEP can help prioritize opportunities that can create the biggest impact in end-to-end inventory management.
Data contained in the PFEP data base can be used, for instance:
To determine required inventory levels
To set up supermarkets and storage locations
To establish delivery routes and frequency of deliveries
To design and dimension racks at point-of-use (POU)
To design and dimension an appropriate pull Material Flow Control (MFC) system.
To date, there has been limited development of the PFEP, and no evidence exists for its application in contexts beyond its place of origin (more details provided in Section 2). More generally, there is a lack of methods and operational tools to support the implementation of Lean Logistics principles and paradigms in ETO and DTO production systems. Consequently, the aim of this paper is to introduce a new Lean Logistics tool called Plan For Every Order (PFEO). It is derived from the well-known PFEP used in the automotive sector (Conrad & Rooks, Citation2011). This innovative tool is specifically designed to optimise design and logistics within ETO and DTO production systems. Like PFEP, PFEO is proposed in the form of a document/database for product/project industrialisation. However, the PFEO goes further by exploring new territories. In fact, it has to be designed from scratch for each new order, defining the bill of materials and agreements with external companies.
In this article, PFEO is proposed as a guiding method to plan the Incoming and Internal Logistics for ETO and DTO production systems. Combined with a real-world industrial DTO implementation, carried out in a shipyard specialised in the production of mega yachts, this article presents a possible structure of the PFEO and demonstrates how the PFEO-oriented approach supports, for each new Project/Order, the correct decisions regarding the Internal Logistics planning, including the design of warehouses, spaces management, supplier management and packaging.
The paper is structured as follows to provide a comprehensive understanding of the topic. Section 2 encompassed a theoretical background on PFEP along with a review of Lean tools and methods specifically designed to improve the performance of ETO and DTO production systems. Then, Section 3 presents the research methodology applied in the paper. Moving on to Section 4, a detailed explanation of the PFEP logic and structure is presented, shedding light on its intricacies. Section 5 then shifts the focus towards a real-world application of the DTO, showcasing its practicality and effectiveness. Section 6 analyses and discusses the application results and pinpoints limitations and implications for researchers and practitioners. Finally, in Section 7, the paper concludes with key findings, as well as discussing potential future developments for this valuable tool.
2. State of art
This section provides a theoretical background regarding the Lean tools and methods to be implemented in ETO and DTO production contexts and the PFEP.
2.1. Review of related works in the field of lean tools in ETO and DTO environments
Given the success of Lean principles in manufacturing sectors characterized by low-mix high-volume productions (e.g. Vlachos, Citation2015), the number of papers implementing Lean tools and methods outside the repetitive production environment has increased (Meng, Citation2019). The study of Lean Manufacturing applicability to ETO companies represents an important and increasingly covered research topic. Matt and Rauch (Citation2014) underline how the application of Lean Manufacturing in ETO production environment manufacturing is still in its early stages and further research activities are strongly requested. As evidence of this, there are many recent reviews dealing with the subject (Antony et al., Citation2021; de Oliveira et al., Citation2019; Negrão et al., Citation2016; Tomašević et al., Citation2020; Zennaro et al., Citation2019). All of them point to the importance of these studies and the need for further research.
Considering that the present work concerns the development of a new Lean tool for the ETO and DTO world, this brief review focuses on similar research published in the recent past. It should also be emphasized that these researches essentially concern the development of ETO-oriented tools, aimed at the initial phase of a Lean project: the analysis of losses.
VSM is the mapping tool that has received the most attention in terms of evolution and adaptation for use in ETO environments (Matt, Citation2014). In the context of ETO construction industries, some researchers have investigated value network mapping (Khaswala & Irani, Citation2001) or value stream macro-mapping (Fontanini & Picchi, Citation2004), focusing on the supply chain of a specific ETO company in the construction industry. The works of Braglia et al. (Citation2006) and Matt (Citation2014) represent additional possible variants or integrations of the original VSM technique, that have been developed after Lean applications in different environments and ETO contexts.
In terms of Key Performance Indicators (KPIs), the Overall Equipment Effectiveness (OEE) represents the most known measurement tool for effectiveness, both in Lean Manufacturing and Total Productive Maintenance (TPM) implementation processes (Hansen, Citation2002). OEE can be ported to ETO and DTO contexts without significant adaptations and/or extensions. However, it is important to pinpoint its scarce relevance in these environments. In fact, in ETO and DTO companies, nearly all the production of the different components are outsourced, and only the (manual) assembly of the final product is performed internally. To overcome this gap, a new set of interesting KPIs has been recently proposed. Indeed, Braglia, Gabbrielli, et al. (Citation2019) suggest a new Lean metric named Overall Task Effectiveness, which can help analysts to define target task times and to identify the hidden losses that account for most of the recorded time of manual assembly activities.
In terms of tools for the economic analysis and the quantification of losses, Braglia et al. (Citation2019) propose a modified version of the Manufacturing Cost Deployment (MCD) tool to analyse ETO production systems. The novel Project Cost Deployment approach introduces two substantial modifications: (i) the concept of manual assembly macro-activity replaces the traditional concept of the station and (ii) a-new structure for classifying and analysing losses, specifically defined to deal with the inefficiencies of the manual assembly tasks. In Bertolini et al. (Citation2022) a novel Lean tool called Project Time Deployment (PTD) is presented. The basic idea is to classify, analyse, and eliminate losses to reduce production lead time in ETO environments. PTD conceptually combines two known tools: the Manufacturing Critical path Time mapping approach and the Manufacturing Cost Deployment. In this way, PTD identifies the critical losses affecting the order, providing opportunities for greater efficiency and effectiveness by reducing or even eliminating them.
In short, as far as we know from the literature, there are no implementations of PFEP in production areas other than the world of repetitive production. This can help to better design and manage material flows in ETO and DTO environment. Consequently, the development of a PFEP tool oriented towards these environments represents a novelty in a line of research that has been developing strongly in recent years.
2.2. Plan for every part
PFEP is a material flow plan that includes specific data on every part number coming in from suppliers and every finished-good Stock Keeping Unit (SKU) going out to customers (Harris et al., Citation2003). It contains all the necessary information to take informed decisions about transportation, packaging, inventory, placement, ordering quantities and handling.
Containing all the data of logistical interest concerning raw materials, components, semi-finished products, assembled and finished products managed at the plant level and throughout the supply chain in the mass serial production systems, typical of the automotive world, PFEP represents, together with the Bill of Material (BOM) and the Route and Operation Sheets, a third valuable document for the industrialization of a product.
In general, for every item code managed in the plant, it holds information related to:
Part identification (part number, description, unique features, …)
Supplier identification (supplier name, address, city, country, state, …)
Transportation and storage information (what equipment must be used to move parts, description of the container, …)
Delivery (how frequently do we ship and deliver)
Production capabilities (daily or hourly demand rates)
The typical PFEP contains a wealth of data about each part. This provides the company with the precision of information needed to design and manage the material-handling system, effectively. For each part, PFEP contains the relevant details within a spreadsheet or within other database structures, as exemplified in . The level of detail, completeness, and complexity of PFEP varies from case to case and depends on the type of industrial application to which it refers.
Table 1. Example of data recorder in a PFEP data base.
illustrates a sample PFEP. The columns detail various characteristics of the components, while the rows represent individual parts. For example, the first columns identify part number 15,320, described as a valve with a daily usage of 50 at location PC19. Additional details for the valve include dimensions (Length, Width, Height), weight, container type, size, and weight. The last columns provide pertinent supply-related information, such as standard shipment quantity and size. This comprehensive information is presented for each part.
Figure 1. Example of PFEP.
As for the literature on PFEP, it is rather limited and includes few developments of the tool. Weng et al. (Citation2010) propose a new PFEP-oriented in-plant logistics planning method for assembly plants. PFEP is employed as a guiding method to plan the in-plant logistics for a new assembly production system. Combined with an example conducted in an engines production plant, the authors demonstrate how (i) PFEP can be extended from purchasing to production, (ii) PFEP-oriented approach supports the decisions on in-plant logistics planning, including the design of warehouse spaces, material handling systems and packaging solutions. Abdelhadi et al. (Citation2012) demonstrate the benefits of applying a PFEP-based Lean Manufacturing project by creating a Lean flow of purchased parts. This is obtained by developing ‘supermarket’ locations for every part, which lead to minimizing the inventory cost and increasing profit within a manufacturing company that produces sensors. Considering that the nature of the company business is to assemble products containing over a hundred purchased components, the authors successfully demonstrate the importance to have a PFEP. Pawlewski (Citation2018), describes an approach to using PFEP to automate the building of simulation models of entire production systems. The goal of the manuscript is to suggest a technology that answers the question of how to prepare data to build a simulation model quickly and without necessarily having deep knowledge about simulation modeling. An example based on PFEP and on data from the automotive industry is presented. The idea is also taken up in the article of Pawlewski and Anholcer (Citation2019), where the PFEP Data Base is also used as the main integrator of a manufacturing system simulation model.
As can be seen, the research involving PFEP is extremely circumscribed and does not concern studies or in-depth research related to the extensibility of the instrument to production areas other than the repetitive production characteristic of the automotive world.
Based on current literature, two key points emerge:
The adaptations of the PFEP are currently limited and do not encompass the full range of potential advancements and modifications that could enhance the instrument’s usability in non-repetitive production systems.
Hitherto, the Lean tools and methods designed for ETO and DTO industrial systems primarily focus on the initial stage of lean projects, which involves analysing losses.
3. Methodological approach
Based on the findings presented in the literature, we have identified two primary research questions:
RQ1.
To what extent can PFEP be adapted to encompass a wider range of industrial contexts beyond its original domain?
RQ2.
Is it feasible to develop innovative tools and techniques that can advance the implementation of Lean Thinking in ETO and DTO manufacturing environments?
To tackle these research questions, we have devised a novel analytical tool specifically designed to overcome the unique challenges encountered at ETO and DTO sites. The efficacy of the tool has been verified through its application in a practical scenario involving a prominent shipbuilding company. Subsequently, we analyse the outcomes of this application, assess both its strengths and limitations, and provide valuable insights and implications for researchers and practitioners. Finally, we conclude by outlining potential avenues for future developments in this field.
4. Plan for Every Order (PFEO)
Due to its own structure and the information it normally contains, PFEP requires a substantial standardization of material flows. This is why its applicability is limited to serial productions. There are basically three interrelated critical conditions that make PFEP operationally inapplicable in certain industrial contexts:
An extreme diversification and the high number of products potentially producible by the company
High level of product customization
Order based productions that are not based on the presence of stocks
As a result, PFEP is not commonly used in industrial environments like ETO and DTO. It is important to note that PFEP development and updating processes do not inherently create value. Its value lies in achieving significant improvements in value-added activities within logistics processes. However, this is only possible with sufficient standardization of material flows, which may not always be achievable.
In companies like OKP that specialize in large and highly customized products such as yachts, traditional PFEP implementation is practically impossible and of limited use. Most project-specific codes are not applicable to subsequent projects. Additionally, PFEP becomes unfeasible when projects are based on complete contracts, where suppliers handle design, component production, and final assembly. In such cases, the Bill of Materials (BOM) of the final product does not include all the codes, as parts supplied by various suppliers are unknown.
Nevertheless, structured information about how goods enter the plant is crucial for optimizing internal logistics, especially when orders involve significant customizations. Without knowledge of what, how (in terms of Load Units, LU), and when the parts of a generic order will arrive, it becomes challenging to optimize critical aspects of internal logistics such as storage area management and equipment sizing. Therefore, a suitably modified form of PFEP can be very useful and very supportive of the Lean re-design of an ETO and DTO company, for all the aspects that are related to internal logistics.
As already stated, PFEO is certainly attributable, although structurally different to the PFEP used in serial productions. Defining the structure and, therefore, the information to be introduced into the PFEO is the objective of this section.
As with PFEP, the level of detail of the information contained in the PFEO may vary from situation to situation. Further, considering the great differences that may exist between the various ETO and DTO productions, PFEO is potentially more differentiable, in terms of content, than PFEP is for the world of serial productions. The PFEO fields described in the following paragraphs are therefore related to the specific industrial case at the basis of this research. It should be noted that shipyards that realise unique productions of highly customised mega-yachts represent interesting industrial cases of extreme complexity in the already complex world of DTO.
In any case, in the construction of a PFEO, it will always be necessary to consider the need to guarantee flexibility and agility of use, a good drafting speed for each new order/project and its potential integration with the modules present in the company ERP (e.g. BOM management, scheduler/planner, Supply Chain Event Management system, etc.).
Moving on to the design and definition of the structure of the PFEO, a first observation that must be made concerns the fact that the PFEO is linked to a single order and not to a product in the catalogue, produced repeatedly over time, as happens for PFEP. This means that, for each new project or order, a specific PFEO must be prepared. As a result, the structural logic of PFEP, based on defining all the important logistical aspects for each managed code, is no longer appropriate. The new logic will have to be based on the individual suppliers or, even better, on each LU that the various suppliers will have to send to the plant for the execution of works within the received contracts. In addition, the PFEO lines will be associated with the expected LUs arriving from the various suppliers and no longer with the individual codes of raw materials and/or components received. In fact, it must be considered, as will be better explained later in this section, that in certain production realities such as the one taken into consideration in this article, the BOM of the order is generally ‘incomplete’ if compared to the standards found in the automotive world. In other words, only a small part of the tens of thousands of codes that are necessary for the preparation of the finished product is codified and known at the information system level, since only a few codes are actually purchased directly from the construction site. Most of them are purchased or produced directly by the suppliers, within the scope of contracts involving design, purchase, processing, and subsequent installation at the shipyard.
Going into the details of the information recorded in the PFEO, the columns can be divided into main sections, as follows:
4.1. Supplier identification
Depending on the degree of detail required, it is possible to record here a series of information relating to the various suppliers, including:
Supplier name
Geographical location/address (city, state, country, …)
Distance from the factory
Types of the supplier (carpenter, electrician, …)
The information is similar to that found in PFEP for each stock code. However, the information relating to the type of supplier provides interesting information on the type of materials to be received from the supplier: furniture materials, electrical equipment, ventilation ducts, pipework and so on. This in turn affects the storage methods of the associated LUs (e.g. indoor and outdoor storage, use of cantilevers, etc.).
4.2. Load Unit identification and management
This fundamental section of the PFEO is substantially dedicated to the recording of data necessary for the identification of the expected LUs containing the incoming materials, and to quantify the foreseeable residence time of the LU in the storage areas.
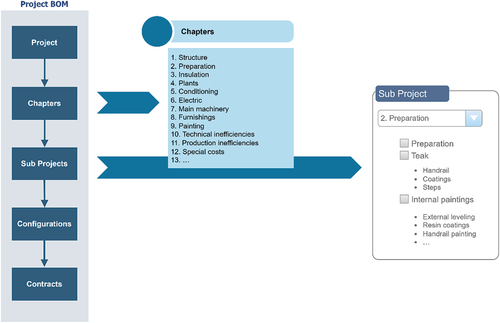
Before continuing and for the sake of a better understanding, it is useful to present what can be considered a conventional configuration of a design BOM for DTO industries, as is the case for the shipyard of the case study analysed in this paper. The Project BOM can be represented by the structure shown in . In brief, the project (i.e. a new yacht) is structured, at a first level, on different Technical Specification Chapters to be defined for each new unit (for instance, there are 14 chapters in our case). Each specification chapter is then divided into one or more sub-projects, corresponding to one or more activities to be performed ().
Figure 2. The structure of project BOM.
On this basic and standard structure, for every single activity of each sub-project, the configuration/project documents relating to the specific new ship are adequately grafted. These documents are linked to both the purchases managed directly by the shipyard (e.g. the purchase of engines), and the contracts for the various suppliers. As already reported above, these are often lump-sum contracts, i.e. they involve the design, production of components and their assembly at the Shipyard. Contracts generally cover about 70% of the ships outfitting. The contract BOM does not, therefore, contain any form of coding for the future materials envisaged in those contracts. This involves, during the preparation of the yacht, the progressive arrival of goods at the Shipyard, sent (in advance and on consignment fill-up) by the suppliers, which are unknown to the management system.
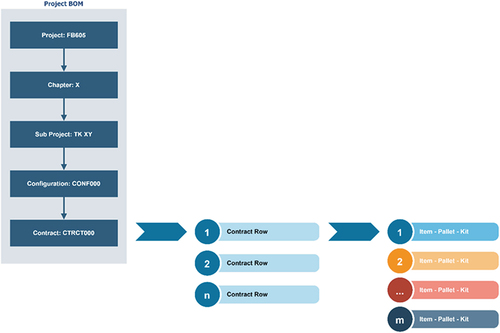
The introduction of the PFEO entails the definition of the LUs envisaged by each supplier for each contract. This involves redesigning the Project BOM to link to each planned contract row the associated LUs used to send the necessary materials (). In this way, each incoming LU will be system-coded and, therefore, understandable, and manageable from a logistical point of view, regardless of whether the specific content is known.
Figure 3. The new project BOM.
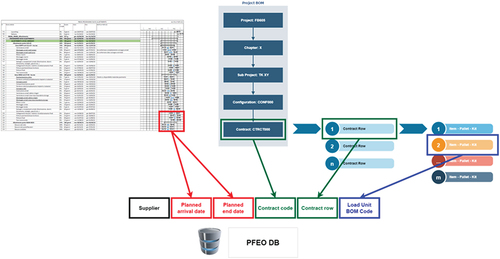
In general, once the Project BOM has been structured as shown in , it is possible to insert in the central section of the PFEO a series of important information related to each supplier and to the associated contracts, which allows to identify and correctly code the LUs to be managed by the construction site during the execution of the order:
Supplier Load Unit Progressive Number
Contract Code
Contract Row
Load Unit Project BOM Code
Planned Arrival Date
Planned End Date
As can be seen from , the data contained in this section of the PFEO are directly related to the structure of the Project BOM and to the scheduling software adopted in the shipyard. In particular, the dates of arrival and use of a LU can be automatically determined and uploaded by the planning software (i.e. Project®, Oracle Primavera®, etc.) once the resources (i.e. the suppliers responsible) have been associated with the various activities scheduled on the Gantt chart of the contract. After the software has calculated the estimated dates on which a generic supplier will start and end a given assembly activity, the expected arrival of the necessary LUs at the shipyard is automatically determined (typically, with a small advance for safety reasons), as well as the (expected) end date of the occupation of the storage space.
Figure 4. Links between PFEO Data Base and Company Software.
Considering the scheme of , and the normal complexity of DTO orders, it is difficult to think to operationally manage the PFEO, even more than PFEP, using applications based on simple Excel spreadsheets. The PFEO Data Base should therefore be created and managed by a specific application strictly connected to the company management software and directly interfaced with the reference modules (i.e. BOM and planning).
4.3. Logistics information
In order to have the necessary data to design and manage the storage areas in the plant and the associated handling systems, it is advisable, whenever possible, to collect in the PFEO as much information as possible regarding the types and the physical dimensions of the various loading units, any storage and/or conservation constraints for the materials, the handling systems necessary for handling or storage, etc.
This section of the PFEO is therefore reserved for information gathered as a result of specific questions:
What types are the LUs with which the material is delivered by suppliers? (euro pallet, container, basket, customized packaging, …)
What are dimensions and weights (length, height, depth, net weight, …) do they have?
Are the materials coherent with the size of the LU? If not, what are the excess dimensions?
Are they stackable?
Do they contain high-value and/or delicate codes?
Do they have storage problems? Can they be stored outdoors?
What equipment is needed to move LU? (i.e. forklift, overhead crane)
What type of refuelling (batch, single item, kit, …) do they require?
What is the type of content (metal carpentry, fan coil, tiles, wood inserts, pipes, ventilation ducts, …) of the LU?
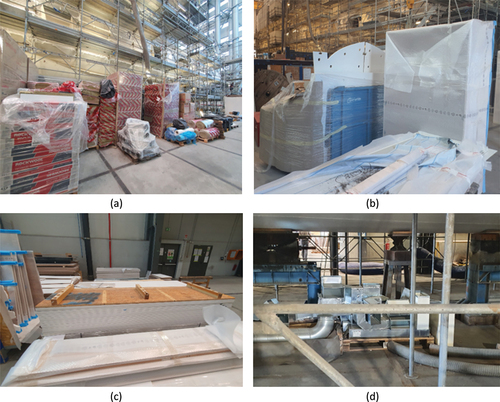
The information collected can be integrated with photographic attachments allowing, over time, to gather the history of the used LUs, to pursue a (wide if not exhaustive) standardization of the LUs usable for deliveries in future orders. In other words, the PFEO will allow, over time, to have a wide range of LUs to be suggested to all suppliers to standardize, as far as possible, the delivery and storage of materials ().
Figure 5. Examples of types of materials and packaging entering a shipyard: (a) packaging materials, (b) interior furnishings and fixtures, (c) insulation and soundproofing materials, (d) steel and metal supplies.
5. Case study
This section describes in depth how the tool was applied in a leading company in the production of luxury yachts, with reference to large boats, over 70 meters long (the so-called mega yachts). In the following, for clear reasons of confidentiality, only the information that is essential for understanding the project is reported.
5.1. Pilot project
The total area available at the construction site is very large (several tens of thousands of square meters) and is roughly allocated as follows:
Mega yachts production areas: about 25%
Production areas for other types of yachts (outside the scope of the project) 20%
External storage area: 15%
External passage area: 25%
Offices and boxes: 5%
Processing areas (e.g. painting): 3%
Warehouse coded items: 3%
Refit areas: 2%
Technical rooms: 2%
The useful space for the storage of the material is therefore ‘on the ground’ in the sheds, in the outdoor areas and in the remaining available space inside the sheds, generally on one side of them. In general, these areas are assigned to companies on loan for use, for the time-lapse granted to the supplier on the project.
After a careful study and an exhaustive mapping of the processes, a series of critical issues have been found, typical of this type of industry. Among them, it is worth mentioning the following:
Overlapping of some work steps during the planning phase.
Assignment and management of storage areas on-site, with inappropriate use of some zones that cannot and should not be used for the storage of materials. Very often, this involves the risk of damage and loss of material, as the spaces are subject to the frequent passage of men and vehicles. In addition, these areas cannot be adequately marked and signed.
Difficulty in recognizing the material. The material does not always have labels, and when there are, there is no common standard shared with the shipyard.
Congestion of the material reception authority. Suppliers often refer to Internal Logistics for unloading and handling. Sometimes, because of incorrect delivery planning, the shipyard finds itself congested and has to carry out emergency movements.
High storage periods. The material present in production, often, is not intended for boarding in the short term. The connotation of ‘short-term buffer’ is therefore lost, and the sheds become real warehouses for the suppliers. This contributes, together with other factors, to a chaotic arrangement of the material, with the risk of loss and damage.
In response to the critical issues detected, two areas have been identified on which action should be taken, to design a new logistics management and planning system. The goal is to eliminate the root problem: the uncontrolled proliferation of (unknown) material on site.
The first area of intervention concerns the logistical management of the procurement material. In this area we acted to solve the problem related to the management of the material on site. Specifically, new procedures have been designed and applied aimed at giving real visibility on the incoming material and at defining a specific location for the material, according to its type and who is responsible for it. Finally, the second area concerns the management of coded material, where a new method of managing the items has been adopted, trying to break down compound codes (those of the LUs containing many different components) into more specific codes, in order to introduce the possibility of partial discharges from the warehouse.
The plan for the implementation of the project has been divided into a number of progressive phases:
Implementation of the PFEO: this allows to get in advance the visibility of all the material necessary for the processing and, consequently, it gives knowledge of the quantity and type of incoming packages, which will allow the assignment of adequate space to each supplier.
Assignment of areas to contractors: the space will be assigned by comparing the emerged needs and the amount of space needed to contain the material declared in the PFEO.
Identification of the material: the material that the supplier will bring to the site must be labelled according to a shared standard, so that its origin and destination can be traced.
Monitoring of arrivals: before each entry into the shipyard, the supplier must communicate the quantity and type of material he intends to bring, in order to allow the reception authority and the Internal Logistics to organize the work.
Space management: rules have been defined and shared with the suppliers to reach and maintain the correct management of spaces. Space saturation is regularly monitored, in order to validate the assignment criteria and highlight any flaws in the system.
The above phases have been implemented with the help of tools created ad hoc, generally using MS Excel®. The choice of this software is justified by its simplicity and the relatively small amount of data to be processed. In the future, of course, it will be necessary to adopt dedicated instruments which will allow the automatic transmission and processing of data.
As already mentioned, several times in the previous paragraphs, when the typical problems of DTO systems have been properly highlighted, the shipyard specific context does not allow to reach a high degree of detail in relation to every single item that will be introduced on-site. Therefore, LUs will be analysed, but not their content. This management mode allows having wide visibility on what enters in terms of the number of packages, allowing to correctly manage the unloading and the handling. LUs are grouped by category, since, in the future, it will also be possible to choose standard handling systems.
The PFEO document () consists of three fundamental parts:
Figure 6. PFEO format adopted by the shipyard.
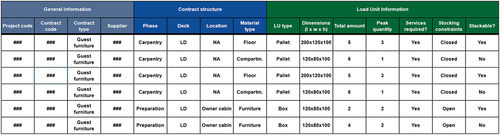
General information, containing the master data of the contract, such as the order code, the type, and the name of the supplier.
Contract decomposition, with columns containing the production phase, the deck, the room, and the type of material.
LU information, containing the relevant data of all LUs assigned to the given level of decomposition. Type, dimensions, total quantity foreseen for the contract, expected peak quantity, need for construction site tools for unloading, storage constraints and stackability.
The document must be filled by the supplier when the contract is awarded, at the beginning of the contract itself. By filling it in at this early stage, a few months before the actual start of the work, the construction site will have the time necessary to correctly process the data received.
Consistently, 4 types of areas have been defined and the corresponding spaces in the sheds have been properly delimited, in order to avoid abuse and proliferation of materials:
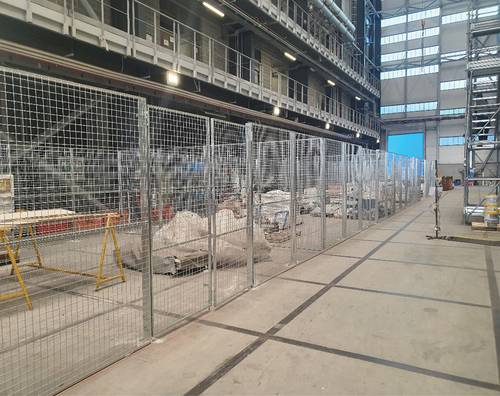
Lineside areas for supplier use. These are generally cages (), consisting of modular fences, protected by locks, which will contain only contract material to be embarked (e.g. furniture panels, ducts, rolls of rock wool for insulation). In the event that the spaces assigned are not sufficient to contain stocks to cover the delivery lead time, warehouses may be assigned for ‘extension of the lineside areas’, therefore managed with the same logic. The responsibility for the material will be of the supplier.
Figure 7. Cages used to restrict lineside areas.
Warehouses/workshops already assigned. Assignments already made are difficult to be changed abruptly. However, it will be requested that the premises be used for the storage of consumables only, such as small parts, fittings, and valves. The responsibility for the material will be of the supplier.
Production areas. Areas in the immediate vicinity of the ship. Today they are used for the storage of materials such as insulation, pipes and air conditioning. In the future, this material will have to be stored in the lineside areas, in order to keep near the ship only the material to be embarked during the day, stored in delimited ‘loading/unloading’ areas, or empty LUs, unloaded from the lineside areas, awaiting for removal.
Lineside areas/warehouses for shipyard use. These are delimited by fences or taped on the ground. The shipyard has the right to insert coded and voluminous packages, therefore not storable in the warehouse, or packages from suppliers that have been accepted in an emergency, not storable in dedicated areas. The responsibility of the material, in both scenarios, will be of the shipyard.
The subsequent allocation of spaces is carried out by considering several factors:
Comparison of the incoming material, declared in the PFEO, with the milestones of the ship-building program, in order to have an overview of the progress of the material necessary for the monthly production.
Comparison of PFEO data with the historical database of progress files, in order to have an overview of how much material has been mounted monthly on similar orders.
Interviews with the suppliers, who will indicate the amount of space they need.
Once the consistency among these three points has been assessed, the list of square meters necessary for each supplier can be drawn up.
5.2. Space requirement planning
One interesting consequence of the adoption of the proposed model is linked to the creation of ancillary monitoring and visualization tools. In particular, two tools were designed to monitor available and required spaces.
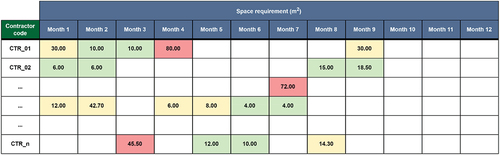
At the operational level, the first instrument is fed by cross-referencing the data provided in the PFEO with the processing dates extrapolated from the planning of shipbuilding activities (). As can be seen, the PFEO table provides information on the space required and the expected delivery time slot, thus enabling constant monitoring and control of what is expected to happen in the line and production areas. Spaces can be monitored in general or specifically referred to each individual supplier. Historical data can also be used later to improve the space allocation process for a given supplier. To further exploit this noteworthy capability, always referring to the principles of Lean Manufacturing, a visual management table has been introduced which, after the definition of attention thresholds, different for each supplier, returns a display of the situation of the spaces in the various months (other time units can be chosen as well), through colour codes (). By means of such tools, for instance, extension lineside areas or emergency storages may be evaluated and allocated as necessary.
Figure 8. Space requirement planning tool.
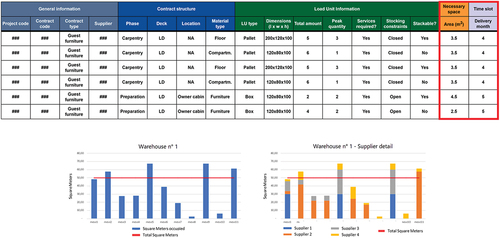
Figure 9. Visual space monitoring tool.
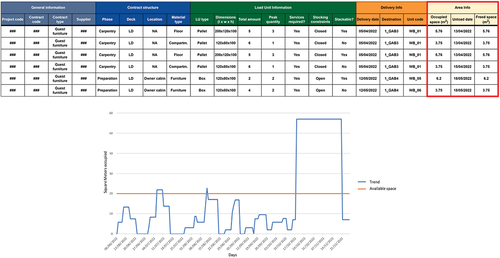
Subsequently, an appropriate storage monitoring tool was designed to monitor the inputs and the outputs of material from the dedicated areas (with reference to incomplete unloading), allowing the operators to visualize the trend of the space available for future deliveries. In this case, the PFEO table has been enriched with columns dedicated to the occupied space, the progressive loading and unloading processes and the freed spaces, in order to have a punctual knowledge of the current availability.
Operationally, the tool is used by crossing the data from the delivery register with those obtained from the labels of the LUs downloaded from the different areas. In this case, the use of smart and automatic identification systems is extremely valuable: in the examined case study both graphical codes (barcodes and QR codes) and RFID systems have been successfully adopted. shows the structure and output in terms of the trend of the space occupied in a single area.
Figure 10. Storage monitoring tool.
Substantially, we can affirm that the SRP tool can be thought of as the equivalent of a Capacity Requirement Planning system, working in conjunction with the planning system exactly as the CRP does with respect to the MRP.
An additional tool that has been built, not difficult to design but still important for the correct management of the project, concerns the complete registry of the available areas and their layouts, in terms of assigned square meters and assignee company. Finally, in the near future, the complete computerization of the PFEO database and the visual management tools is envisaged, with the consequent integration of the corresponding modules with the company ERP system.
6. Discussion and outlook
The industrial application of PFEO has shown that major improvements can be achieved by implementing Lean Logistic tools that can industrialize the internal flow of materials and information in the DTO plant. Specifically, although the project is still in the course of implementation, the results obtained are significant and tangible. It has resulted in a significant decrease in the occurrence of errors and damages. There has been a remarkable 75% reduction in material damage during both handling and storage phases. This improvement has translated into substantial cost savings for the shipyard, amounting to over 30,000 euros annually. In parallel, the collaborative dynamics between the company and its suppliers have undergone a significant evolution, marked by a reduction in the number and entities of disputes. Furthermore, the implemented tool has markedly improved the management of the internal storage area, resulting in a substantial reduction in the space required by the supplier. This optimization has directly contributed to a cost reduction of 20,000 euros per year. Additionally, the tool has effectively streamlined internal movements, resulting in a reduction of both planned and unplanned handling activities. This improved management of internal handling operations translates into annual savings of over 18,000 euros. Furthermore, the tool has demonstrated success in optimizing the allocation of external spaces for the supplier, leading to a notable cost reduction of 25,000 euros per year. In summary, the implementation of the PFEO has resulted in a comprehensive cost reduction, exceeding 93,000 euros annually. This substantial financial benefit underscores the efficacy and impact of the adopted measures in optimizing various facets of the operational processes, ranging from error reduction and material damage mitigation to enhanced supplier relations and streamlined resource allocation. The cumulative effect of these improvements reflects a significant advancement in the overall efficiency and economic sustainability of the shipyard.
An important possible limitation that emerged from the case study is that the PFEO structure will change according to the specific characteristics of the ETO and DTO company to which it is to be applied. For example, plant manufacturers (i.e. overall equipment manufacturers, OEMs) normally suffer from logistical problems similar (though not as extreme) to those in the DTO world, but the implementation of PFEO would lead to a different structure while following the same logic. These companies do not produce the individual components that make up the machines, but merely assemble them. Standard components are purchased from the available component market (e.g. electric motors, chillers, etc.). On the other hand, the manufacture of specific non-standard codes (e.g. frames, carpentry, etc.) is entrusted to the supply network of subcontractors, who specialize in precision machining, carpentry, electrical panels, automatic systems, etc. The major difference with the DTO case study discussed earlier is that the design phase is now generally developed in-house by the company’s engineering department, resulting in a BOM that is still ‘traditional’ and complete in all its codes. Therefore, the company knows perfectly what will enter the warehouse during the assembly of the machine but is generally unaware of the delivery methods. In other words, despite knowing the content, even in these ETO realities the fundamental question remains about the number and the types of LUs used by the generic supplier for the delivery of the various parts.
Upon assessing the implementation and outcomes of the PFEO, it becomes evident that it goes beyond the existing tools in the literature. The information within empowers companies to adeptly handle entire orders comprising multiple parts. It is a groundbreaking integration of Lean thinking principles, extending beyond conventional loss analysis in ETO and DTO production systems. The PFEO stands out as the inaugural Lean Logistics tool successfully applied in the ETO and DTO context, paving the way for innovative tools. In a specific case study, two new tools for ETO and DTO companies emerged: a visual management tool showcasing production area space status and a monitoring tool for dedicated storage area input and output checks.
7. Conclusions
In this paper, a new tool to support Lean Logistics projects implementation in ETO and DTO environment has been presented, to help improve the overall production system performance. The new tool, namely PFEO, conceptually derives from the well-known PFEP used in the automotive serial production context. PFEO is proposed as a Lean tool for industrialization, with regard to the aspects of design and logistics optimization of internal material flows at ETO and DTO plants. This novel tool has a columnar structure divided mainly into two sections. The first records supplier information, such as name, address, type, and distance from the factory. This information allows the company to easily obtain data on the material to be received. The second section is dedicated to Planned Loading Units. It provides essential information for material transport and space management.
To illustrate its effectiveness, the tool was tested in a real-world application concerning a leading luxury shipbuilding company. The results obtained in the case study implementation are significant and tangible. Among these, it is worth mentioning better management of the receipt of materials and greater order in the warehouse and assembly area. This leads to a reduction in errors and damage in both handling and storage, and thus a reduction in costs. In addition, indirect benefits such as increased space availability and improved relationships between the company and suppliers can be achieved.
Another interesting result is linked to the creation of ancillary monitoring and visualization tools, that constitute a Space Requirement Planning tool. In particular, to monitor the available spaces, two tools have been designed: at the operational level, the first instrument is fed by cross-referencing the data provided in the PFEO with the processing dates extrapolated from the planning of the shipbuilding activities. Always referring to the principles of Lean Manufacturing, a visual management table has been introduced which, after the definition of attention thresholds, different for each supplier, returns a display of the situation of the spaces in the various months through colour codes.
Although the tool has proven effective, it could be further developed because it is still in an embryonic state. From a practical point of view, it can be tested in ETO and DTO environments characterized by less product customization and complexity to validate it in other industrial settings. From a theoretical perspective, industrial digitization is on the rise, following the principles of Industry 4.0. This may lead to a more IT-focused evolution of the tool. Two different scenarios can be considered. First, the tool can be integrated into the management software through a specific app that allows the supplier to compile it in real-time. This would result in a more flexible information flow that allows for the best utilization of the production chain resources as an aggregate system. One of the primary challenges in this domain pertains to effectively engaging suppliers. In this context, it is crucial to design the compilation platform to be user-friendly and efficient, ensuring a quick and hassle-free compilation process. Secondly, the tool could be combined with an Artificial Intelligence system that, from the data collected by the tool, would be able to predict estimates for future projects, such as, for instance, materials and space needed, lead times, and costs. If these predictions were to prove correct, they could lead to a significant improvement in operational performance with significant economic and managerial savings. From this perspective, the primary challenges may arise from the extensive customization of products. The substantial variability in orders, both in terms of components and required spaces, can pose a significant obstacle to accurately predicting and managing the system.
Disclosure statement
No potential conflict of interest was reported by the author(s).
Data availability statement
The data used to support the findings of this study are supported within the manuscript.
References
- Abdelhadi, A., Seifoddini, H., & Almomani, A. (2012). Part and inventory control analysis using plan of every part concept - a case study at Elba, Inc., USA. Proceedings of the 2012 International Conference on Industrial Engineering and Operations Management, 702–25, July 3-6, Istanbul, Turkey.
- Antony, J., Psomas, E., Garza-Reyes, J. A., & Hines, P. (2021). Practical implications and future research agenda of lean manufacturing: A systematic literature review. Production Planning & Control, 32(11), 889–925. https://doi.org/10.1080/09537287.2020.1776410
- Arash, A., Patel, P. C., Zangoueinezhad, A., & Linderman, K. (2013). The effect of environmental complexity and environmental dynamism on lean practices. Journal of Operations Management, 31(4), 193–212. https://doi.org/10.1016/j.jom.2013.03.002
- Baudin, M. (2005). Lean logistics: The nuts and bolts of delivering materials and goods. Productivity Press, Taylor & Francis.
- Bertolini, M., Braglia, M., Marrazzini, L., & Neroni, M. (2022). Project time deployment: A new lean tool for losses analysis in engineer-to-order production environments. International Journal of Production Research, 60(10), 3129–3146. https://doi.org/10.1080/00207543.2021.1912428
- Birkie, S. E., & Trucco, P. (2016). Understanding dynamism and complexity factors in engineer-to-order and their influence on lean implementation strategy. Production Planning and Control, 27(5), 345–359. https://doi.org/10.1080/09537287.2015.1127446
- Black, J. T., & Hunter, S. L. (2003). Lean manufacturing systems and cell design. Society of Manufacturing Engineers.
- Braglia, M., Carmignani, G., & Zammori, F. (2006). A new value stream mapping approach for complex production systems. International Journal of Production Research, 44(18/19), 3929–3952. https://doi.org/10.1080/00207540600690545
- Braglia, M., Frosolini, M., Gallo, M., & Marrazzini, L. (2019). Lean manufacturing tool in engineering-to-order environment: Project cost deployment. International Journal of Production Research, 57(6), 1825–1839. https://doi.org/10.1080/00207543.2018.1508905
- Braglia, M., Gabbrielli, R., & Marrazzini, L. (2019). Overall task effectiveness: A new lean performance indicator in engineer-to-order environment. International Journal of Productivity and Performance Management, 68(2), 407–422. https://doi.org/10.1108/IJPPM-05-2018-0192
- Cannas, V. G., Pero, M., Pozzi, R., & Rossi, T. (2018). An Empirical Application of Lean Management Techniques to Support ETO Design and Production Planning. IFAC-Papersonline, 51(11), 134–139. https://doi.org/10.1016/j.ifacol.2018.08.247
- Conrad, T., & Rooks, R. (2011). Turbo Flow: Using plan for every part (PFEP) to Turbo charge your supply chain. CRC Press, Taylor & Francis.
- de Oliveira, R. I., Oliveira Sousa, S., & de Campos, F. C. (2019). Lean manufacturing implementation: Bibliometric analysis 2007–2018. The International Journal of Advanced Manufacturing Technology, 101(1–4), 979–988. https://doi.org/10.1007/s00170-018-2965-y
- Fontanini, P. S., & Picchi, F. A. (2004). Value stream macro mapping – a case study of aluminium windows for construction supply chain. Proceedings of the 12th Annual Conference of the International Group for Lean Construction (IGLC-12), Elsinore, Denmark, 3-5 August.
- Garza-Reyes, J. A., Villarreal, B., Kumar, V., & Diaz-Ramirez, J. (2019). A lean-TOC approach for improving Emergency Medical Services (EMS) transport and logistics operations. International Journal of Logistics: Research & Applications, 22(3), 253–272. https://doi.org/10.1080/13675567.2018.1513997
- Hansen, R. C. (2002). Overall equipment effectiveness: A powerful production/maintenance tool for increased profits. Industrial Press Inc.
- Harris, R., Harris, C., & Wilson, E. (2003). Making materials flow: A lean material-handling guide for operations, production-control, and engineering professionals. Lean Enterprise Institute Inc.
- Hasan, S., Khan, G., Hoque, M. R., Hassan, F., & Ahmed, N. (2022). Lean practices in the Bangladeshi ready-made garments industry and global significance. International Journal of Logistics: Research & Applications, 25(3), 309–327. https://doi.org/10.1080/13675567.2020.1847262
- Hasle, P., Bojesen, A., Langaa Jensen, P., & Bramming, P. (2012). Lean and the working environment: A review of the literature. International Journal of Operations and Production Management, 32(7), 829–849. https://doi.org/10.1108/01443571211250103
- Hopp, W. J., & Spearman, M. S. (2021). The lenses of lean: Visioning the science and practice of efficiency. Journal of Operations Management, 67(5), 610–626. https://doi.org/10.1002/joom.1115
- Inman, R. A., Sale, R. S., Green, K. W., Jr., & Whitten, D. (2011). Agile manufacturing: Relation to JIT, operational performance and firm performance. Journal of Operations Management, 29(4), 343–355. https://doi.org/10.1016/j.jom.2010.06.001
- Khaswala, Z. N., & Irani, S. A. (2001, September 10–11). Value Network Mapping (VNM): Visualization and analysis of multiple flows in Value stream maps . Proceedings of the Lean Management Solutions Conference, St. Louis, U.S. State of Missouri.
- Lane, G. (2007). Made-to-order lean: Excelling in a high-mix, low-volume environment. Productivity Press.
- Matt, D. T. (2014). Adaptation of the value stream mapping approach to the Design of Lean Engineer-to-order production systems: A case study. Journal of Manufacturing Technology Management, 25(3), 334–350. https://doi.org/10.1108/JMTM-05-2012-0054
- Matt, D. T., & Rauch, E. (2014). Implementing lean in engineer-to-order manufacturing: Experiences from a ETO manufacturer. In V. Modrák & P. Semančo (Eds.), Handbook of research on design and management of lean production systems (pp. 148–172). IGI Global.
- Mello, M. H., Strandhagen, J. O., & Alfnes, E. (2015). Analyzing the factors affecting coordination in engineer-to-order supply chain. International Journal of Operations and Production Management, 35(7), 1005–1031. https://doi.org/10.1108/IJOPM-12-2013-0545
- Meng, X. (2019). Lean management in the context of construction supply chains. International Journal of Production Research, 57(11), 3784–3798. https://doi.org/10.1080/00207543.2019.1566659
- Negrão, L. L. L., Godinho Filho, M., & Marodin, G. (2016). Lean practices and their effect on performance: A literature review. Production Planning & Control, 28(1), 33–56. https://doi.org/10.1080/09537287.2016.1231853
- Pawlewski, P. (2018). Using PFEP for simulation modeling of production systems. Proceedings of 28th International Conference on Flexible Automation and Intelligent Manufacturing (FAIM2018), pp. 811–818, June 11-14, Columbus, USA. https://doi.org/10.1016/j.promfg.2018.10.132.
- Pawlewski, P., & Anholcer, M. (2019). Relational database template in the simulation modeling of manufacturing systems. IFAC-Papersonline, 52(13), 1744–1748. https://doi.org/10.1016/j.ifacol.2019.11.453
- Ramasesh, R. V., & Browning, T. R. (2014). A conceptual framework for tackling knowable unknown unknowns in project management. Journal of Operations Management, 32(4), 190–204. https://doi.org/10.1016/j.jom.2014.03.003
- Romero, D., & Chavez, Z. (2011). Use of value mapping tools for manufacturing systems redesign. Proceedings of the World Congress on Engineering, London, July 6–8.
- Soliman, M., & Abreu Saurin, T. (2017). Lean production in complex socio-technical systems: A systematic literature review. Journal of Manufacturing Systems, 45, 135–148. https://doi.org/10.1016/j.jmsy.2017.09.002
- Tomašević, I., Stojanović, D., Slović, D., Simeunović, B., & Jovanović, I. (2020). Lean in High-Mix/Low-Volume industry: A systematic literature review. Production Planning & Control, 32(12), 1004–1019. https://doi.org/10.1080/09537287.2020.1782094
- Tu, Y., & Dean, P. (2011). One-of-a-kind production. Springer Verlag.
- Vlachos, I. (2015). Applying lean thinking in the food supply chains: A case study. Production Planning & Control, 26(16), 1351–1367. https://doi.org/10.1080/09537287.2015.1049238
- Weng, W., Song, Y., Yang, G., & Schmidt, R. (2010). PFEP-Oriented in-plant logistics planning method for assembly plants. Proceedings of International Conference of Logistics Engineering and Management (ICLEM), 1399–1407, October 8-10, Chengdu, China.
- Wronka, A. (2016). Lean logistics. Journal of Positive Management, 7(2), 55–63. https://doi.org/10.12775/JPM.2016.012
- Yang, L. R. (2013). Key practices, manufacturing capability and attainment of manufacturing goals: The perspective of project/engineer-to-order manufacturing. International Journal of Project Management, 31(1), 109–125. https://doi.org/10.1016/j.ijproman.2012.03.005
- Zennaro, I., Finco, S., Battini, D., & Persona, A. (2019). Big size highly customised product manufacturing systems: A literature review and future research agenda. International Journal of Production Research, 57(15–16), 5362–5385. https://doi.org/10.1080/00207543.2019.1582819
- Zhang, A., Lou, W., Shi, Y., Chia, S. T., & Sim, Z. H. X. (2015). Lean and Six Sigma in logistics: a pilot survey study in Singapore. International Journal of Operations and Production Management, 36(11), 1625–1643. https://doi.org/10.1108/IJOPM-02-2015-0093
