
ABSTRACT
The proposed job concerns the evaluation of a series of surveys carried out in the context of a campaign of studies begun in 2015 with the objective of comparing the accuracies obtainable with the systems of terrestrial imaging, compared to unmanned aerial vehicle imaging and laser scanner survey. In particular, the authors want to test the applicability of a system of imaging rover (IR), an innovative terrestrial imaging system, that consists of a multi-camera with integrated global positioning system (GPS)/global navigation satellite system (GNSS) receiver, that is very recently released technique, and only a few literature references exist on the specific subject. In detail, the IR consists of a total of 12 calibrated cameras – seven “panorama” and five downward-looking – providing complete site documentation that can potentially be used to make photogrammetric measurements. The data acquired in this experimentation were then elaborated with various software packages in order to obtain point clouds and a three-dimensional model in different cases, and a comparison of the various results obtained was carried out. Following, the case study of the Basilica di Santa Maria di Collemaggio in L’Aquila is reported; Collemaggio is an UNESCO world heritage site; it was damaged during the seismic event of 2009, and its restoration is still in progress.
Introduction
With the birth of digital photogrammetry, photogrammetrical technique has evolved toward a simplification of surveying operations and an increase in speed for the operations of restitution, presenting itself today as one of the most widely used techniques for documenting the state or condition of a three-dimensional object.
The following are the results of a series of surveys, begun in 2015, which saw as a case study the Basilica of Collemaggio in L’Aquila, whose survey was carried out with different technologies; in particular the authors report the results of the last measurement session, carried out with an innovative terrestrial imaging system; that is the Trimble V10 Imaging Rover and consists of a multi-camera with integrated global positioning system (GPS)/global navigation satellite system (GNSS) receiver, followed by a comparison with the results of a survey conducted with an unmanned aerial vehicle (UAV) and one conducted with laser scanning. The data acquired were then elaborated with various software packages in order to obtain point clouds and a three-dimensional model in different cases, and a comparison of the various results obtained was carried out.
The Basilica of Santa Maria di Collemaggio in L’Aquila was chosen for the case study. The church, founded in 1288 on commission of Pietro Angelerio da Morone (later Pope Celestine V), rises on a promontory known as Colle di Maggio, or Collemaggio, just outside the city walls of L’Aquila near the Bazzano Gate. It is the most important religious monument of the city of L’Aquila, contains the first Holy Door in the world, and is the seat of an annual Jubilee unique in its genre.
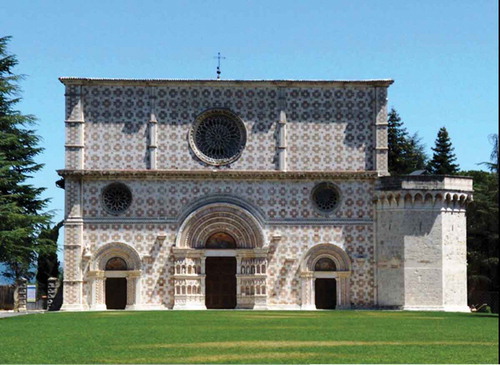
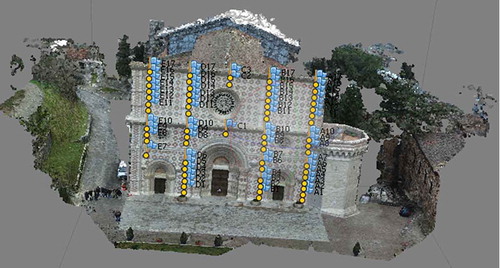
The façade of the Basilica () is characterized by particular masonry work composed of a combination of contrasting pink and red stone blocks that decorates it with characteristic geometrical motifs so as to create a dual optical effect. During the earthquake of 2009, the basilica was significantly damaged; a part of the vaulting collapsed due to the destruction of the rear part of the nave. For this reason, a complex campaign of restoration is currently being carried out.
Figure 1. Façade of the Basilica of Santa Maria di Collemaggio in L’Aquila.
The survey of the site was conducted with the IR by Trimble followed by a comparison with the results of a survey conducted with an UAV system and one conducted with laser scanning. The data acquired were then elaborated with various software packages in order to obtain point clouds and a three-dimensional model in different cases, and a comparison of the various results obtained was carried out.
Background
The growing interest for the simplification of surveying operations and the reduction of the time needed for the elaboration and restitution of the data in the production of topographical data has resulted in a situation in which contemporary geomatics looks to avail itself of ever-more expeditious and automated techniques (Costantino & Angelini, Citation2012; Dardanelli, Paliaga, Allegra, Carella, & Giammarresi, Citation2015). In particular, until a few years ago, laser scanning technology was considered practically the only reference for the surveying and documentation of architectural or archeological sites (Di Salvo & Lo Brutto, Citation2014) or other artifacts of cultural heritage where a high level of accuracy was needed (Pirotti, Guarnieri, & Vettore, Citation2013); in fact, laser scanners were and are capable of furnishing dense, detailed and accurate point clouds rather simply. Recently, however, thanks to improvements in hardware and to new algorithms developed in the field of computer vision (CV), photogrammetry has emerged as a technique capable of competing with laser scanning (Bandiera, Beraldin, & Gaiani, Citation2011; Remondino & Poli, Citation2014). Indeed, with the arrival of digital cameras, the field of CV individuated algorithms that permit automatic orientation of pairs, triads, or sequences of images, developing the already known technique of “structure from motion” (SFM) (Ullman, Citation1979) which, integrated with the algorithms of dense image matching, allows for the production of three-dimensional models of the object surveyed in a short time (Barrile et al., Citation2015; Fonstad, Dietrich, Courville, Jensen, & Carbonneau, Citation2013). Recently, in addition, many have asked about the limits and potential of the techniques of image-based modeling (Caroti, Martinez-Espejo Zaragoza, & Piemonte, Citation2015; Di Paola, Inzerillo, & Santagati, Citation2013), many have compared and integrated SFM technique with spherical photogrammetry (D’Annibale, Citation2011) and other authors have investigated by comparing the results obtained with the Light Detection and Ranging (LIDAR) technique (Nex & Rinaudo, Citation2011) or with terrestrial laser scanning (Kersten & Lindstaedt, Citation2012; Skarlatos & Kiparissi, Citation2012; Teza, Pesci, & Ninfo, Citation2016; Tucci, Bonora, Conti, & Fiorini, Citation2015; Zhang, Schneider, & Straub, Citation2016); still others have arrived at the conclusion that the integration of terrestrial photogrammetry and UAV (Pueschel, Sauerbier, & Eisenbeiss, Citation2008), or photogrammetry and LIDAR (Franceschi, Martinelli, Gislimberti, Rizzi, & Massironi, Citation2015) can be a good solution in the case of a survey of complex structures. Currently research on the applicability of SFM is fervent; in literature many types of applications is reported, ranging form environmental applications to safety applications, only to cite some (Javernick, Brasington, & Caruso, Citation2014; Javernick, Hicks, Measures, Caruso, & Brasington, Citation2015; Johnson et al., Citation2014; Marteau, Vericat, Gibbins, Batalla, & Green, Citation2017; Ryan et al., Citation2015; Westoby, Brasington, Glasser, Hambrey, & Reynolds, Citation2012).
Materials and methods
Surveying with terrestrial imaging
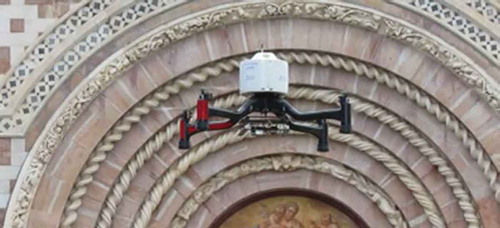
In November 2015, a survey of the façade of the Basilica di Collemaggio was conducted with the Trimble V10 Imaging Rover (, ), an original multi-camera system or “imaging rover” (IR). This IR is composed of 12 calibrated cameras that can operate simultaneously, arranged on two horizontal planes whose seven upper-level cameras provide a 360° panoramic view, while the five lower cameras are pointed 5° downward and provide a 200° field of vision that avoids shooting the operator during the acquisition of the data (Trimble, Citation2017a).
Table 1. Features of V10 imaging rover.
Figure 2. The Trimble V10 terrestrial imaging system: configuration for integration with total stations; on the right the visual field generated by the disposition of the cameras.
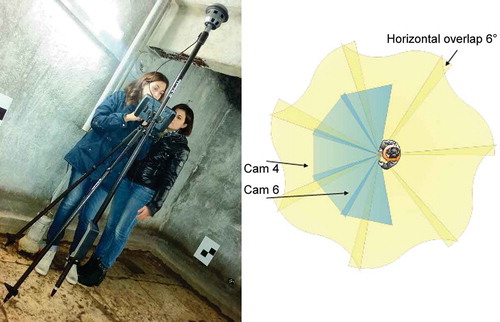
The multi-camera system, in addition to capturing panoramic images, also acquires the position of the center of the instrument with a double-frequency GNSS receiver for outdoor shoots, while indoors the same center of the instrument can mount a prism for seamless integration with total station measures. The IR generates point clouds from terrestrial panorama data to achieve a three-dimensional representation of a site or an object. The three-dimensional representation can potentially be used for area and volume computations, linear measurement and terrain modeling. The IR allows to capture a 60 MP panorama image at every station in less than 1 min acquisition; the provider suggest to perform at least three acquisitions from different points.
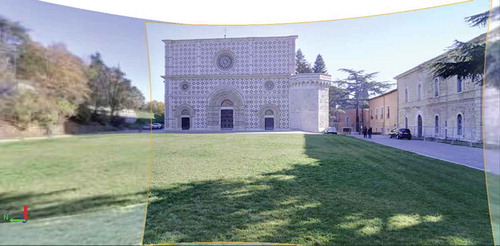
The configuration used for this particular test was multi-camera configured for integration with GNSS, given the good visibility of the sky and consequently of the GNSS constellations. As one can see in , which shows the screen of the controller at the end of an acquisition, the system furnishes the complete panorama but also allows for the visualization of single images from each camera ().
Figure 3. Screen of the controller during the acquisitions effectuated with the imaging rover (IR).
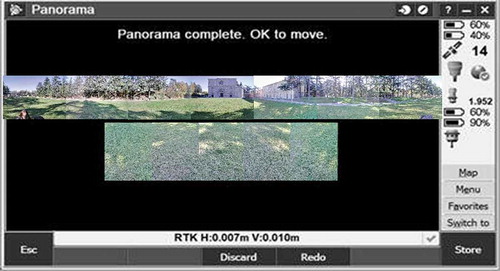
Figure 4. View from camera 4 of the multi-camera system.
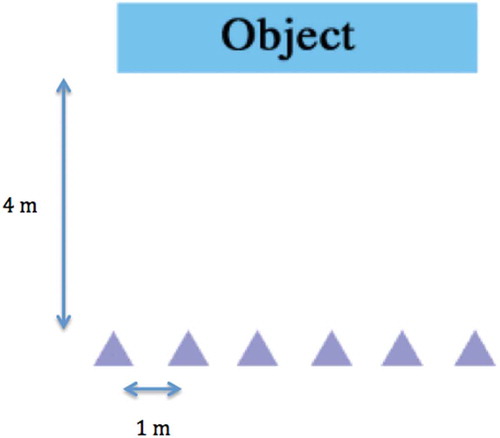
The survey guidelines specified by the manufacturer only specify that a ratio of 4:1 has to be observed, which is to say a base line of 1 m between each station for every 4 m of distance from the object to survey. As an example, if we are surveying an object from 4 m of distance, we have to make stations every 1 m each other ().
Figure 5. Survey guideline: ratio 4:1.
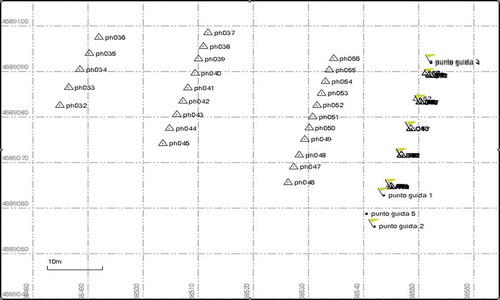
To verify these guidelines in this specific survey, a redundant number of acquisitions were performed to evaluate the influence of distance between station and object to be surveyed on the overall accuracy of the final results. The façade of the Basilica measures 29.5 m in width and 21 m in height; considering that the IR acquires up to a height of half the distance between IR itself and the object to be acquired, only the series of acquisitions from 60 m of distance can acquire the whole façade in this case. In fact, considering the vertical field of view, that from the Trimble specifications (Trimble, Citation2017a) results 39°, the distance to acquire all the façade, including the cross in the upper part of the roof, is cautiously estimated in 60 m, taking also in account the height of the IR of 1952 m. Starting from this distance of 60 m for the first sequence of acquisition, a baseline of 15 m was adopted following the Trimble guidelines (Trimble, Citation2017a) from one acquisition to the following. It was then decided to repeat other two series of acquisitions respectively at 20 and 40 m of distance from the Basilica; obviously the correspondent baselines were 5, 10 and 15 m as reported in .
Figure 6. Schema of the acquisitions carried out with the IR.
One might note that the survey at a distance of 60 m could have been sufficient on its own; but, as we said, the subsequent surveys were conducted to verify the variation of the metrical accuracy of the survey in function of the variations in the distance of the data acquisition. So, for the full horizontal survey of the façade, 5 stations at a distance of 60 m, 9 stations at a distance of 40 m, and 11 stations at a distance of 20 m were performed.
The elaboration of the survey was carried out with the software Trimble Business Center 3.50 (Trimble, Citation2017b), first executing the adjustment of the photo stations via the preliminary creation of tie points (TPs) automatically (, ), then a second adjustment was carried out with manual TPs individuating 88 of these (), in order to provide a comparison between the results obtained with the two different methodologies. The adjustment, in both cases, was carried out first on the survey performed at 60 m distance from the façade, and, subsequently, also adding, one by one, the other two surveys, from 40 and 20 m distance, respectively.
Table 2. Number of automatic tie points (TPs) obtained by Trimble Business Center for each project.
Figure 7. Tie points (TPs) defined automatically.
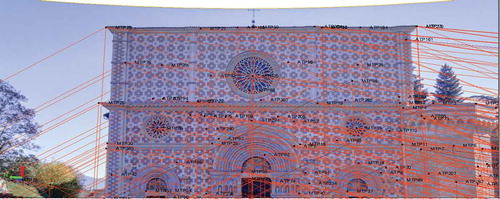
Figure 8. TPs defined manually.
The results obtained with automatic collimation and manual collimation are shown in the sequences of and where the progressive condensation of the point clouds is shown; this is particularly clear in the detail of the main door on the right.
Figure 9. Point clouds following the compensation of automatic TPs: (a) from the survey at 60 m; (b) from the integration of the surveys at 60 and 40 m; (c) from the integration of the surveys at 60, 40 and 20 m.
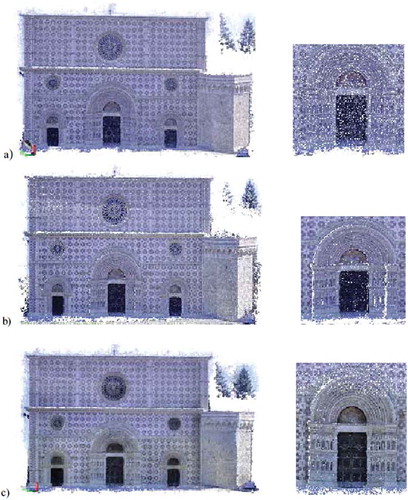
Figure 10. Point clouds following the compensation of manual TPs: (a) from the survey at 60 m; (b) from the integration of the surveys at 60 and 40 m; (c) from the integration of the surveys at 60, 40 and 20 m.
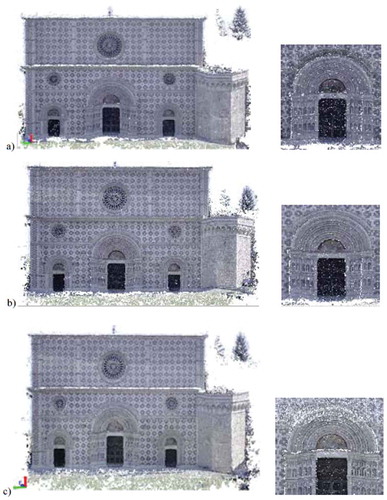
From a first comparison between the point clouds obtained with the two yet mentioned approaches, the dimensions of the object represented, in that in measuring the height and width of the façade, remain well represented in both cases. The greatest difference that one can observe is in the already mentioned presence of greater detail in the point clouds deriving from manual collimation of the TPs. Indeed, it has been observed that while the clouds obtained with automatic collimation of the TPs present some empty areas; in the opposite case this aspect is very limited, and even considering the point cloud obtained from the survey at 60 m, one can say that this latter contains a greater quantity of information.
UAV surveys
The aerial imaging was conducted with an Anteos A2-Mini/B UAV system (, ) equipped with a Canon S100 commercial camera with a focal length of 5.2–26.0 mm, and GPS “point positioning” navigational receivers principally useful for enabling the modalities of automatic flight and transmitting the telemetric data in real time to the control station on land. Such a survey was already conducted in the course of a previous study (Baiocchi, Dominici, Milone, & Mormile, Citation2013); the results obtained at that time were then re-elaborated by performing a new and more accurate analysis of the ground control point (GCP), eliminating some certain outliers and obtaining more accurate results.
Table 3. Features of ANTEOS Mini.
Figure 11. Survey with a UAV system of the Basilica di Collemaggio.
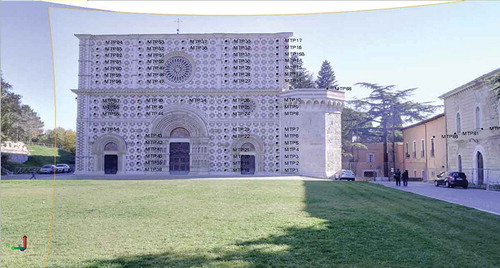
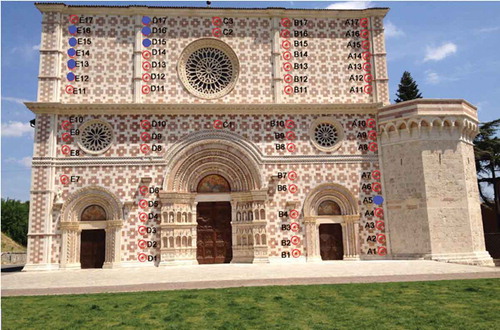
The photos were taken at a distance of 25 m from the façade, in such a manner as to obtain a pixel of around 2 cm of ground sample distance on the façade, evaluated on the final orthorectified image. A 5 cm of accuracy, of the same image, was evaluated on a set of points not used to orthorectiphy the image, so that to be independent from the photogrammetric model estimation and to be considered as check points (CPs). The acquisitions were planned so as to obtain a longitudinal and transversal overlap of 90%. In addition, another series of acquisitions was performed with the camera positioned with an angle of inclination of 20% downward. To correctly orient the survey photos, 63 GCPs were surveyed, as shown in , using total station and GPS/GNSS differential receivers.
Figure 12. Measured points on the façade of the Basilica di Collemaggio, in blue unused points, suspect outliers.
The camera calibration was performed with the specific procedure provided in Photomodeler Scanner 2010.0 (Photomodeler, Citation2017).
The elaboration was carried out with two packages: PCI Geomatica (Citation2012) (rigorous photogrammetric model) and Agisoft Photoscan (SFM model). The elaboration in PCI was carried on in the “Orthoengine” module, using a classical “Aerial Photography” model with “Digital/Video” option and computing exterior orientation “from GCP”. The Agisoft procedure was performed using suggested processing parameters (Agisoft, Citation2016) for “Align Photo” that are respectively: Accuracy “high”, pair preselection“reference”, key point limit “40000” and TP limit “1000”. Also for the “Build mesh” step suggested parameters were used, those are quality “medium” and depth filtering “aggressive”. Subsequently, in the “Optimize camera alignment”, all the camera parameters were selected, except the last: “Fit k4”; finally, in the “build dense cloud” mask, a “medium” quality and an “aggressive” depth filtering were selected. Photogrammetric rigorous model and RPC both produced a three-dimensional model of the façade, orienting the imagery thanks to the GCPs furnished, and, between the two, a slightly greater accuracy was obtained with PCI so the further comparison considered only this model. As we said the accuracy was evaluated on a sub-set of the 63 measured points () using them as CPs, that is not using them in the least square evaluation of the photogrammetric parameters of the two models.
Figure 13. Point cloud of the Basilica di Collemaggio produced by Agisoft Photoscan following a UAV survey and ground control points obtained with a total station.
Laser scanning survey
Several different surveys were subsequently conducted on the same façade after the main seismic event (Dominici, Alicandro, & Massimi, Citation2016), one of which, conducted with a Riegl Z210i laser scanner, is shown in , which displays the main technical characteristics of the instrument. This survey was used as a reference for the other surveys, due to its higher expected accuracy. The specific details of this survey are omitted here due to reasons of space but have been published and are available (Baiocchi, Dominici, Milone, & Mormile, Citation2014).
Table 4. Features of Riegl laser scanner.
Results obtained and their discussion
The comparisons between the different point clouds obtained by the individual surveys with the multi-camera system with respect to those conducted with the laser scanner and UAV are reported in this section. Such comparisons aim to evaluate the accuracy of the results obtained using the multi-camera system with respect to those obtained with the other instruments, in such a way as to evaluate what advantages might be obtained with this new technique with regard to both time and maintaining an adequate metrical accuracy of the survey.
The comparisons were carried out by calculating the distance between the clouds using Cloud Compare’s plug-in Cloud to Cloud Distance Computation. To calculate the distance, we have to choose one of the two clouds as the reference; from the points of the other model, the algorithm determines the nearest point in the reference cloud; the idea is to locally model the reference cloud (underlying) surface by fitting a mathematical model on the “nearest” point and several of its neighbors. In this case, we decided to use the quadratic height function mathematical model, being the longer to compute but also the more precise (CloudCompare, Citation2017).
With the use of the Cloud to Cloud Distance Computation plug-in, it was in fact possible to calculate, from time to time, the distances and their distributions, between the various clouds with respect to the reference model obtained by laser scanning.
Comparison between the multi-camera model and the terrestrial laser scanning model
The IR precision declared by the manufacturer on the datasheet results of 1 cm for every 10 m of distance from the object surveyed, and in the same manner, the declared accuracy of the cloud points is 0.001 times the distance of the instrument from the object surveyed. The laser scanner used, on the other hand, allows for a precision of 1.5 cm for every 50 m of distance from the object; it also allow for an accuracy of 1.5 cm. In this phase the deviations between the clouds obtained were assessed, in order to assess the quality of the IR survey.
The material available for the comparison of the results pertains to the survey conducted with the terrestrial laser scanner at a distance of around 20 m from the façade, while for the IR we have at our disposition two clouds obtained from the elaboration, one from collimation with the manual TPs and one from automatic collimation, from the survey at 60 m in distance from the façade, both from the integrated elaboration of the three surveys conducted at a distance of 60, 40 and 20 m, as well as the cloud obtained by the survey at 20 m in distance.
The first comparison was effectuated with the point cloud obtained from the multi-camera survey at 60 m, first through manual collimation of the TPs, then through automatic collimation ().
Figure 14. Absolute distance between multi-camera cloud points at 60 m, with manual TPs (a) and with automatic TPs (b), and the laser scanner cloud.
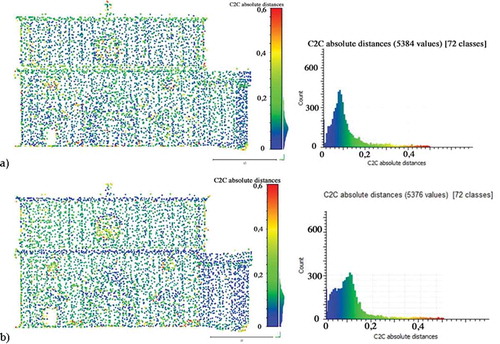
Comparing the two results obtained, one can observe that in the case of the cloud with manual TPs ()), there is an absolute distance between the two point clouds inferior to 0.1 m over almost the entire edifice, while greater distances, around 0.2 m, are found on the cornices, on the borders of the rose windows and around the doors of the basilica, where the laser-obtained clouds deviate more from those of the multi-camera. This is probably due to some type of “edge effect”. In the case of the cloud with automatic TPs ()), on the other hand, one can encounter an almost opposite trend, which is to say, greater distances from the façade, superior to 0.18 m, and lesser discrepancies on the elements listed previously, between 0 and 0.04 m. This is presumably to be attributed to a different distribution and to the greater number of automatic TPs recognized by the used software. As can also be seen in the previous graphics, one obtains a greater precision and accuracy from the comparison between a cloud derived from manual TPs and the laser scanner than from the other combination; one should note the closer distribution around the central value in the first case and the more disperse distribution in the second. Indeed, while in the first case the main differences are highlighted by a peak corresponding to about 0.08 m, resulting in a concentration around this; in the second case one encounters a second peak around 0.4 m that could suggest a systematic effect in the distribution of the differences up to the maximum peak of 0.14.
So, from these first tests it would seem that the automatic collimation does not yield the precision claimed by the instrument and the consequent accuracy of the point cloud, in contrast to manual collimation, which can yield values near to those claimed.
The second comparison was effectuated by integrating the data obtained from the three surveys with the multi-camera system at 60, 40 and 20 m from the façade ().
Figure 15. Absolute distance between cloud with manual TPs (a) and with automatic TPs (b) from the multi-camera system at 60, 40 and 20 m and the laser scanner cloud.
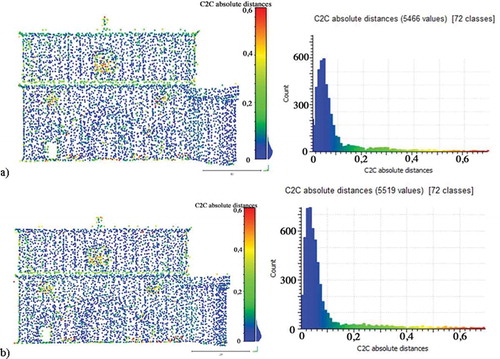
As one can observe, a reduction in the distance of the cloud with automatic TPs was obtained ()). Indeed, one no longer observes a systematic error and the peak is reduced to around 0.04 m, while the cloud with manual TPs presents a peak of 0.06 m ()). This is probably due to the fact that the number of TPs used for the compensation is significantly superior in the automatic case, thus resulting in a greater accuracy of the cloud.
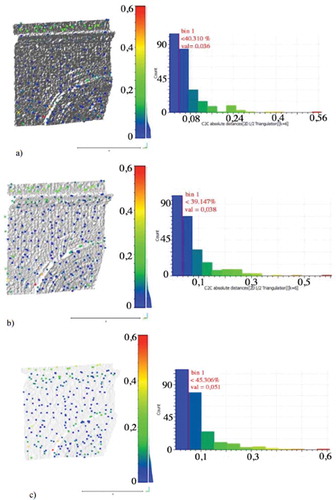
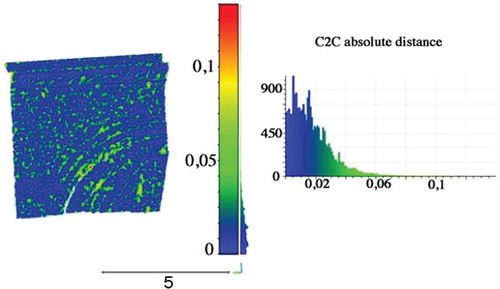
Finally, because the laser scanner survey was conducted at a distance of around 20 m, it was decided to effectuate a third comparison between the models taking into consideration the point clouds obtained from the survey with multi-camera system at the middle distance (), which should have an accuracy of 2 cm. It should be pointed out however that in this case the IR is not capable of yielding a complete cloud of the basilica, due to the restricted vertical visual field. As a matter of fact, the multi-camera system succeeds in capturing objects up to 10 m in height at a distance of 20 m, and since the façade is around 21 m, this yields a cloud that covers a bit less than half of the façade, so that for the laser the same area was selected.
Figure 16. Absolute distance between cloud from manual TPs (a) and with automatic TPs from (b) from the multi-camera system at 20 m and the laser scanner cloud.
Comparing the two results, no significant difference is observable between manual TPs ()) and automatic TPs ()); analyzing, then, the histograms of frequency of the absolute distance, one can see that for the first cloud there is a peak between 0.02 m and 0.04 m, while for the second it is between 0.03 m and 0.06 m. It should be stressed that, as with the previous comparisons, there are several points in red that present rather elevated distances, around 0.6–0.7 m. As one can note, these always correspond to the internal parts of the rose windows, because the laser sometimes succeeds even in penetrating the windows, while, as noted, the multi-camera system is based only on photographic images.
For this reason, from the comparison between the multi-camera system and the laser scanner, it emerges that if the survey is conducted at rather elevated distance from the object, or if the number of photo stations is low, then it is necessary to effectuate a manual collimation of the TPs in such a manner as to obtain an accuracy of the model extracted comparable to that obtained from a laser scanner. This is because during the phase of collimation it is the operator himself who chooses the optimal targets to use as TPs, and consequentially, also the correct distribution of the images at his disposition. On the contrary, if the number of photo stations employed is quite high, and if these have been carried out at different distances from the object, it is possible to effectuate an automatic collimation of the TPs obtaining precise and accurate results as well as thus reducing the time required for the elaboration of the data.
Comparison between the multi-camera model and the UAV model
The material available for the comparison of the results pertains to the survey conducted with a UAV at various positions and at a distance of around 25 m, with the camera aimed perpendicularly to the façade; as previously stated, a set of points extracted from the 63 GCPs recognized on the façade were used, eliminating seven that, from the comparison with the cloud obtained from the IR, resulted as outliers; the results obtained with the photogrammetric method (PCI Geomatic) and with SFM (Agisoft Photoscan) yielded results which were not significantly different, and for this reason we have reported only the comparisons between the IR cloud and the UAV SFM cloud, which are, in our opinion, the most directly comparable. As for the IR, the comparison will be carried out considering the only point cloud obtained by the integration of the surveys at three different distances and from the manual collimation of the TPs.
One can note in this case () that the differences between the two clouds are quite minor.
Figure 17. Absolute distance between the multi-camera cloud and the UAV and relative distribution.
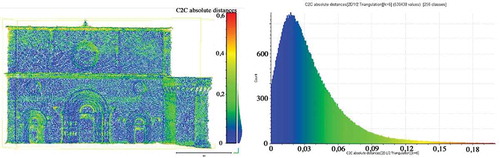
As a matter of fact, one observes a peak around 0.012 m, while greater distances (between 0.06 m and 0.09 m) are present on the cornices and on the elements in greater relief on the façade. Such differences are probably due to the fact that the multi-camera system captures its data from a relatively low point upwards and from various angles, while the drone captures its data from various positions. Therefore, the drone succeeds, for example, in integrating information on the upper part of the cornice while, on the other hand, the multi-camera system does not provide the same number of points. One should also note observable systemic variations represented in terms of colors that are slightly different in the upper part of the façade (in particular in the center), where they develop mainly horizontally, while in the lower part of the façade itself they develop mainly in vertical direction. It is to be excluded that these are due to a different orientation of the models; otherwise they would constantly have the same direction; they probably might be due to local effects of the SFM. In any case, the overall agreement is quite good.
One can therefore say that in the case of the surveys on the façade of the edifice, the results obtained from the survey with IR and those obtained with UAV are absolutely comparable if the drone flies with the camera positioned perpendicularly to the façade of the building. In addition, it is also interesting to see that surveys conducted in an independent manner and with different GPS points have a good correspondence among themselves, if one considers that the acquisition times with IR are significantly inferior, given that the reference points are acquired contemporaneously with the survey, while the UAV needs reference points on the façade which require a survey with GPS/GNSS receivers and total stations, appreciably lengthening the overall time needed for the survey.
Comparison of the surveys conducted with UAV and laser scanner
To understand if some bias were present in the reference data used, some further comparisons were made.
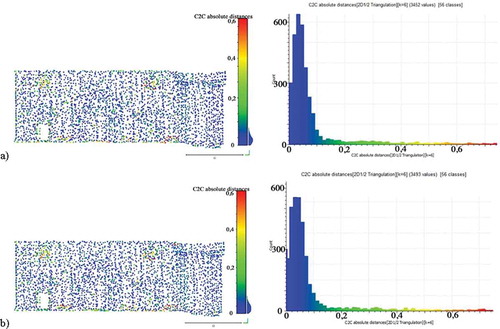
So, the Digital Elevation Model (DEM) from the Basilica pertinent to a detail of the area under examination, including part of the façade with its blocks of white and pink stone, part of the cornice and part of the arch of the main door, extracted at different resolutions (0.01, 0.02 and 0.04) with the PCI Geomatic software were compared with the results from the laser scanner survey previously carried out ().
Figure 18. (a–c): Clouds of Rigorous model DEMs from the detail of the façade extracted at the three resolutions compared with the laser results.
Observing the histograms, one notes that the absolute distance between the point clouds at the resolutions of 0.01 and 0.02 m and those of the laser is between 3.6 and 3.8 cm, while for the resolution at 0.04 m we have 45% of the points at a distance equal to 5 cm. One can see that the accuracy of the extracted models diminishes as the resolution diminishes: this is because, when the number of cloud points of reference diminishes, a number of average values are taken into consideration. The same argument does not apply with regard to the precision – in fact, all three models reveal themselves to be quite precise, because the majority of the values of the distances fall into the same range.
The results of the laser scanner survey were also compared with the cloud point obtained using an SFM model as implemented in Agisoft ().
Figure 19. Structure from motion (SFM) cloud of the detail of the façade compared with the laser.
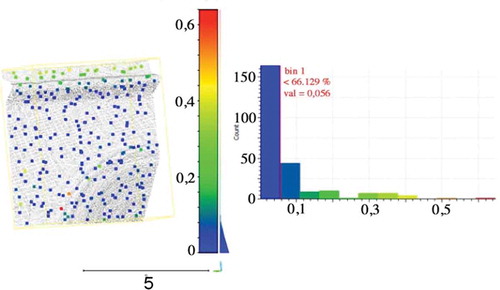
With SFM, 66% of the points show a distance equal to 6 cm, 1 cm less accurate than a DEM extracted using the rigorous model (as implemented in PCI) at a resolution of 0.04, but still quite precise.
Comparison Rigorous–SFM
Finally, a comparison between the clouds extracted with Rigorous model at the different resolutions and the cloud extracted with SFM () was performed.
Figure 20. (a–c): Rigorous model DEMs from the detail of the façade at the three resolutions compared with SFM cloud.
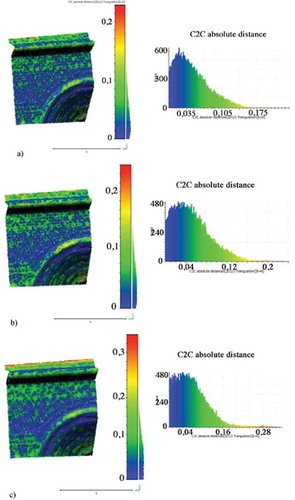
The three histograms show peaks around 2 cm; the distance is really quite low if one considers that we are comparing the results of two very different algorithms: Rigorous model as implemented in a program developed ad hoc for photogrammetry and the new SFM technique that has an almost completely automated workflow.
Comparison between the clouds extracted using Rigorous model at the different resolutions
A final comparison was made between the cloud points of the DEM extracted with Rigorous model in order to see how much they deviate, taking as a reference the cloud at 0.01 m resolution and comparing it first with that at a 0.02 m resolution () and then with that at 0.04 m ().
Figure 21. PCI DEMs of the detail of the façade extracted at 0.01 resolution compared with resolution at 0.02.
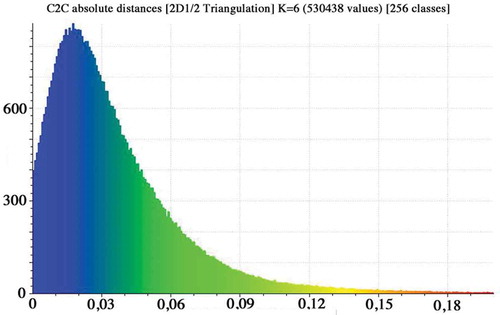
Figure 22. PCI DEMs of the detail of the façade extracted at 0.01 resolution compared with resolution at 0.04.
One sees that the absolute distance is really quite minimal between the resolutions at 0.01 m and 0.02 m; indeed, the peak has a value of 0.04 cm.
In this case as well the distance is minimal, so the accuracy proves comparable in the three different cases. The same argument does not hold with regard to the precision, which diminishes, even if not particularly significantly, because the histogram tends to broaden. This happens because when the resolution diminishes, the cloud points also diminish, and so average values become taken into consideration in calculation of the distance.
Conclusions
The work presented concerned the survey of the façade of the Basilica di Santa Maria di Collemaggio in L’Aquila, damaged in the 2009 earthquake, for which one wanted to test the metrical accuracy obtainable with an innovative system of terrestrial imaging. The aim of the study was to evaluate the precision and accuracy obtainable from the photogrammetric restitution of surveys previously conducted in different operational conditions and with different instruments, specifically with a UAV system and with laser scanning.
From the various cases analyzed, it emerges that the results obtained were in general compatible with the stated values.
In particular, the accuracy obtained by the integrated restitution of the images acquired by the IR at the three distances of 60, 40 and 20 m from the façade was compatible with that obtained by the restitution of the images obtained using a UAV at a distance of around 25 m, both with the PCI software and Agisoft Photoscan based on SFM algorithms, obtaining an absolute distance between the analyzed clouds mostly ranging from 0 to 6 cm.
As for the comparison with the laser scanner restitution, various cases were analyzed in function of the distance of the multi-camera system and of the photogrammetric restitution carried out with TPs manually individuated by the operator or automatically by the software. As previously shown, it emerged that in general the accuracy of the clouds obtained with the IR is compatible with the that of the laser scanner, with the exception of the notable points of deviation located on the rose windows and on the cornices and due to the diversity of the surveying techniques used as well as the greater precision of the laser systems for the survey of the details.
From the comparison between the multi-camera system and the laser scanner, distances between the clouds analyzed presented variables between 10 and 20 cm when the survey with the IR was conducted at significant distances, while the accuracy varies between 2 and 6 cm and tends to correspond to the theoretical accuracy of the instrument in case when the total number of photo stations employed is increased and the distance from the object is decreased. The greatest agreement between the IR and the UAV with respect to the laser can be explained by the different behavior of the IR and the UAV as opposed to the laser scanning in the presence of transparent or semi-transparent surfaces and on the edges or perhaps partly due to systemic problems of reference. To understand if in the reference models some biases were present, some reciprocal checks were also performed to complete the comparison.
Disclosure statement
No potential conflict of interest was reported by the authors.
References
- Baiocchi, V., Dominici, D., Milone, M.V., & Mormile, M. (2013). Development of a software to plan UAVs stereoscopic flight: An application on post earthquake scenario in L’Aquila city. Paper presented at the 13th International Conference on Computational Science and Its Applications, Ho Chi Minh City, Vietnam. doi:10.1007/978-3-642-39649-6-11
- Baiocchi, V., Dominici, D., Milone, M.V., & Mormile, M. (2014). Development of a software to optimize and plan the acquisitions from UAV and a first application in a post-seismic environment. European Journal of Remote Sensing, 47, 477–253. doi:10.5721/EuJRS20144727
- Bandiera, A., Beraldin, A.J., & Gaiani, M. (2011). Nascita ed utilizzo delle tecniche digitali di 3D imaging, modellazione e visualizzazione per l’architettura e i beni culturali. Ikhnos: Lombardi editore.
- Barrile, V., Bilotta, G., Lamari, D., Meduri, G.M., Monardi Trungadi, U., & Ricciardi, A., (2015). Computer Vision/structure from motion per la diffusione dei beni culturali. Paper presented at the 19° Conferenza Nazionale ASITA, Parma, Italy.
- Caroti, G., Martinez-Espejo Zaragoza, I., & Piemonte, A. (2015). Accuracy assessment in structure from motion 3D reconstruction from UAV-born images: The influence of the data processing methods. In ISPRS Archives (Eds.), International Archives of the Photogrammetry, Remote Sensing and Spatial Information Sciences. doi:10.5194/isprsarchives-XL-1-W4-103-2015
- Costantino, D., & Angelini, M.G. (2012). Process modeling and photogrammetric production for structural investigations concerning to the collapse of Palazzo Edilizia in Salerno (Italy). In Lecture Notes in Computer Science (including subseries Lecture Notes in Artificial Intelligence and Lecture Notes in Bioinformatics) (Vols. 7616 LNCS, pp. 440–448). 4th International Conference on Cultural Heritage, EuroMed 2012. Limassol, Cyprus. doi:10.1007/978-3-642-34234-9_45
- Dardanelli, G., Paliaga, S., Allegra, M., Carella, M., & Giammarresi, V. (2015). Geomatic applications to urban park in Palermo. Geographia Technica, 10(1/2015), 28–43.
- D’Annibale, E. (2011). Image based modeling from spherical photogrammetry and structure for motion. The case study of the treasury, Nabatean architecture in Petra. Geoinformatics, Faculty of Civil Engineering, Czech Technical University in Prague, 6, 62–73. doi:10.14311/gi.6.9
- Di Paola, F., Inzerillo, L., & Santagati, C. (2013). Image-based modeling techniques for architectural heritage 3D digitalization: Limits and potentialities. International Archives of the Photogrammetry, Remote Sensing and Spatial Information Sciences, XL-5/W2, 555–560. doi:10.5194/isprsarchives-XL-5-W2-555-2013
- Di Salvo, F., & Lo Brutto, M. (2014). Full-waveform terrestrial laser scanning for extracting a high-resolution 3D topographic model: A case study on an area of archaeological significance. European Journal of Remote Sensing, 47, 307–327. doi:10.5721/EuJRS20144719
- Dominici, D., Alicandro, M., & Massimi, V. (2016). UAV photogrammetry in the post-earthquake scenario: Case studies in L’Aquila. Geomatics, Natural Hazards and Risk, 1–17. doi:10.1080/19475705.2016.1176605
- Fonstad, M.A., Dietrich, J.T., Courville, B.C., Jensen, J.L., & Carbonneau, P.E. (2013). Topographic structure from motion: A new development in photogrammetric measurement. Earth Surface Processes and Landforms, 38(4), 421–430. doi:10.1002/esp.3366
- Franceschi, M., Martinelli, M., Gislimberti, L., Rizzi, A., & Massironi, M. (2015). Integration of 3D modeling, aerial LiDAR and photogrammetry to study a synsedimentary structure in the Early Jurassic Calcari Grigi (Southern Alps, Italy). European Journal of Remote Sensing, 48, 527–539. doi:10.5721/EuJRS20154830
- Javernick, L., Brasington, J., & Caruso, B. (2014). Modeling the topography of shallow braide drivers using structure-from-motion photogrammetry. Geomorphology, 213, 166–182. doi:10.1016/j.geomorph.2014.01.006
- Javernick, L., Hicks, D.M., Measures, R., Caruso, B., & Brasington, J. (2015). Numerical modelling of braide drivers with structure-from-motion-derived terrain models. River Research and Applications. doi:10.1002/rra2918
- Johnson, K., Nissen, E., Saripalli, S., Arrowsmith, J.R., McGarey, P., Scharer, K., … Blisniuk, K. (2014, October). Rapid mapping of ultrafine fault zone topography with structure from motion. Geosphere, 10(5), 969–986. doi:10.1130/GES01017.1
- Kersten, T.P., & Lindstaedt, M. (2012). Image-based low-cost systems for automatic 3D recording and modelling of archaeological finds and objects. In EuroMed 2012, Progress in cultural heritage preservation, LNCS 7616 (pp. 1–10). doi:10.1007/978-3-642-34234-9_1
- Marteau, B., Vericat, D., Gibbins, C., Batalla, R.J., & Green, D.R. (2017). Application of structure-from-motion photogrammetry to river restoration. Earth Surface Process and Landforms. doi:10.1002/esp.4086
- Nex, F., & Rinaudo, F. (2011). LiDAR or photogrammetry? Integration is the answer. Italian Journal of Remote Sensing, 43, 107–121. doi:10.5721/ItJRS20114328
- Pirotti, F., Guarnieri, A., & Vettore, A. (2013). State of the art of ground and aerial laser scanning technologies for high-resolution topography of the earth surface. European Journal of Remote Sensing, 46, 66–78. doi:10.5721/EuJRS20134605
- Pueschel, H., Sauerbier, M., & Eisenbeiss, H. (2008). A 3D model of Castle Landenberg (CH) from combined photogrammetric processing of terrestrial and UAV-based images. The International Archives of the Photogrammetry, Remote Sensing and Spatial Information Sciences, XXXVII-B6b, 93–98.
- Remondino, F., & Poli, D. (2014). Back to the future. Il ritorno della fotogrammetria. Geomedia, 18(2), 6–8.
- Ryan, J.C., Hubbard, A.L., Box, J.E., Todd, J., Chisoffersen, P., Carr, J.R., … Snooke, N. (2015). UAV photogrammetry and structure from motion to assess calving dynamics at Store Glacier, a large outlet draining the Greenland ice sheet. The Cryosphere, 9, 1–11. doi:10.5194/tc-9-1-2015
- Skarlatos, D., & Kiparissi, S. (2012). Comparison of laser scanning, photogrammetry and SFM MVS pipeline applied in structures and artificial surfaces. ISPRS Annals of the Photogrammetry, Remote Sensing and Spatial Information Sciences, I–3, 299–304. doi:10.5194/isprsannals-I-3-299-2012
- Teza, G., Pesci, A., & Ninfo, A. (2016). Morphological analysis for architectural applications: Comparison between laser scanning and structure-from-motion photogrammetry. Journal of Surveying Engineering, 142(3). doi:10.1061/(ASCE)SU.1943-5428.0000172
- Tucci, G., Bonora, V., Conti, A., & Fiorini, L. (2015). Benchmarking range-based and image-based techniques for digitizing a glazed earthenware frieze. ISPRS the International Annals of Photogrammetry, Remote Sensing and Spatial Information Science, II-5/W3, 315–322. doi:10.5194/isprsannals-II-5-W3-315-2015
- Ullman, S. (1979). The interpretation of structure from motion. The Royal Society. doi:10.1098/rspb.1979.0006
- Westoby, M.J., Brasington, J., Glasser, N.F., Hambrey, M.J., & Reynolds, J.M. (2012). Structure-from-Motion photogrammetry: A low-cost, effective tool for geoscience applications. Geomorphology, 179, 300–314. doi:10.1016/j.geomorph.2012.08.021
- Zhang, R., Schneider, D., & Straub, B. (2016). Generation and comparison of TLS and SFM based 3D models of solid shapes in hydrodynamic research. In The International Archives of the Photogrammetry, Remote Sensing and Spatial Information Sciences (Vol. XLI-B5). Prague, Czech Republic: XXIII ISPRS Congress.
Webpages
- Agisoft PhotoScan. (2016). Reference. Retrieved 24, 2017, from http://www.agisoft.com
- CloudCompare. (2017). Reference. Retrieved 24, 2017, from http://www.danielgm.net/cc/
- PCI Geomatica. (2012). Reference. Retrieved 24, 2017, from http://www.pcigeomatics.com
- Photomodeler. (2017). Reference. Retrieved January 18, 2017, from http://www.photomodeler.com/products/scanner/default.html
- Trimble. (2017a). V10 reference guide. Retrieved January 18, 2017, from http://www.trimble.com/Survey/Trimble-V10-Imaging-Rover.aspx
- Trimble. (2017b). TBC reference guide. Retrieved January 18, 2017, from http://www.trimble.com/Survey/trimble-business-center.aspx