
ABSTRACT
Crop distribution information is essential for tackling some challenges associated with providing food for a growing global population. This information has been successfully compiled using the Multi-Data Approach (MDA). However, the current implementation of the approach is based on optical remote sensing, which fails to deliver the relevant information under cloudy conditions. We therefore extend the MDA by using Land Use/Land Cover classifications derived from six multitemporal and dual-polarimetric TerraSAR-X stripmap images, which do not require cloud-free conditions. These classifications were then combined with auxiliary, official geodata (ATKIS and Physical Blocks (PB)) data to lower misclassification and provide an enhanced LULC map that includes further information about the annual crop classification. These final classifications showed an overall accuracy (OA) of 75% for seven crop-classes (maize, sugar beet, barley, wheat, rye, rapeseed, and potato). For potatoes, however, classification does not appear to be as consistently accurate, as could be shown from repeated comparisons with variations of training and validation fields. When the rye, wheat, and barley classes were merged into a winter cereals class, the resultant five crop-class classifications had a high OA of about 90%.
Introduction
Sustainable production of sufficient food for the growing earth population is a challenge (Godfray et al., Citation2010). Dealing with this challenge requires, among other data, timely information about the distribution of agricultural crops. Timely means that the information is at least provided annually, as crop production is usually linked to a yearly growing season. However, for harvest forecast estimation based on the acreage, the crop classification maps are already needed during the growing season (McNairn, Kross, Lapen, Caves, & Shang, Citation2014). Once this spatial crop information is available, regional agroecosystem models can be established (Reichenau et al., Citation2016; Simmer et al., Citation2015) and the crop status monitored (Zhao et al., Citation2015). It is even possible to estimate a crop’s yield before harvest (McNairn & Shang, Citation2016), which permits better planning of the available resources. Yet, this essential crop information is rarely available in official geodata statistics.
Information about land use/land cover (LULC) is widely obtained using remote sensing. Remote-sensing-based LULC and crop distribution mapping at a regional scale is usually performed using optical remote sensing data of moderate spatial resolution (Atzberger, Citation2013), synthetic aperture radar (SAR) data (McNairn & Shang, Citation2016), or a combination of both (Blaes, Vanhalle, & Defourny, Citation2005; Forkuor, Conrad, Thiel, Ullmann, & Zoungrana, Citation2014; McNairn, Champagne, Shang, Holmstrom, & Reichert, Citation2009). Prominent are the optical data from the Landsat mission, which have been extensively used for crop-type mapping (Bauer, Hixson, & Davis, Citation1978; Buechel, Philipson, & Philpot, Citation1989; Homer, Huang, Yang, Wylie, & Coan, Citation2004; Oetter, Cohen, Berterretche, Maiersperger, & Kennedy, Citation2001; Tatsumi, Yamashiki, Canales Torres, & Taipe, Citation2015). Lately, the Sentinel constellation, consisting of optical and radar satellites has also been successfully used for this purpose (Bargiel, Citation2017; Immitzer, Vuolo, & Atzberger, Citation2016).
However, classifying the highly dynamic annually grown crops based on remote sensing images usually involves multitemporal acquisitions because obtaining the crop distribution from one single acquisition is not sufficient (Brisco & Brown, Citation1995; Bush & Ulaby, Citation1978; Siachalou, Mallinis, & Tsakiri-Strati, Citation2015; Skriver, Citation2012; Sonobe, Tani, Wang, Kobayashi, & Shimamura, Citation2014; Van Niel & McVicar, Citation2004). One reason is the spectral or radiometric limitation of contemporary sensor systems (Vinciková, Hais, Brom, Procházka, & Pecharová, Citation2010), but the biggest issue is the similarity in reflectance of the fields during most phenological stages. Some crop types are only distinguishable at specific times of the year and appear similar throughout the rest of the growing season. A proper planning of the dates of image acquisition and finding the optimal acquisition windows (AW) for the region of interest are therefore crucial (Foerster, Kaden, Foerster, & Itzerott, Citation2012; Van Niel & McVicar, Citation2004).
Besides the multitemporal approach, LULC mapping can also be performed using existing external geodata from mapping agencies (Homer et al., Citation2004; Lu & Weng, Citation2007; Smith & Fuller, Citation2001). Fusing crop classifications with such data has the advantage that the area that is not used for agricultural production can be excluded from the analysis, which lowers misclassification and allows a more disaggregated LULC analysis. One prominent example is grassland within urban areas: Solely based on the reflectance analysis, it is impossible to differentiate between an urban green area (for example for recreational purposes) and agricultural grassland. However, this is possible using data from the relevant authority.
LULC classifications enriched with missing information about annually grown crops is also the main focus of the Multi-Data Approach (MDA) (Bareth, Citation2008; Waldhoff, Curdt, Hoffmeister, & Bareth, Citation2012; Waldhoff, Citation2014; Waldhoff & Bareth, Citation2009; Waldhoff, Lussem, & Bareth, Citation2017). It combines multitemporal remote sensing images and external geodata to produce LULC maps, including information about the crops grown each year. It was successfully developed and applied to the Rur catchment in the west of Germany (Waldhoff et al., Citation2017) and, interestingly, provided ideal points of time for optical image acquisition. However, the existing MDA has a drawback: it has only been implemented using optical data. Unfortunately, frequent cloud coverage means that, even when multiple optical data sources and external geodata are used, appropriate data coverage for optimal crop differentiation is rarely available (Blaes et al., Citation2005; Whitcraft, Vermote, Becker-Reshef, & Justice, Citation2015). If no image can be acquired for a particular timeframe, the accuracy of the classes to be separated within that timeframe inevitably decreases.
To prevent clouds from lowering accuracy, microwave images produced by SAR have been used for crop classification in many scenarios (e.g. recently, Bargiel, Citation2017; Hütt, Koppe, Miao, & Bareth, Citation2016; Lussem, Hütt, & Waldhoff, Citation2016; Sonobe et al., Citation2014), or they have been combined with optical acquisitions (Blaes et al., Citation2005; Forkuor et al., Citation2014; McNairn et al., Citation2009). Radar-based crop identification goes back to Simonett (Citation1967). Bush and Ulaby (Citation1978) highlighted the significance of multitemporal radar measurements for successful crop classification. Hoogeboom (Citation1983) successfully identified crops on the ground in experiments with airborne SAR images. Since then, crop classification capabilities of SAR systems have been demonstrated in many studies (e.g. Foody, McCulloch, & Yates, Citation1994; Skriver, Citation2012), recently particularly on board satellites (McNairn & Shang, Citation2016).
SAR sensors have the advantage of working regardless of the weather and illumination conditions on the ground. Consequently, capturing images during the crucial crop stages does not depend on cloud-free conditions. Additionally, SAR allows polarimetric analysis of the electromagnetic wave, which enables differentiation of scattering mechanisms on the ground (Cloude & Pottier, Citation1997). In a crop classification context, these mechanisms are related to crop phenology (Koppe et al., Citation2013; Lopez-Sanchez, Cloude, & Ballester-Berman, Citation2012), but most importantly to crop type (Skriver, Svendsen, & Thomsen, Citation1999), and hence are well suited to crop classification. However, most SAR-based crop classification studies usually neglect to fuse the classification with external official geodata (e.g. McNairn et al., Citation2009; Skriver, Citation2012; Sonobe et al., Citation2014). One exception to this lack was the study by Bargiel (Citation2017). However, in that study the external data was merely used to mask out non-crop areas during the classification process and not to enhance existing geodata.
The previous research has therefore shown that the MDA is useful as it fuses remote sensing images with external geodata, but it uses optical remote sensing images for its implementation and thus requires cloud-free conditions. The MDA would be improved if it were to use SAR, which delivers images even under cloudy conditions. Enhancing the MDA framework by integrating SAR images is consequently a logical next step in improving timely information about crop distribution. This study therefore focuses on three objectives: (I) Examining whether those points in time that proved ideal for optical image classification are also valid for dual-polarimetric TerraSAR-X images. (II) Investigating the potential of using the images to differentiate crops. (III) Studying how to apply the concept of the MDA to fuse the SAR-based classifications with external geodata and thus to produce a crop type enriched LULC map.
Study site and data
Rur catchment
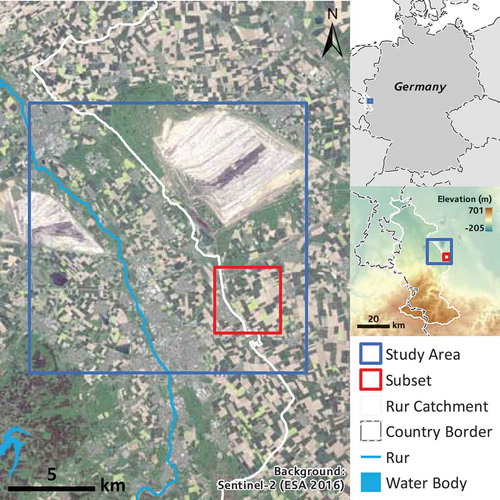
The Rur catchment is located in Western Germany and partly in Belgium and the Netherlands. shows the study area, located in the northern part of the Rur catchment. Arable land dominates this area on a fertile loess plain. The fertile soil and the warm-temperate climate with sufficient precipitation make the area ideal for intensive agriculture. The main crops are winter wheat, winter barley, winter rye, sugar beet, maize, rapeseed, and potato (IT.NRW, Citation2012).
Figure 1. Location of the study site. Image Background: Sentinel-2 image acquired 08.05.2016, Band Combination 4-3-2.
TerraSAR-X radar data
The radar remote sensing satellite TerraSAR-X was successfully launched in 2007. It provides x-band microwave images in different imaging modes, resulting in various resolutions and different polarization combinations (Breit et al., Citation2010). For this study, we acquired six high-resolution TerraSAR-X dual-polarimetric (HH/VV) stripmap scenes between May and August 2013. These six SAR images are a time series taken from the same relative orbit; this means the satellite was at almost the same position during the image acquisitions. Consequently, all images have a similar viewing geometry, extent, and resolution and similar geometric distortions. The individual image characteristics and exact imaging dates are specified in .
Table 1. Radar remote-sensing image statistics.
Field campaign and collection of ground data
During the growing season of 2013, the real ground situation was mapped by visiting selected agricultural areas of the region at times chosen according to the phenology and management practices of the selected crops. presents an overview of the quantity and the size of the fields used for this study.
Table 2. Overview of collected reference data.
Ancillary and official geodata for the MDA
MDA generally aims to combine multitemporal remote sensing classifications and external geodata. In this study, the German Authoritative Topographic-Cartographic Information System (ATKIS), as the official Digital Landscape Model (DLM), and Physical Blocks (PB) data were chosen.
ATKIS provides details of feature boundaries, and land cover information in vector format. The spatial accuracy is at least ±3 m (AdV, Citation2006) for the ATKIS Basis DLM, which is sufficient for our investigation considering a spatial resolution of 15 m of the final classifications.
PB were used for the delineation of agricultural areas (Waldhoff et al., Citation2017), they consist of land parcels of the same land use type (e.g. arable land, Grassland or permanent crops), which are always enclosed, e.g. by a road (Landwirtschaftskammer NRW, Citation2011). No individual parcels with a single crop type can be differentiated in this way, but at least, on an annual basis, agricultural areas can be separated from other land use types. For our study site, the PB data were provided by the Landwirtschaftskammer NRW (Citation2016). However, PB are part of the European Union (EU)-wide Land Parcel Identification System (LPIS) and therefore similarly available for the whole of the EU.
Methods
Separation of crops using acquisition windows
For this region, Waldhoff et al. (Citation2017) studied the optimal point in time (AWs) to separate the crops of the region using optical remote sensing images. AWs are time periods during the growing season during which crop separation is most favorable in this specific region. Based on the theory behind AWs, optimal crop separation is possible when at least one image for each of the AWs is available. As can be seen in , separation is based either on a different crop phenology or on different crop-specific management practices, which both lead to changes in reflectance when optical images are used. In the radar images utilized in this study, the changes led to different backscattering mechanisms, which can be detected using radar polarimetry (Skriver et al., Citation1999). The TerraSAR-X acquisition dates match the AWs proposed by Waldhoff et al. (Citation2017). As can be seen in , in our study at least one image exists for every AW, except for AW5, which has the same purpose as AW4 and normally serves as a backup window when no image can be acquired in AW4.
Table 3. Acquisition windows (AW) for optimal crop separation in the Rur area, adopted from Waldhoff et al., (Citation2017).
Preprocessing of the TerraSAR-X images
For a successful crop classification, it was necessary to extract all relevant information contained in the TerraSAR-X microwave images. shows the processing chain for each acquisition, the multitemporal combination and the fusion with the external geodata. First, from each dual-polarimetric TerraSAR-X scene, we derived the absolute backscatter values in dB to analyze the amount energy received from the ground. Additionally, to include information about the scattering mechanism, the following polarimetric features were retrieved: dual-pol entropy, dual-pol alpha angle, the degree of polarization (Cloude, Goodenough, & Chen, Citation2012), and the covariance matrix elements C11, C12 (real and imagery), C22. Following this, a multilooking of nine pixels in range and six in azimuth was conducted, which, although it reduces the spatial resolution, minimizes the speckle effect. To project the images to the ground, a Range Doppler Terrain Correction as described by Curlander and McDonough (Citation1991) was performed using the digital elevation model (DEM) from the SRTM mission (Jarvis, Reuter, Nelson, & Guevara, Citation2016). The low error of the SRTM in the study region (Bhang, Schwartz, & Braun, Citation2007) and the high geometric accuracy of TerraSAR-X (Nonaka et al., Citation2008) result in a high geometric accuracy of the final images and consequently also of the classifications. Hence, the classifications from TerraSAR-X are suited for fusion with other geodata and do not require manual orthorectification.
Figure 2. Workflow diagram to create the final LULC map from TerraSAR-X images, the ground survey, and the external geodata.
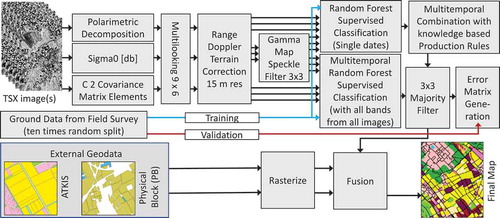
During the projection to the ground, the final pixel size was set to 15 m. This resolution was considered sufficient to differentiate single parcels and was chosen as a tradeoff between computation efficiency and accounting for the expansion of roads and accompanying non-agricultural vegetation, such as grass or shrubs that dissect agricultural landscapes. It is also the same spatial resolution as the annually created MDA land use classifications, which are generated for the whole Rur catchment using optical images (Waldhoff et al., Citation2017).
Finally, all bands were filtered using a gamma map speckle filter with a moving window size of 3 × 3. The unfiltered and filtered image bands were stacked and utilized for the supervised classification.
Supervised single-date and multitemporal classification
For the supervised classification, the polygons representing the fields were randomly separated 10 times into a training dataset and an independent validation dataset. Subsequently, to minimize field border effects, a 15 m buffer was subtracted from the boundaries of the fields. All individual rasters derived from one single TerraSAR-X scene were used to create the single-date classifications. The random forest (RF) classifier was used because it is superior to other algorithms (Ok, Akar, & Gungor, Citation2012) and well suited to crop classification scenarios using SAR data (Hütt et al., Citation2016; Sonobe et al., Citation2014). The parameters of the RF classifier were left to the default values of the used R-language library. The numbers of features randomly chosen at each node were determined by the square root of the available variables. The number of trees was set to 500. As the parameter node size was set to unlimited; the full tree was grown at each classification.
For the multitemporal classification, two approaches were investigated: First, all image bands that were used for the single-date classifications were stacked and classified using the RF classifier. The second method is inspired by optical image analysis and the MDA proposed by Bareth (Citation2008). That procedure combines remote-sensing land use classifications and uses expert knowledge-based production rules, which allow incorporation of multitemporal information on crop phenology and management practices (Waldhoff et al., Citation2017). The rules were applied to the stack of all single-date classifications and developed based on the error analysis, knowledge of plant phenology and logic. For example, if a pixel was identified as a summer crop, e.g. bare ground, in the first acquisition, this pixel will then not be classified as a winter crop based on a later acquisition. This approach is more user-controlled than others, and valuable information for each crop can be extracted (Waldhoff et al., Citation2012).
A majority filter with a 3 × 3 window size was used to enhance the accuracy of all final classifications. The accuracy was assessed using the independent validation part of the ground reference data. Based on the resulting error matrix, accuracy statistics such as the overall accuracy (OA), the user’s and producer’s accuracy (Congalton, Citation1991), and the F1-score (Bargiel, Citation2017) for each class were produced. These statistics are used to evaluate the accuracy of the classifications, both single-date and multitemporal, and helped to develop the production rules for the multitemporal classification.
Software packages used
Preprocessing of the TerraSAR-X radar data was done using the open source software SNAP provided by the European Space Agency. The RF classification was implemented in R using the RF library (Liaw & Wiener, Citation2002) and a modified R script made available by Horning (Citation2016). Expert knowledge rules were executed using the ArcGIS Python scripting extension. Error matrix generation, accuracy evaluation, and map generation were also performed using ArcGIS.
Results
Single-date classifications and optimal point in time to separate the crops
Using the time series of six TerraSAR-X acquisitions made it possible to identify points in time to separate the region’s crops. presents the overall accuracy of the single date and the multitemporal classifications. shows the resultant F1 scores of the different LULC classes over time. It shows that the very early acquisition in the middle of May resulted in the highest class-accuracies for rapeseed (97%), and a relatively good separation for potatoes (77%). However, the 10 repetitions with different training and validations fields revealed a high standard deviation of 31% for the accuracy in identifying the potato class. Furthermore, the early acquisition is necessary to separate the winter crops wheat, rye, and barely from the summer crops maize and sugar beet. While the winter crops have a full canopy closure at the time of the first acquisition, the summer crops are generally characterized by bare soil.
Figure 3. Mean overall accuracy of the single dates and the multitemporal approaches; seven classes and five classes (after merging barley, rye, and wheat to winter cereals). The error bars indicate one standard deviation of the 10 random splits into training and validation datasets.
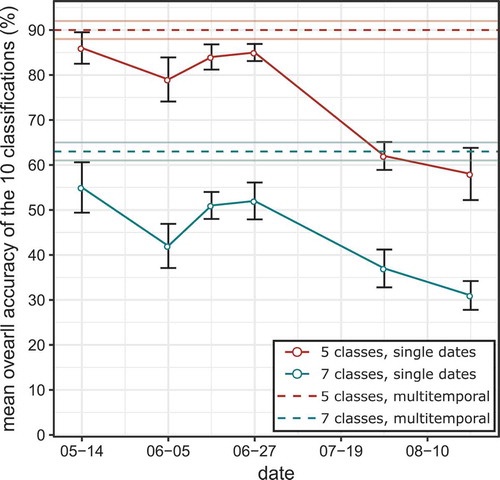
Figure 4. F1-scores (in %) of the classes in the single-date classifications and the multitemporal accuracy. Error bars indicate one standard deviation of the 10 random splits into training and validation.
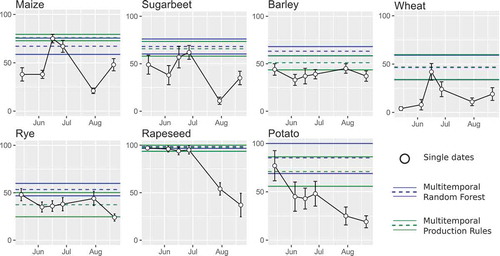
A further analysis of the accuracy over time shows that rapeseed is very well classified in the images taken before harvest. Based on experience from the optical analysis, we anticipated that, for the summer crops sugar beet and maize, the second half is more important. Strikingly, the highest accuracies were observed in the third and fourth date (16th and 27th June), where the maize plants and the sugar beet plants had just emerged. Although the winter cereals barley, wheat, and rye are easily distinguishable from all other classes, no optimal point in time for their disaggregation could be identified as attempts to classify them using the single dates rarely exceeded 50% accuracy.
Class accuracies of the multitemporal supervised crop classification
By using the multitemporal information of the six dual-polarized TerraSAR-X acquisitions, it was possible to create improved multitemporal classifications. The winter crops barley, wheat, and rye were easily separable from the summer crops maize and sugar beet, mainly based on the good separation in the 1st acquisition. The classification accuracies of rapeseed and winter cereals were increased by the multitemporal analysis and reached the highest single-class accuracies of up to 99%. Potatoes were classified with an adequate accuracy (RF 85%, Production Rules 71%), but the high standard deviation of those accuracies found in the single-date classification from the first date could not be lowered in the multitemporal approaches and remained at the high level of about 32%. The disaggregation of maize and sugar beet had lower F1-Scores of 66–76%, mostly due to misclassification within the two classes but also from a confusion with potato. In this study, disaggregation of the winter cereals into barley, wheat, and rye was not satisfyingly possible.
Comparison of the multitemporal classification approaches
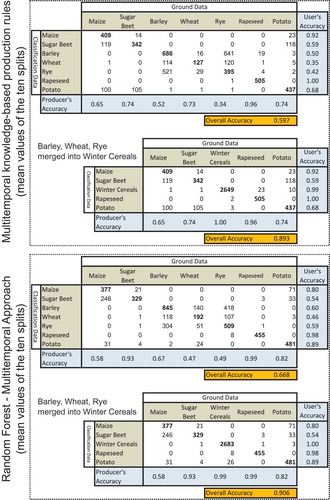
A comparison of the two multitemporal approaches shows that the multitemporal RF classification delivered a 7% higher OA for the seven crops classification (), the multitemporal combination with knowledge-based production rules still extracted most of the multitemporal information and provided an OA of 60% (). By merging the winter cereals, a higher accuracy 5-crop classification was created, with an accuracy of about 90% for both approaches. However, due to the relatively high variance of the accuracies depending on which combination of training and reference fields was taken (exact values in ), a significant difference in the mean OA between the two approaches could not be found in this study. By using 10 repetitions, with different training and validation fields, a significantly lower standard deviation of the accuracies of the knowledge-based approach could be achieved (F-test, < 5%, n = 10). The efficient production rules meant that the computational resources were used more efficiently: no new classifications had to be performed. However, the very long runtime for the multitemporal RF given in could be shortened by tuning the parameters of the RF classifier. The visual comparison of the maps created by the two approaches justifies the accuracy analysis above; major differences are rare. The RF classification maps contain specific errors that are seldom found in the knowledge-based result. For example, as can be seen from the comparison in , winter wheat is sometimes obviously confused with maize. In the knowledge-based approach, misclassification is more likely to appear only within the summer or winter crops.
Table 4. Comparison of the two multitemporal approaches.
Figure 5. Map of the final classification. The lower part shows the difference between the production rules and the multitemporal random forest approach.
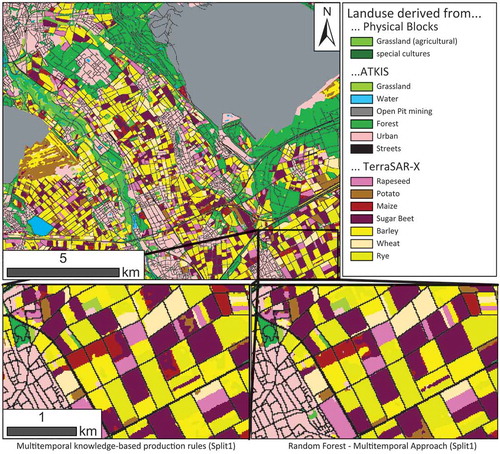
Figure 6. Mean error matrices of the two multitemporal methods.
Fusion of the classifications with external geodata ATKIS and PB
shows the final LULC map. The high geometric accuracy of the TerraSAR-X classifications and the very low positional error of ATKIS and PB allowed a fusion without the need for additional co-registration. The data sets match on the pixel level. To lower misclassification, all non-agricultural classes were excluded from the classification process. Also, an enhanced LULC map including all information from ATKIS, PB, and the missing information of crop type is available. For demonstration purposes, to produce the map shown in , the ATKIS and PB data were reclassified, allowing the datasets to be generalized. Originally, the ATKIS dataset contained numerous different LULC classes on transportation, built-up areas, agricultural land and other vegetation (AdV, Citation2006). The complete PB data provide information about coherent parcels of the same agricultural land use type, such as arable land, grassland, and permanent crops (Landwirtschaftskammer NRW, Citation2011). All original LULC classes are available in the geographic information system (GIS).
Discussion
Objective I: optimizing the acquisition plan based on the findings of this study
Based on crop development and crop management practices in the Rur area, earlier studies (Waldhoff et al., Citation2012; Waldhoff, Citation2014; Waldhoff et al., Citation2017) identified five AWs () during which optical remote sensing images should be acquired if the annually grown crops are to be successfully identified. The first objective of our study was to assess whether the AWs from that study still held for TerraSAR-X images. Our study’s TerraSAR-X images are a high-resolution times series that can be acquired independently of cloud conditions. Consequently, the differences in the radar images are mostly influenced by altering conditions on the ground and not by different viewing geometries or atmospheric conditions at the time of image acquisitions. Therefore they provide more insights on optimal points in time for crop classification. From our results, we suggest three adjustments to the acquisition plan proposed by Waldhoff et al. (Citation2017):
The last AW is obsolete when using SAR data as it serves the same purpose as AW4. It merely exists as a backup window in case there is no cloud-free image from AW4.
A new AW between AW2 and AW3 is needed as the classification from the third and fourth acquisition () showed the highest accuracy of the classes maize and sugar beet (). While, in optical analysis, those classes are best separated very late in the growing season (Waldhoff et al., Citation2012), TerraSAR-X seems most sensitive to the different structure of the emerging plants, which can be seen in relatively high F1 scores of maize and sugar beet in the acquisitions three and four (). Being able to separate the two classes when the plants are still small enables an early mapping of the two classes and confirms the findings by McNairn et al. (Citation2014), who show that TerraSAR-X and Radarsat-2 imagery can be used to separate maize from soybeans within the growing season. However, as planting dates for maize can vary between regions, farmers, and seed variety, data from later AWs may still be useful.
In optical remote sensing, the separation of rapeseed from the winter cereals is mainly achieved by using the bright yellow color of the flowering rapeseed plant. Hence, a thorough planning of the optical acquisitions is needed to image all rapeseed fields during the flowering stage. In this study, identification of rapeseed is highly accurate in all classifications of the first four images (). Fieuzal, Baup, and Marais-Sicre (Citation2013) have already demonstrated that the signal from polarimetric SAR is susceptible to the different crops types rapeseed and winter wheat. Those results are confirmed by our study, in which the separation works well for a prolonged time. Consequently, careful planning to identify rapeseed seems less important.
Objective II: crop differentiation potential of multitemporal and dual-polarimetric TerraSAR-X data
In this study, the classes rapeseed, potato, and winter cereals were mapped with high accuracy. TerraSAR-X can collect the scattering mechanisms related to different crops, crop growth stages, and management practices. Consequently, our study agrees with existing research, e.g. Skriver et al. (Citation1999), who report that multitemporal SAR backscattering signatures capture crop differences well, using correlation coefficients of HH- and VV-polarization, as we did in this study.
The accuracies for maize and sugar beet were moderate due to confusion within the two classes (and with potato), probably because both crops have a broad-leaved plant structure and a similar phenology, leading to a similar x-band temporal signature. However, classification accuracy could be improved by using the different heights of maize and sugar beet at the end of the growing season. Hütt, Tilly, et al. (2016) showed how the height of maize plants could be measured using SAR data from the TerraSAR-X Add-on for Digital Elevation Measurements (TanDEM-X).
A further differentiation of the winter cereals into barley, wheat, and rye was not possible with the data from this study. Interestingly, the same classes show the highest errors in a study performed by Skriver (Citation2012) with multitemporal airborne C- and L-band SAR data. Recently, Bargiel (Citation2017) showed that the winter cereals could be successfully differentiated using c-band radar data of very high temporal resolution from the Sentinel-1 satellite. Such data could be incorporated in future similar studies.
The experiment of 10 times randomly splitting the training and validation data during the classification process revealed a high variance of the accuracy of the class potato. This high variance probably has two reasons: (1) the inconsistent management practices. Due to different varieties, planting and harvesting dates are not as fixed as for the other crops in this study; (2) the characteristics of potato fields in this region. Potatoes are grown by digging long hilly rows. Theoretically, the measured SAR backscatter values vary depending on the orientation of the rows toward the SAR sensor. Lowering the accuracy variation requires more training fields and a higher temporal resolution, which would allow all row-sensor orientations and the different management practices to be covered.
The two multitemporal approaches of this study both resulted in higher classification accuracies than the single-date classification. While a slightly higher accuracy was achieved using the RF classification of all input bands, the production rules had a lower variance of accuracies and a better runtime. Both approaches benefitted from the MDA as the acquisition dates were chosen according to the principles of AWs during the growing season, based on the crop-specific phenology. The findings from the knowledge-based approach are also crucial for improving accuracy in the future and finding the reasons for non-optimal results. Consequently, the RF approach with all input bands and the integration of expert knowledge on crop phenology are promising ways to obtain parcel-based crop maps from multitemporal TerraSAR-X acquisitions, without the cloud-free limitations of optical data.
Objective III: fusion of the SAR classifications with external geodata to produce crop type enriched LULC maps
The fusion of the final classifications with the external geodata ATKIS and PB prevented possible confusion with all non-crops classes, such as urban, forest, streets, and grassland. The missing information about annually grown crops is retrieved from the remote sensing data. The combination allows the production of enhanced LULC maps, as shown in . Additionally, the high spatial accuracy of both the TerraSAR-X data and the external geodata made any orthorectification obsolete, which enhances the quality of the final maps and improves the efficiency of their creation.
Study results in an operationalization context
Compared to other studies (e.g. Bargiel (Citation2017)), fewer reference fields were used in this study. The reduction is useful as it reduces the costs of surveys on the ground. However, the identification of various classes, such as the potato in this study, is less accurate, and the variance of the accuracy is greater depending on which fields are taken for training the classifier. Contrariwise, the eight rapeseed fields in this study were found to suffice as the 10 repetitions revealed a high accuracy, but more importantly, a low accuracy variance. These results show that the amount of training data needed strongly depends on the class being observed. However, in an operational context, to calculate the high costs of field surveys, it would be essential to know beforehand the exact amount of ground data needed. This knowledge could be gained, e.g. through an optimization approach, such as that presented by Mathur and Foody (Citation2008).
A shortcoming in an operationalization context is the problem of transferability to another region, which is also reported by Siachalou et al. (Citation2015). As the AWs for crop classification are regionally specific and climate dependent, they would have to be adapted to the crop management practices and phenology of other regions. However, even regions with similar climates have a high variation in crop productivity (Godfray et al., Citation2010). An elegant way of dealing with regional heterogeneity has been implemented by Homer et al., who used the concept of mapping zone delineation in combination with optical remote sensing and ancillary geodata to provide land cover for the whole of the US.
As in Homer et al. (Citation2004), the integrating of external geodata is mainly country-specific; the DLM used in this study is, in this form, only available for Germany. However, the PB data is part of LPIS, which is available in a similar form for the whole EU. The most prominent worldwide dataset is the OpenStreetMap (OSM), which is freely available and could also be used to identify the non-agricultural areas. This use is demonstrated by Immitzer et al. (Citation2016), who combine OSM data with CORINE land cover data (Büttner et al., Citation2004). However, the spatial accuracy and quality of OSM data depends on the volunteers collecting the data and is worse than that of the datasets used in the present study (Zhang & Malczewski, Citation2017).
Conclusions
This study demonstrates how multitemporal and dual-polarimetric TerraSAR-X images can be incorporated into the MDA to produce annually updated crop type enriched LULC maps for a subset of the Rur area in Germany. Identification of optimal acquisition time frames to classify the crops revealed similarities to optical remote sensing but enabled future acquisition plans to be improved since radar remote sensing is independent of clouds and thus more reliable. High-classification accuracies were achieved for the classes rapeseed, potatoes, and winter cereals, with no major difference between the two multitemporal approaches used in this study. For the fusion with the external geodata, the high geometric accuracy of TerraSAR-X proved helpful. No manual orthorectification had to be performed for the fusion with the highly accurate ATKIS and PB data.
One particularity of the study was a limited number of reference fields. Repeating all classifications 10 times with different training and validation combinations revealed the variances of the accuracy of the mapped classes. For the class potato, a high variance was found, which suggests that more potato reference fields will be needed in future studies. For the class rapeseed, eight fields were enough to provide high accuracy and almost no variance.
Future research should be done on how to incorporate more SAR data from different viewing angles, polarizations, and other missions into the MDA. One such mission is Sentinel-1 with a higher temporal resolution and wider coverage (Bargiel, Citation2017; Lussem et al., Citation2016).
Acknowledgments
TerraSAR-X data were acquired under the proposal no. LAN2156: Potential of TerraSAR-X for agriculture monitoring. The authors gratefully acknowledge financial support by the CRC/TR32 ‘Patterns in Soil-Vegetation-Atmosphere Systems: Monitoring, Modelling, and Data Assimilation’ funded by the German Research Foundation (DFG).
Disclosure statement
No potential conflict of interest was reported by the authors.
References
- AdV. (2006). Documentation on the Modelling of Geoinformation of Official Surveying and Mapping (GeoInfoDok) - Chapter 5 - Technical applications of the basic schema - Section 5.4 - Explanations on ATKIS®, Version 5.1, Status 31 July 2006. Retrieved from http://www.adv-online.de/AAA-Modell/Dokumente-der-GeoInfoDok/binarywriterservlet?imgUid=8df46f15-1ff9-f216-afd6-ff3072e13d63&uBasVariant=11111111-1111-1111-1111-111111111111&isDownload=true
- Atzberger, C. (2013). Advances in remote sensing of agriculture: Context description, existing operational monitoring systems and major information needs. Remote Sensing, 5(2), 949–981. doi:10.3390/rs5020949
- Bareth, G. (2008). Multi-Data Approach (MDA) for enhanced land use and land cover mapping. ISPRS Archives Vol. XXXVII-B8 Proceedings of the XXI ISPRS Congress, 3-11 July, 2008, Beijing, China, 8, 3–11.
- Bargiel, D. (2017). A new method for crop classification combining time series of radar images and crop phenology information. Remote Sensing of Environment, 198, 369–383. doi:10.1016/j.rse.2017.06.022
- Bauer, M.E., Hixson, M.M., & Davis, B.J. (1978). Area estimation of crops by digital analysis of Landsat data. Photogrammetric Engineering and Remote Sensing, 44, 1033–1043. Retrieved from http://www.asprs.org/publications/pers/scans/1978journal/aug/1978_aug_1033-1043.pdf
- Bhang, K.J., Schwartz, F.W., & Braun, A. (2007). Verification of the vertical error in C-band SRTM DEM using ICESat and Landsat-7, Otter Tail County, MN. IEEE Transactions on Geoscience and Remote Sensing, 45(1), 36–44. doi:10.1109/TGRS.2006.885401
- Blaes, X., Vanhalle, L., & Defourny, P. (2005). Efficiency of crop identification based on optical and SAR image time series. Remote Sensing of Environment, 96(3–4), 352–365. doi:10.1016/j.rse.2005.03.010
- Breit, H., Fritz, T., Balss, U., Lachaise, M., Niedermeier, A., & Vonavka, M. (2010). TerraSAR-X SAR processing and products. IEEE Transactions on Geoscience and Remote Sensing, 48(2), 727–740. doi:10.1109/TGRS.2009.2035497
- Brisco, B., & Brown, R.J. (1995). Multidate SAR/TM synergism for crop classification in western Canada. Photogrammetric Engineering and Remote Sensing, 61(8), 1009–1014.
- Buechel, S.W., Philipson, W.R., & Philpot, W.D. (1989). The effects of a complex environment on crop separability with landsat TM. Remote Sensing of Environment, 27(3), 261–271. doi:10.1016/0034-4257(89)90087-4
- Bush, T.F., & Ulaby, F.T. (1978). An evaluation of radar as a crop classifier. Remote Sensing of Environment, 7(1), 15–36. doi:10.1016/0034-4257(78)90004-4
- Büttner, G., Feranec, J., Jaffrain, G., Mari, L., Maucha, G., & Soukup, T. (2004). The CORINE land cover 2000 project. EARSeL eProceedings, 3(3), 331–346.
- Cloude, S.R., Goodenough, D.G., & Chen, H. (2012). Compact decomposition theory. IEEE Geoscience and Remote Sensing Letters, 9(1), 28–32. doi:10.1109/LGRS.2011.2158983
- Cloude, S.R., & Pottier, E. (1997). An entropy based classification scheme for land applications of polarimetric SAR. IEEE Transactions on Geoscience and Remote Sensing, 35(1), 68–78. doi:10.1109/36.551935
- Congalton, R.G. (1991). A review of assessing the accuracy of classifications of remotely sensed data. Remote Sensing of Environment, 37(1), 35–46. doi:10.1016/0034-4257(91)90048-B
- Curlander, J.C., & McDonough, R.N. (1991). Synthetic aperture radar : Systems and signal processing. New York, NY: John Wiley & Sons, Inc.
- Fieuzal, R., Baup, F., & Marais-Sicre, C. (2013). Monitoring wheat and rapeseed by using synchronous optical and radar satellite data—from temporal signatures to crop parameters estimation. Advances in Remote Sensing, 2(2), 162–180. doi:10.4236/ars.2013.22020
- Foerster, S., Kaden, K., Foerster, M., & Itzerott, S. (2012). Crop type mapping using spectral-temporal profiles and phenological information. Computers and Electronics in Agriculture, 89, 30–40. doi:10.1016/j.compag.2012.07.015
- Foody, G.M., McCulloch, M.B., & Yates, W.B. (1994). Crop classification from c-band polarimetric radar data. International Journal of Remote Sensing, 15(14), 2871–2885. doi:10.1080/01431169408954289
- Forkuor, G., Conrad, C., Thiel, M., Ullmann, T., & Zoungrana, E. (2014). Integration of optical and synthetic aperture radar imagery for improving crop mapping in Northwestern Benin, West Africa. Remote Sensing, 6(7), 6472–6499. doi:10.3390/rs6076472
- Godfray, H.C.J., Beddington, J.R., Crute, I.R., Haddad, L., Lawrence, D., Muir, J.F., … Toulmin, C. (2010). Food security: The challenge of feeding 9 billion people. Science, 327(5967), 812–818. doi:10.1126/science.1185383
- Homer, C., Huang, C., Yang, L., Wylie, B., & Coan, M. (2004). Development of a 2001 national land-cover database for the United States. Photogrammetric Engineering & Remote Sensing, 70(7), 829–840. doi:10.14358/PERS.70.7.829
- Hoogeboom, P. (1983). Classification of agricultural crops in radar images. IEEE Transactions on Geoscience and Remote Sensing, GE-21(3), 329–336. doi:10.1109/TGRS.1983.350562
- Horning, N. (2016). RandomForestClassification. Retrieved September 25, 2017, from https://bitbucket.org/rsbiodiv/randomforestclassification/commits/534bc2f
- Hütt, C., Koppe, W., Miao, Y., & Bareth, G. (2016). Best accuracy land use/land cover (LULC) classification to derive crop types using multitemporal, multisensor, and multi-polarization SAR satellite images. Remote Sensing, 8(8), 684. doi:10.3390/rs8080684
- Hütt, C., Tilly, N., Schiedung, H., & Bareth, G. (2016). Potential of multitemporal tandem-x derived crop surface models for maize growth monitoring. International Archives of the Photogrammetry, Remote Sensing and Spatial Information Sciences - ISPRS Archives, 41, 803–808. doi:10.5194/isprsarchives-XLI-B7-803-2016
- Immitzer, M., Vuolo, F., & Atzberger, C. (2016). First experience with Sentinel-2 data for crop and tree species classifications in central Europe. Remote Sensing, 8(3), 166. doi:10.3390/rs8030166
- IT.NRW. (2012). Landwirtschaftszählung in Nordrhein-Westfalen 2010 - Gemeinde- und Kreisstatistik der landwirtschaftlichen Betriebe Betriebsgrößen, Bodennutzung, Viehhaltung, sozialökonomische Betriebstypen, betriebswirtschaftliche Ausrichtung, Arbeitskräfte. Retrieved October 12, 2016, from https://www.destatis.de/GPStatistik/servlets/MCRFileNodeServlet/NWHeft_derivate_00006831/C913201051_A.pdf;jsessionid=7C87E3B1E8416420C7DA15034946F959
- Jarvis, A., Reuter, H.I., Nelson, A., & Guevara, E. (2016). Hole-filled SRTM for the globe Version 4, available from the CGIAR-CSI SRTM 90m Database. CGIAR CSI Consortium for Spatial Information, (pp. 1–9). Retrieved from https://doi.org/http://srtm.csi.cgiar.org
- Koppe, W., Gnyp, M.L., Hütt, C., Yao, Y., Miao, Y., Chen, X., & Bareth, G. (2013). Rice monitoring with multi-temporal and dual-polarimetric TerraSAR-X data. International Journal of Applied Earth Observation and Geoinformation, 21, 568–576. doi:10.1016/j.jag.2012.07.016
- Landwirtschaftskammer, N.R.W. (2011). LZ Rheinland - Ratgeber Förderung 2011. Rheinischer Landwirtschafts-Verlag GmbH, Bonn.
- Landwirtschaftskammer NRW. (2016). Bestellung von digitalen Feldblockgeometrien. Retrieved November 1, 2016, from http://www.lwk.nrw.de/foerderung/feldblock/angebot/bestellen.htm
- Liaw, A., & Wiener, M. (2002). Classification and Regression by randomForest. R News, 2(December), 18–22. doi:10.1177/154405910408300516
- Lopez-Sanchez, J.M., Cloude, S.R., & Ballester-Berman, J.D. (2012). Rice phenology monitoring by means of SAR polarimetry at X-band. IEEE Transactions on Geoscience and Remote Sensing, 50(7), 2695–2709. doi:10.1109/TGRS.2011.2176740
- Lu, D., & Weng, Q. (2007). A survey of image classification methods and techniques for improving classification performance. International Journal of Remote Sensing, 28(5), 823–870. doi:10.1080/01431160600746456
- Lussem, U., Hütt, C., & Waldhoff, G. (2016). Combined analysis of Sentinel-1 and RapidEye data for improved crop type classification: An early season approach for rapeseed and cereals. International Archives of the Photogrammetry, Remote Sensing and Spatial Information Sciences - ISPRS Archives, 41, 959–963. doi:10.5194/isprsarchives-XLI-B8-959-2016
- Mathur, A., & Foody, G.M. (2008). Crop classification by support vector machine with intelligently selected training data for an operational application. International Journal of Remote Sensing, 29(8), 2227–2240. doi:10.1080/01431160701395203
- McNairn, H., Champagne, C., Shang, J., Holmstrom, D., & Reichert, G. (2009). Integration of optical and Synthetic Aperture Radar (SAR) imagery for delivering operational annual crop inventories. ISPRS Journal of Photogrammetry and Remote Sensing, 64(5), 434–449. doi:10.1016/j.isprsjprs.2008.07.006
- McNairn, H., Kross, A., Lapen, D., Caves, R., & Shang, J. (2014). Early season monitoring of corn and soybeans with TerraSAR-X and RADARSAT-2. International Journal of Applied Earth Observation and Geoinformation, 28, 252–259. doi:10.1016/j.jag.2013.12.015
- McNairn, H., & Shang, J. (2016). A review of multitemporal synthetic aperture radar (SAR) for crop monitoring. Remote Sensing and Digital Image Processing, 20, 317–340. doi:10.1007/978-3-319-47037-5_15
- Nonaka, T., Ishizuka, Y., Yamane, N., Shibayama, T., Takagishi, S., & Sasagawa, T. (2008). Evaluation of the Geometric Accuracy of Terrasar-X. The International Archives of the Photogrammetry, Remote Sensing and Spatial Information Sciences, XXXVII(Part B7), 135–140.
- Oetter, D.R., Cohen, W.B., Berterretche, M., Maiersperger, T.K., & Kennedy, R.E. (2001). Land cover mapping in an agricultural setting using multiseasonal Thematic Mapper data. Remote Sensing of Environment, 76(2), 139–155. doi:10.1016/S0034-4257(00)00202-9
- Ok, A.O., Akar, O., & Gungor, O. (2012). Evaluation of random forest method for agricultural crop classification. European Journal of Remote Sensing, 45(1), 421–432. doi:10.5721/EuJRS20124535
- Reichenau, T.G., Korres, W., Montzka, C., Fiener, P., Wilken, F., Stadler, A., … Schneider, K. (2016). Spatial heterogeneity of leaf area index (LAI) and its temporal course on arable land: combining field measurements, remote sensing and simulation in a comprehensive data analysis approach (CDAA). Plos One, 11(7), e0158451. doi:10.1371/journal.pone.0158451
- Siachalou, S., Mallinis, G., & Tsakiri-Strati, M. (2015). A hidden markov models approach for crop classification: Linking crop phenology to time series of multi-sensor remote sensing data. Remote Sensing, 7(4), 3633–3650. doi:10.3390/rs70403633
- Simmer, C., Thiele-Eich, I., Masbou, M., Amelung, W., Bogena, H., Crewell, S., … Zerenner, T. (2015). Monitoring and modeling the terrestrial system from pores to catchments: The transregional collaborative research center on patterns in the soil–vegetation–atmosphere system. Bulletin of the American Meteorological Society, 96(10), 1765–1787. doi:10.1175/BAMS-D-13-00134.1
- Simonett, D.S. (1967). The potential of radar as a remote sensor in agriculture: 1. A study with K-band imagery in Western Kansas. University of Kansas, Center for Research Incorporated, Engineering Science Division, Lawrence, KS.
- Skriver, H. (2012). Crop classification by multitemporal C- and L-band single- and dual-polarization and fully polarimetric SAR. IEEE Transactions on Geoscience and Remote Sensing, 50(6), 2138–2149. doi:10.1109/TGRS.2011.2172994
- Skriver, H., Svendsen, M.T., & Thomsen, A.G. (1999). Multitemporal C- and L-band polarimetric signatures of crops. IEEE Transactions on Geoscience and Remote Sensing, 37(5 II), 2413–2429. doi:10.1109/36.789639
- Smith, G.M., & Fuller, R.M. (2001). An integrated approach to land cover classification: An example in the Island of Jersey. International Journal of Remote Sensing, 22(16), 3123–3142.
- Sonobe, R., Tani, H., Wang, X., Kobayashi, N., & Shimamura, H. (2014). Random forest classification of crop type using multi-temporal TerraSAR-X dual-polarimetric data. Remote Sensing Letters, 5(2), 157–164. doi:10.1080/2150704X.2014.889863
- Tatsumi, K., Yamashiki, Y., Canales Torres, M.A., & Taipe, C.L.R. (2015). Crop classification of upland fields using random forest of time-series Landsat 7 ETM+ data. Computers and Electronics in Agriculture, 115, 171–179. doi:10.1016/j.compag.2015.05.001
- Van Niel, T.G., & McVicar, T.R. (2004). Determining temporal windows for crop discrimination with remote sensing: A case study in south-eastern Australia. Computers and Electronics in Agriculture, 45(1–3), 91–108. doi:10.1016/j.compag.2004.06.003
- Vinciková, H., Hais, M., Brom, J., Procházka, J., & Pecharová, E. (2010). Landscape studies use of remote sensing methods in studying agricultural landscapes – A review. Journal of Landscape Studies, 3(April), 53–63.
- Waldhoff, G. (2014). Multidaten-Ansatz zur fernerkundungs- und GIS-basierten Erzeugung multitemporaler, disaggregierter Landnutzungsdaten. Methodenentwicklung und Fruchtfolgenableitung am Beispiel des Rureinzugsgebiets. Universität zu Köln. Retrieved from http://kups.ub.uni-koeln.de/5861/
- Waldhoff, G., & Bareth, G. (2009). GIS- and RS-based land use and land cover analysis: Case study Rur-Watershed, Germany. Proc. SPIE 7146, SPIE (2009), 714626-714628. doi:10.1117/12.813171
- Waldhoff, G., Curdt, C., Hoffmeister, D., & Bareth, G. (2012). Analysis of multitemporal and multisensor remote sensing data for crop rotation mapping. ISPRS Annals of Photogrammetry, Remote Sensing and Spatial Information Sciences, I-7, 177–182. doi:10.5194/isprsannals-I-7-177-2012
- Waldhoff, G., Lussem, U., & Bareth, G. (2017). Multi-data approach for remote sensing-based regional crop rotation mapping: A case study for the Rur catchment, Germany. International Journal of Applied Earth Observation and Geoinformation, 61, 55–69. doi:10.1016/j.jag.2017.04.009
- Whitcraft, A.K., Vermote, E.F., Becker-Reshef, I., & Justice, C.O. (2015). Cloud cover throughout the agricultural growing season: Impacts on passive optical earth observations. Remote Sensing of Environment, 156, 438–447. doi:10.1016/j.rse.2014.10.009
- Zhang, H., & Malczewski, J. (2017). Quality evaluation of volunteered geographic information: the case of OpenStreetMap. In Volunteered geographic information and the future of geospatial data (pp. 19–46). IGI Global. doi:10.4018/978-1-5225-2446-5.ch002
- Zhao, Q., Lenz-Wiedemann, V., Yuan, F., Jiang, R., Miao, Y., Zhang, F., & Bareth, G. (2015). Investigating within-field variability of rice from high resolution satellite imagery in Qixing Farm County, Northeast China. ISPRS International Journal of Geo-Information, 4(1), 236–261. doi:10.3390/ijgi4010236