
ABSTRACT
Aeolian processes in drylands often transcend into sand encroachment, a common form of land degradation. Highly reflective desert features, hence sandy areas, often cause spectral confusion, and mapping through remote sensing techniques can be challenging. This work aims at designing an efficient classification method that minimises spectral confusion of desert features, hence two types of sandy areas. Moreover, we employ land cover (LC) change detection over the last 30 years. The extraction and spatiotemporal variations of LC and sand encroachment areas in the Dahar-Jeffara Medenine site (southeastern Tunisia) are assessed by employing Landsat imagery (1984 and 2014), a 30 m digital elevation model of Shuttle Radar Topography Mission (SRTMGL 1 arc second), field data and X-ray diffraction analyses of sand samples. Five new spectral indices were designed and employed in a Decision Tree (DT) classifier for the extraction of 11 LC classes, including two different types of sandy areas. The DT map yielded an overall accuracy of around 89%. Change detection results showed substantial change in several landscape components and an increase of sand units by 29% within the Jeffara-Medenine plain over the last three decades. Geomorphological observations and multi-temporal, spectral and mineral analyses indicate a main, possible in-situ source area of sand.
Introduction
Interaction of wind and water over time is arguably the key influence upon the contemporary geomorphology and longer-term landscape development of arid regions of the world (Nash, Citation2000). Aeolian processes in arid and semi-arid areas need constant monitoring, as they often transcend into sandy desertification or sand encroachment. It is a common form of land degradation resulting from a combination of climate change and intensive or unsustainable human activities in ecologically fragile environments (Mihi, Tarai, & Chenchouni, Citation2017; Ren, Dong, Hu, Zhang, & Li, Citation2016), being strongly related to regional wind regime (Ge et al., Citation2016). Therefore, it is a very dynamic phenomenon. Its evolution depends not only on the biophysical conditions of such arid environments but also on the management and exploitation methods of natural resources. Indicators of sand encroachment are represented by depositional landforms, such as sand dunes and erosional landforms due to deflation, with the production of wind depressions or yarding. Sandy desertification determines degradation of land resources; slow recovery of vegetation; and decrease of ecosystem productivity, services and livelihood (Ahmady-Birgani, McQueen, Moeinaddini, & Naseri, Citation2017; Duan, Wang, Xue, Liu, & Guo, Citation2014).
Sand encroachment has become a critical issue in the last decades, especially in susceptible drylands, and is one of the most serious environmental problems in central and south Tunisia. In the Jeffara-Medenine-Dahar study area (southeastern Tunisia), the main desertification issues are related to in-situ sand production, deflation and accumulation. In these environments, which are a priori fragile, it was proven that any change in the ecosystem could have immediate and strong impact. In this case, soils are often sandy or developed on fine-grained deposits, and natural vegetation, even if poorly developed, plays and important role in sand control and stabilization. In the last decades, modifications of socioeconomic policies in the past decades led to rapid and extensive changes in land use and management (Talbi, Citation1997), including:
an intensive use of natural resources
accelerated expansion of rain fed and irrigated agriculture (olive trees and annual crops, respectively)
significant change of agrarian system
change of vegetation cover and/or land use (from grazing land to arable land, intensive ploughing)
development of multi-sector activities for income support (urbanisation, services, migration, etc.)
These variations represent the anthropogenic direct and indirect contribution to intensification of land degradation processes, particularly sand encroachment (M Ouessar & Zerrim, Citation2014; Schiettecatte et al., Citation2005). In the Jeffara-Medenine-Dahar study area, in particular, previous research showed that the anthropic component contributes to sand encroachment intensification through: (1) the depletion of natural vegetation and change in land use, that is, transforming vast natural areas into arable land, (2) reworking of extended areas, and (3) ploughing method (Msadki, Bouzaida, Taamallah, & Ouessar, Citation2014; Talbi, Citation1997).
Remote sensing and GIS are powerful tools for monitoring sand encroachment dynamics, which, integrated with ground observations, provide valid mapping techniques (Brownett & Mills, Citation2017; Ge, Li, Luloff, Dong, & Xiao, Citation2015). Several authors have employed these techniques in similar studies in Tunisia, focusing on geomorphological, socio-economic or ecological aspects (Essifi, Ouessar, & Rabia, Citation2009; Hanafi & Jauffret, Citation2008; Lorenz, Gasmi, Radebaugh, Barnes, & Ori, Citation2013; Ouerchefani, Dhaou, Delaitre, Callot, & Abdeljaoued, Citation2013). However, studies about sand encroachment in the southeastern Tunisia are limited to either local experiences or regional-scale studies, and deeper remarks on driving forces and trends are still required.
In this work, we aim at (1) evaluating and designing an optimal automated mapping technique specific to local context (highly reflective desert features), (2) assessing and defining appropriate spectral indices for supporting decision tree (DT) classifier, and (3) generating land cover (LC) map of 11 classes, including two types of sandy areas. Other specific objectives are also to (1) qualitatively and quantitatively estimate changes of LC and sandy areas, (2) argue source areas of sand in the Jeffara-Medenine-Dahar study area, by analysing and discussing the origin of sand (allochthon vs autochthon) and its increase in the cultivated areas, and (3) assess the accuracy of results and possible limits of the proposed approach. For this purpose, we employed ground truth data, remote sensing and X-ray diffraction analysis data (XRD).
Starting from a multi-temporal analysis of land cover over the last 30 years (1984–2014), this research highlights the increase of sandy areas, focusing on spectral discrimination of different types of sand (desert vs. inner-plain). Five new spectral indices and a DT classifier have been studied to optimise and “force” extraction of spectral information from bands. Thus, two distinct spectral signatures of sand were recognised for the first time in this study. Change detection analysis drove us to quantitatively and qualitatively estimate change rates and, consequently, discuss possible driving factors (Allbed & Kumar, Citation2013; Allbed, Kumar, & Aldakheel, Citation2014; Allbed, Kumar, & Sinha, Citation2014; Fichera, Citation2012; Vacca et al., Citation2014; Vogiatzakis & Melis, Citation2015).
The employed DT classification method is flexible, simple, computationally efficient, allowing the proof and management of rules (Elnaggar & Noller, Citation2010; Friedl & Brodley, Citation1997; Ghose, Pradhan, & Ghose, Citation2010; Melis et al., Citation2013).
To characterise different source areas, several sand samples were analysed from the mineralogical point of view using XRD (Afrasinei, Citation2016; Afrasinei et al., Citation2015; Sadiq & Howari, Citation2009). These data, supported by a database of field collected information, provided valuable support for the identification of possible source areas (Coudé-Gaussen, Citation1991; Coudé-Gaussen & Rognon, Citation2016).
Research background
In the Jeffara-Medenine plain, sand encroachment and gypsum crusts represent the particularities of most surfaces, while the coastline is characterised by the presence of sabkha. In these environments, wind plays an important role in the transportation of both sand and gypsum. This can eventually lead to further land degradation, given the climatic and anthropic factors that intensify these processes.
Socio-economic and political factors heavily condition the dynamics and degree of land degradation phenomena in Tunisia, especially in its southeastern part. This relates to the constantly changing political context since the end of the 19th century onward (Talbi, Citation1997). This context refers to the transition from the nomadic or pre-colonial phase to the colonial phase after the end of the 19th century and subsequent changes to present. The pre-colonial phase was based on nomadic pastoralism, agro-pastoral activities and animal husbandry, lasting until the end of the 19th century, when the semi-nomadic/colonial phase started. This period was based on sedentarisation and urbanisation of settlements and population, new agricultural production systems, rural exodus, privatisation of land and introduction of monetary exchange. This meant the destruction of nomadic social structures and production systems, such as abandonment of lands and pastoral activities in the favour of modern urbanised areas (including services) and sedentarisation, among others. This phase was followed by a period of wrongly implemented “collectivist/colonial” policy after the independence of Tunisia in 1956 (Talbi, Citation1997). Subsequently, the abandonment of the collectivism in 1969 triggered two main activities that eventually were the most important causes of desertification: a) the return to livestock breeding and implicitly over-pasturing and b) massive land clearing using heavy mechanical means. Therefore, a massive change in land use took place, characterised by a generalised mechanisation, especially for land labour/plough, translated into over-exploitation of resources and mismanagement of land. This series of transitions, changes of land management and use of resources finally compromised the ecological equilibrium of the country. The settling process promoted by the colonial authorities and subsequently by the following independent ones resulted in sparse but concentrated rural settlements, entailing a constant human presence, thus a considerable continuous pressure on the environment.
Therefore, past decades rapid and intense changes in agricultural practices and in land use had direct consequences on land degradation and sediment production within the whole Jeffara plain, which is likely to be easily engaged in wind transportation and deposition in close adjacent areas within the plain (Marini, Melis, Pitzalis, Talbi, & Gasmi, Citation2008; Talbi, Citation1997).
Study area
The study site is represented by the Dahar-Jeffara of Medenine area, in the northern part of the governorate of Medenine, southeastern Tunisia (approx. 4000 km2, centre area UTM WGS84 zone 32 N, coordinates 613,694.87 E, 3,681,555.11 N). It stretches from the border of the Grand Oriental Erg up to the Mediterranean Sea, crossing over the Dahar plateau and the northern plains of Jeffara (). The area is located in a transition climatic zone, extending from (1) the desert/pre-desert Saharan climate located to the south-west of the Dahar plateau, to the (2) arid and semi-arid zone of the Jeffara of Medenine plain, located east of the Dahar escarpment, to a (3) Mediterranean relatively wet and moderate climate in the coastal part. The mean annual maximum temperature is over 36°C. The cumulative annual precipitation is generally below 190 mm (Trabelsi, Abid, Zouari, & Yahyaoui, Citation2012).
Figure 1. a) Location of Jeffara-Medenine-Dahar study area and the main geomorphological units: A – Jeffara-Medenine plain; B – Jeffara-Medenine escarpment glacis; C – Dahar plateau; D – Grand Oriental Erg/Dahar transition zone; E – Grand Oriental Erg. b) Collected field data, consisting of two entities: linear (GPS track log, orange colour) and GPS point data with description (black triangles). The study area limit is represented in green colour (b). Map projection: UTM – WGS 1984, Zone 32N, EPSG 32,632 (metric coordinates).
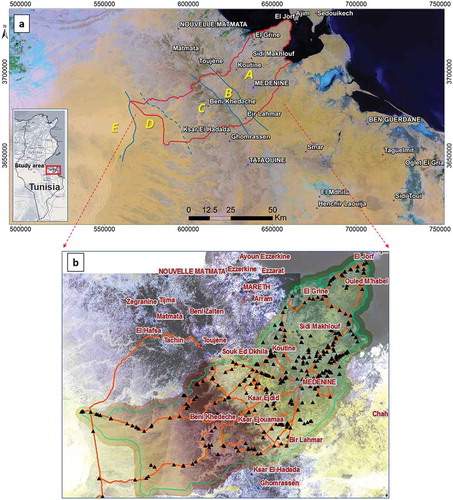
Analyses showed that the active winds (>3m/s, capable of displacing sand grains, whereas non-active winds are below this speed) blowing from N, NE, SE are more frequent than those from S, W, and SW (M Ouessar, Citation2007). Active winds are important and represent 44% of all winds in the Sidi Maklouf area (north of the city of Médenine) and 40.7% in Médenine (Khatelli & Gabriels, Citation2000). Spring is considered the windiest season, followed by winter and, finally, autumn. During summer time, hot winds blowing from Sahara (sirocco), locally known as “chili”, are dominating.
Geological and geomorphological setting
From the geological point of view, the study site is characterised by the presence of sedimentary sequences ranging from Palaeozoic up to present. According to (Marini et al., Citation2008), the geomorphology of Dahar-Medenine area can be divided into: a) morpho-structural units and b) fluvial and slope morphological units, subsequently organised in forms and processes. The macroforms correspondent to the morphological, litho-structural and slope units, as identified in the area, are: 1) Fluvial processes and forms; 2) Structural and slope forms; and 3) Aeolian forms, processes and deposits.
The following geological and morpho-tectonic domains can be distinguished ()):
The Jeffara-Medenine Plain domain represents a low-flat-tabular topography covered by Tertiary and Quaternary deposits. It reflects the evolution of the parallel retreat of slopes with intense phenomena of sheet and gully erosion and, locally, a slope replacement. Recent Quaternary is represented by the deposits of silts and the “loess of Matmata”, which are very fine detrital particles. These deposits could represent the main source of fine wind-blown material that can accumulate in deep valleys and wadi alluviums as semi-consolidated deposits (Arras et al., Citation2014, Citation2016) or over vast areas in the Jeffara-Medenine plain as non-consolidated deposits. Since these deposits are often found in arable lands, they are constantly reworked (mouldboard ploughing), thus contributing to a further in situ sand production.
Morphological fluvial and slope units are related to runoff processes operated by the ephemeral rivers (wadi) and active in the Plain of Jeffara-Medenine. The Jeffara plain – Medenine sector represents a vast gentle dipping surface towards east, constituted by the superposition of several orders of accumulation glacis, whose genesis and evolution are related to the progressive retreat of the Dahar monoclinal ridge.
(B)The plain sector closest to the eastern Dahar ridge is represented by a vast system of cones of dejection, mostly carved and inactive, whose coalescence determines, on the whole, the formation of gently sloping surfaces, extensively cut by a hydrological sub-parallel network. In these surfaces, the runoff dynamics such as rill and gully erosion are intense, but slightly significant aeolian forms and processes appear. The barrier of the Dahar ridge limits the winds coming from West, thus hindering these aeolian forms. The result is a minor aridity, allowing a limited development of soil and vegetation and a modest but important agricultural activity for the local people. The glacis area is mainly covered by gypsum and calcareous crust; aeolian dynamics and lack of soil limit agricultural use and vegetation growth, thus restricting grazing, the main local economical resource (Marini et al., Citation2008).
(C)The Dahar Plateau and the Jeffara – Medenine Plain (). The Dahar Plateau consists of a Lower Triassic – Upper Cretaceous marine-sedimentary succession (overall thickness of about 700 m), characterised by the alternation of sandstone, clay, marl and limestone.
(D)Grand Oriental Erg/Dahar transition zone
(E)Grand Oriental Erg
In the central and eastern part of the plain, a wide range of detrital-sedimentary cover can be recognised. These relate to ancient continental erosive phases of late Cenozoic and Pliocene times, characterised by the presence of limestone and gypsum crusts, referring to previous arid and desert climate phases.
Aeolian morphologies are evolving on the current surface, corresponding to sand/silt/dust being trapped by bushes to form phreatophyte mounds and nebkas, or to sand shadows, sand drifts and lee dunes fed by materials coming from large surfaces exposed to the wind. An important aspect is given by the influence of agricultural practices on the soil and the formation of new sediments that can be subsequently carried away by winds. The reworking of land, ploughing methods and cultivation of olive trees create other transportable sediments and even bring to surface crumbled material from gypsum and carbonate sub-surficial crusts (Afrasinei, Citation2016).
Aeolian deposits represent an invaluable indicator for possible source areas, as their tails point in the predominant wind direction. These surfaces are adjacent to the deposition areas inside the Jeffara-Medenine plain. Since predominant active winds blow from N and NE, these determine an overall sediment transport towards the Grand Oriental Erg. This fact is in accordance with various works dealing with this topic at large/small spatial and time scales (Drake, Citation1997; Khatelli & Gabriels, Citation1998, Citation2000; Swezey, Citation2001).
Materials and data
Large ancillary datasets, georeferenced field data, XRD and remote sensing data were employed in this study. The ancillary data included geological, geomorphological and topographical maps, agricultural calendars/statistics, and pedological reports mainly provided by local entities that were collaborating on the WADIS-MAR European project (www.wadismar.eu).
The field survey was carried out from April to July 2014, covering an area of about 4000 km2. Approximately 400 points were surveyed, and 10 sand samples for XRD analysis were collected from both the inner-plain area and the western Dahar area (including the Grand Oriental Erg limitrophe area). Mobile data collection was done using ArcPad (ESRI) installed on Magellan MobileMapper 6 GPS receiver instrument. Physiographical, geological, geomorphological, soil, vegetation and land use observations were registered for each surveyed point. The collected sand samples were prepared according to standard protocol and analysed using the PANalytical X’Pert Pro X-ray diffractometer for powders (X-ray diffraction Laboratory of the Chemical and Geological Department, University of Cagliari).
The Landsat scenes of June 1984 and June 2014 with less than 10% cloud coverage were downloaded from online USGS platforms (). A summary of sensors’ characteristics is provided in . The scenes of June 2014 were employed in generating the “final state” map, being timely consistent with the ground truth campaign and the most adequate in terms of quality among recent years’ images of June. The Landsat scenes of June 1984 (used for the “initial state” map) were the oldest available ones with an acceptable degree of cloud coverage and quality. Two adjacent scenes were necessary for the full coverage of the study area, and thus the closest dates as possible were chosen for each year.
Table 1. Landsat scenes employed in the analysis.
Table 2. Landsat 5 TM and Landsat 8 OLI and TIRS characteristics.
The latest 30 m-resolution Shuttle Radar Topography Mission digital elevation model SRTM Version 3.0 Global 1 arc second (SRTMGL1, released starting from September 2014) was also employed. Two tiles of the coordinates N33, E010 and N33, E009 were obtained to cover the entire study area. The SRTMGL1 was chosen as it is characterised by a 16 m accuracy (at 90% confidence), and it presents several advantages compared to optical sources-derived DEMs (Arras et al., Citation2017).
Methodology
In the following paragraphs, the methodological workflow of the study is briefly presented ().
Figure 2. Methodological flowchart.
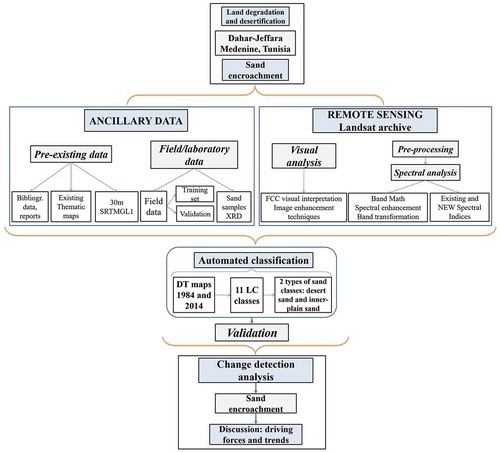
The 1984 and 2014 Landsat scenes were pre-processed (radiometric calibration, atmospheric correction, co-registration check), mosaicked and subsequently spectrally analysed and processed.
The following aspects were examined in the spectral analysis and processing steps: a) spectral behaviour of land features, b) selection of existing spectral indices and design of new ones and c) spatial distribution of sand accumulations related to the study area morphology. Ancillary data was extensively used for the visual analysis of the images and land features of interest. A part of the field data collected in 2014 (213 points out of 410 total) were employed as training data (hereinafter referred to as training set) for spectral analysis and image classification of the time-correspondent Landsat image of June 2014, while the remaining part was used for the validation of results of the same image (hereinafter referred to as validation set). Once trained and constructed, the DT was applied to the 1984 image, and correspondent thresholds were calculated following the same math rules as for the 2014 image.
Successively, spectral indices were selected and tested from literature, and new ones were designed when existing ones failed to extract the expected land cover classes. Finally, the customised DT classifier and post-classification processes (validation through confusion matrix and change detection) were carried out.
Pre-processing
The post-classification comparison is the most widely used and simplest quantitative technique for change detection. The main advantage of post-classification comparison method (unlike image-to-image or pixel-by-pixel change detection (Singh, Citation1989)) lies in the fact that multitemporal images are classified independently, thereby minimising the problem of radiometric calibration. (Bovolo & Bruzzone, Citation2015). The land cover variation is obtained in an explicit way for each change. Moreover, some authors (Aleksandrowicz, Turlej, Lewiński, & Bochenek, Citation2014; Jensen, Citation2005) state that it does not even require radiometric normalisation or atmospheric correction. Nonetheless, accuracy depends on pre- and post-classifications processing, and every error in the individual maps will be present in the final change detection product.
For both years, 1984 and 2014, level 1 precision terrain corrected products were obtained as courtesy of the United States Geological Survey (USGS) and downloaded from USGS Earth Explorer online platform. In 2016, the USGS started reorganising the Landsat archive into a formal tiered data Collection structure. This data Collection structure ensures that Landsat Level-1 products provide a consistent archive of known data quality to support time-series analyses and data “stacking” while controlling continuous improvement of the archive and access to all data as they are acquired (https://landsat.usgs.gov/landsat-collections). The calibration of the Landsat sensors is supported by preflight, post launch-onboard, and ground reference data, undertaken by USGS (https://landsat.usgs.gov/calibration). The absolute radiometric calibration of the Landsat 8 Operational Land Imager (OLI) was updated in February 2017 to reflect changes seen in the instrument’s response to the on-board calibrators indicating a change in the instrument (Micijevic, Haque, & Mishra, Citation2016).
Even Landsat 4–5 TM scenes are processed through the Level 1 Product Generation System (LPGS) (https://lta.cr.usgs.gov/TM). The downloaded scenes, including the TM ones, belong to TIERS 1 category that meet formal geometric and radiometric quality criteria. These contain the highest quality Level-1 Precision Terrain (L1TP) data considered suitable for time-series analysis. It consists of corrected data that have well-characterised radiometry and are inter-calibrated across the different Landsat instruments. Calibration and validation are important aspects of any remote sensing system. The georegistration of Tier 1 scenes is consistent and within prescribed image-to-image tolerances of ≦ 12-meter radial root mean square error (RMSE).
The images used in this study were subset to the study area extent, radiometrically normalised to obtain top of atmosphere reflectance (Chander, Markham, & Helder, Citation2009), and, subsequently, dark object subtraction was applied for atmospheric correction, thus obtaining surface reflectance. Landsat 8 OLI scenes were converted from digital numbers (DN) to surface reflectance through rescaling according to the instructions of the provider (https://landsat.usgs.gov/using-usgs-landsat-8-product). As each product employed ground control and relief models (as delivered by the provider, namely USGS), geometric correction was not performed. Given the characteristics of our study area and the fact that the provider already performed a thorough correction, no topographical correction was applied since L1TP (Collection 1,) and L1T (Pre-Collection) was also orthorectified using ground control points and a digital elevation model (DEM) to correct for relief displacement (https://landsat.usgs.gov/geometry). All images were manually verified for coregistration using the Image-to-Image registration module of ENVI image processing software; the accuracy of the co-registration was verified using 20 checkpoints, giving a positional accuracy within an RMSE inferior to 0.5 pixel (Byun, Han, & Chae, Citation2015).
Classification method
Spectral analysis
Since both field data and Landsat 8 OLI imagery were acquired in June 2014, these two datasets were integrated in order to understand and assess the spectral discrimination between the desert sand and the inner-plain sand and to identify suitable spectral techniques for their delineation: band math and band transformation. These analyses were also supported by the geomorphological considerations on the aeolian forms and processes of the area previously studied by (Marini et al., Citation2008).
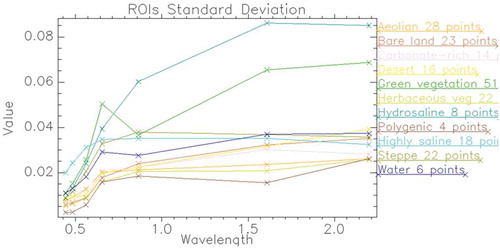
The spectral responses of land features retrieved from the Landsat mosaic of two Landsat 8 scenes acquired on the 12th and the 21st of June 2014 were analysed. Two different spectral responses of two types of sand (the inner-plain and the Grand Oriental Erg or desert) could be visually observed (). However, the reflectance values of these two types of sand were very similar when inspected pixel by pixel. Two pairs of regions of interest of the two sand types, inner-plain and desert, respectively, were engaged for spectral separability computation (Jeffries-Matusita). The resulting value (1.03) indicated low separation. Further to checking their extraction, a series of first tests of various appropriate supervised classification methods were conducted and misclassification issues emerged. In addition, the two sands regions of interest (ROIs) sets were also compared to other land features ROIs by computing spectral separability. Several values were very close to 1. The reason for these similarities is argued in the discussion section. The average spectra of the 213 training ROIs are presented in . The number of pixels and standard deviation of each ROI are presented in . ROIs standard deviation statistics are presented in . The number of pixels of each ROI represents the number of point data collected in the field, belonging to the training set.
Table 3. Standard deviation statistics of training ROIs.
Figure 3. Spectral analysis example. (a) False colour composite (FCC) of Landsat 8 OLI image of June 2014, bands 742 RGB. Field-collected points are represented with green circles (213 points used to generate training ROIs,) and red circles (validation ROIs, 228 points). Map projection: UTM – WGS 1984, Zone 32N, EPSG 32,632. (b) Sand encroachment example in the Jeffara plain area emphasised by the multivariate analysis technique based on principal components analysis (PCA) applied to Landsat 8 OLI of June 2014. Inner plain sandy areas appear ones yellowish with green and orange hues in the RGB 123 (1,2,3 are the first 3 principal components extracted from all seven Landsat 8 OLI bands). (c) Sand encroachment example in the Dahar area emphasised by the multivariate analysis technique based on principal components analysis (PCA) applied to Landsat 8 OLI of June 2014. Desert sandy areas appear with more enhanced yellow hues that the inner-plain in the RGB 123 (1,2,3 are the first 3 principal components extracted from all seven Landsat 8 OLI bands).
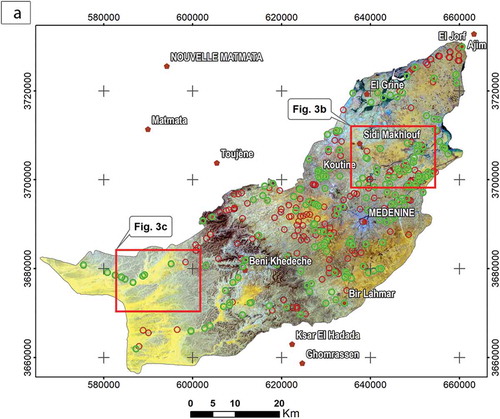
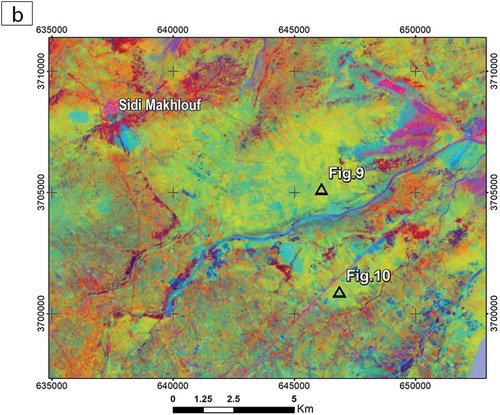
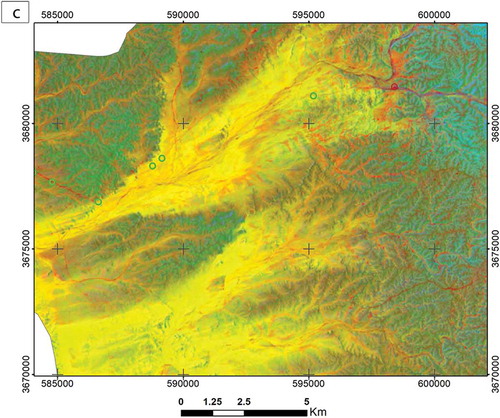
Figure 4. Average spectra of training ROIs.
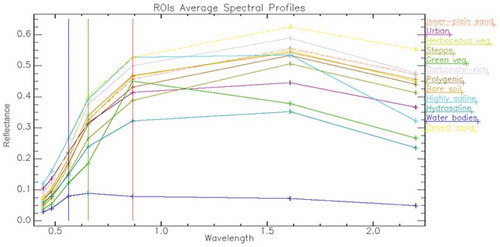
Figure 5. Standard deviation of training ROIs.
Consequently, several image analysis methods were employed in order to deepen the possibility of their separation and to identify optimum bands for their extraction. Horizontal, vertical and Z profiles and 2D scatter plots analysis gave insights on the optimal bands which could be used for the separation of the two different types of sand (Elnaggar & Noller, Citation2010; Immordino & Melis, Citation2008; Melis & Pilloni, Citation2011; Pilloni, Melis, & Marini, Citation2010). Band transformation and spectral enhancement techniques (among which principal component analysis, Tasseled Cap, and Knepper ratios performed best (Mia & Fujimitsu, Citation2012)) were used in order to better distinguish the two sand surfaces between them and also to delineate them from the other land features.
Decision tree classifier
Traditionally, classification tasks are based on statistical methodologies such as Minimum Distance-to-Mean, Maximum Likelihood and Mahalanobis Distance Classification (Simard, Saatchi, & DeGrandi, Citation2000). These classifiers are generally characterised by an explicit underlying probability model and are ideally suited for data in which its distribution within each of the classes can be assumed to follow a normal distribution in a multispectral space (Srimani & Prasad, Citation2012). A decision tree, as a predictive model, is a type of multistage classifier that can be applied to a single image or a stack of images. Decision trees that are used commonly in the remote sensing community include the automatic machine learning univariate algorithms such as C4.5 and C5.0/See5 (Pandya & Pandya, Citation2015; Quinlan, Citation1993) or multivariate algorithms such as Quick Unbiased Efficient Statistical Trees (QUEST) or classification and regression trees (CART) (Loh, Citation2011; Wang, Liu, Jiang, Zhang, & Zhao, Citation2012). However, in this study, we implemented the decision tree manually to assure maximum user control and structure manipulation. ENVI® Classic’s (ITT Vis Exelis) interactive decision tree tool is a useful way to explore data, or to find areas in data that fulfil certain criteria. The user does not need to start by having a tree that has been generated outside of ENVI Classic (thus it is free) in order to learn useful information about the dataset using the decision tree tool (Exelis Visual Information Solutions, Citation2013). Decision trees do not make any a priori assumption about data distribution, and hence they are essentially non-parametric in nature. The DT approach was applied due to its proven high accuracy in this these particular arid environments of very reflective, spectrally similar features, being a supervised, non-parametric, multi-stage classification method (Afrasinei et al., Citation2015; Melis et al., Citation2013; Otukei & Blaschke, Citation2010; Pal, Citation2012; Pal & Mather, Citation2003; Rogan et al., Citation2008). It is very effective and useful for the remote sensing community, especially for LULC classification. This classifier is intuitive, simple, flexible, and efficient in computing non-normal, non-homogenous and noisy data as well as non-linear relation between features and classes, missing value, and both numeric and categorical inputs (Otukei & Blaschke, Citation2010; Pal & Mather, Citation2003; Rogan, Franklin, & Roberts, Citation2002).
Classification assessment
Conventional classification methods were assessed through literature review and also by running some tests. The example of the traditional pixel-based image classification method, Maximum Likelihood (hereinafter MaxLike) classification, is described below. It was applied to the Landsat 8 OLI image of 2014 using training ROIs derived from the training set field data of the same period, as described in the section “Materials and data”.
The MaxLike classification was used due to its acknowledged efficiency among supervised pixel-based algorithms for land cover mapping (Hogland, Citation2013; Julien, Sobrino, & Jiménez-Muñoz, Citation2011; Simard et al., Citation2000). We managed to extract 15 LC classes. However, confusion matrix using the validation set (see the section “Materials and data”) showed an overall accuracy of 31.91% and a Kappa Coefficient of 0.29. The reason for these low values is probably related to high spectral similarity between classes, mixed pixel issues, the high number of classes set in the training areas and the heterogeneity within each class. Furthermore, parametric and single stage classifier often present this shortcoming, not being able to deal with non-linear data (Hogland, Citation2013; Perea Moreno & Meroño De Larriva, Citation2012; Rogan et al., Citation2008; Srimani & Prasad, Citation2012).
Designing new spectral indices
To extract the 11 LC classes, including sandy areas, we used band ratios and various vegetation or mineral indices as decision nodes, either extracted from literature or proposed in this study. Threshold values of decision nodes were retrieved through a histogram-based thresholding technique according to (Singh, Citation1989; Wu et al., Citation2014; Yang & Lo, Citation2000), and standard deviation and mean statistics were jointly used with skill-based visual observation of each index image. A threshold was tentatively applied according to the mean ± standard deviation (García, Contreras, Domingo, & Puigdefábregas, Citation2009) to examine whether it can divide the two areas of interest for each node (e.g. vegetated from non-vegetated areas) while compared with the natural colour composite or adequate false colour composite of the original images. The threshold values are presented in .
Table 4. Threshold values of the Landsat images of both 1984 and 2014.
Vegetation, water, mineral indices and band ratios applied in similar studies and bio-geographical areas were constructed or retrieved from literature, choosing the relevant ones for the purpose of this study (Bachir, Essifi, Zerrim, & Ouessar, Citation2013; Boulghobra, Citation2016; Hadeel, Jabbar, & Chen, Citation2011; Ouerchefani et al., Citation2013; Pandey, Rani, Srivastava, Sharma, & Nathawat, Citation2013; Sadiq & Howari, Citation2009). Once vegetation cover and water bodies were extracted, a vast area of bare soil/land remained unclassified. Since our study area is characterised by highly reflective surfaces, with a main mineral component, our objective was to correctly separate the various types of these “mineral surfaces”. From the land cover/land use point of view, these surfaces are classified as “bare lands”. However, from the lithological/mineral point of view, these classes can be separated on the basis of their main mineral component: carbonate-rich areas, halite saline areas, high quartz – content sandy areas, clay minerals – rich sandy areas and polygenic (usually alluvial deposits, slope deposits, mineral soils). Thus, the priority was to identify or define specific mineral spectral indices in order to discriminate these surfaces correctly, implying that the indices proposed in this study were particularly designed to meet these needs.
Five new indices were constructed based on choosing optimal band pairs/groups that presented the highest covariance in terms of spectral information of each feature of interest. To identify optimum bands for indices construction, the existing literature also proposes methods like Optimum Index Factor (OIF) or correlation analysis between measured spectral reflectance and satellite data (Sidike, Zhao, & Wen, Citation2014; Yu et al., Citation2010). Based on the principle of absorption bands of each land feature in specific wavelengths, optimal bands were identified. The training set ROIs (corresponding to Landsat 2014 image) were used to visually evaluate the performance of each index and in verifying the type of extracted feature (by overlapping ROIs to each index image).
Band ratios and indices were constructed through mathematical operations of bands (sum, subtraction, multiplication, division, square root, exponent) of highly decorrelated bands in order to discriminate features of interest with the highest possible separability. For Salt Minerals Index (SMI), Mineral Index (MI), InfraRed Index – Short Wave InfraRed 1 (IRI_SWIR1) and InfraRed Index – Near InfraRed (IRI_NIR) indices (), exponential and square root functions were used to force the emphasis of extreme values, helping to better discriminate areas of similar mineral content (Afrasinei, Melis, Buttau, Arras, et al., Citation2017; Allbed & Kumar, Citation2013; Allbed et al., Citation2014).
Table 5. Indices used in the DT classifier applied to the June 2014 Landsat image, Jeffara-Medenine-Dahar area.
X-ray diffraction analysis
Main minerals identification and quantity were achieved by XRD analysis based on the Reference Intensity Ratio (RIR) method. Spectral behaviour of samples, as retrieved from remote sensing data, is probably associated with the different proportions in quartz (main mineral component) and its association with clay minerals, calcite and gypsum (in the inner plain areas) or mainly with dolomite and calcite (in the desert area).
Change detection
Change detection analysis was performed through the post-classification approach, defined as the comparative analysis of individually produced classifications of different dates (El-Hattab, Citation2016; Latifovic & Pouliot, Citation2006; Nielsen, Citation2007; Woo & Do, Citation2015). Usually, this method consents the use of complex legends and, consequently, a more detailed analysis of land cover changes (Serra, Pons, & Saurí, Citation2003). High accuracy of each classification is required by the employment of this method. However, this is not always achieved, especially when a legend containing several agricultural categories (probably similar in terms of spectral signature) is required. In this case, considering fragmentation of the landscape, planimetric accuracies and pixel size, we considered that this change detection approach is proper, but other methods will be assessed in future research (Canty & Nielsen, Citation2012; Singh, Citation1989). The DT map of 1984 was used as initial-state image and the DT map of 2014 as final-state image. Post-classification change detection tool of ENVI software (ITT VIS Exelis) was applied in order to obtain the statistical input for quantitative change estimation of each LC class.
Results and discussion
DT classification and XRD analysis
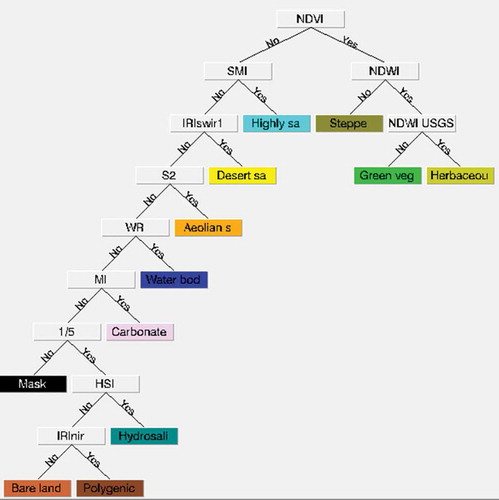
Pre-existing indices selected from literature and the new ones used for the DT classifier are reported in . The DT nodes hierarchy is illustrated in . The description of the resulting 11 LC classes is provided in . The proposed indices SMI, MI, IRI_SWIR1, IRI_NIR and Hue Salinity Index (HSI) provided an accurate extraction of mineral surfaces. Through the employment of these new indices and the pre-existing ones retrieved from literature, we managed to extract a higher number of land cover classes (11) than the average low number of classes (commonly between 4 and 7 classes) usually obtained through traditional classification schemes at local-regional scales (Avelar & Tokarczyk, Citation2014; Ceccarelli, Citation2013; Li et al., Citation2014; Marconcini, Fernandez-Prieto, & Buchholz, Citation2014; Nutini, Boschetti, Brivio, Bocchi, & Antoninetti, Citation2013). Furthermore, the discrimination of various mineral surfaces was consistent with the purpose of separating two different types of sandy areas.
Table 6. Description of the resulting classes of the DT classification.
Figure 6. Decision Tree classification nodes.
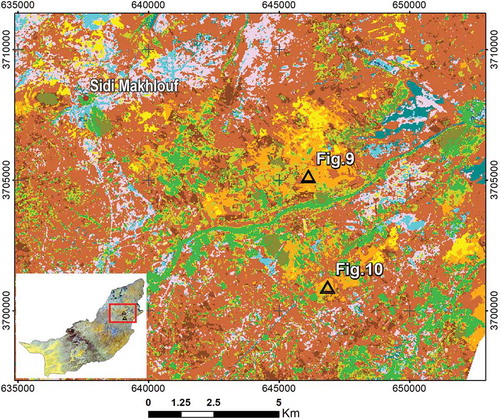
The DT maps of 1984 and 2014 are presented in and , respectively. Mapping results show a clear visual difference between sandy areas mainly found westwards of the Dahar domain (represented with yellow colour in and ), denoted as “desert sand”, and those within the Jeffara-Medenine plain, denoted as “aeolian sand” (represented with orange colour in and ). Examples of field observations on aeolian sand, hence sand encroachment areas in the Jeffara plain, and possible on-site indicators are given in and . The same points are overlain on the false colour composite (FCC) of Landsat 8 OLI June 2014 image bands 742 RGB (typical combination for geological/lithological observations) () and on the DT map of June 2014 ().
Figure 7. Decision Tree classification applied to June 1984 images, Jeffara-Medenine-Dahar area. Map projection: UTM – WGS 1984, Zone 32N, EPSG 32632 (metric coordinates).
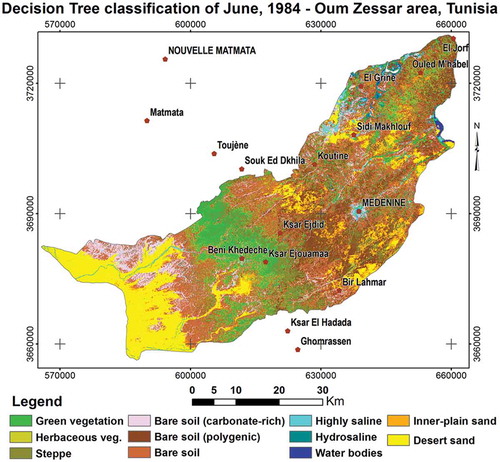
Figure 8. Decision Tree classification applied to June 2014 images, Jeffara-Medenine-Dahar area. Map projection: UTM – WGS 1984, Zone 32N, EPSG 32632.
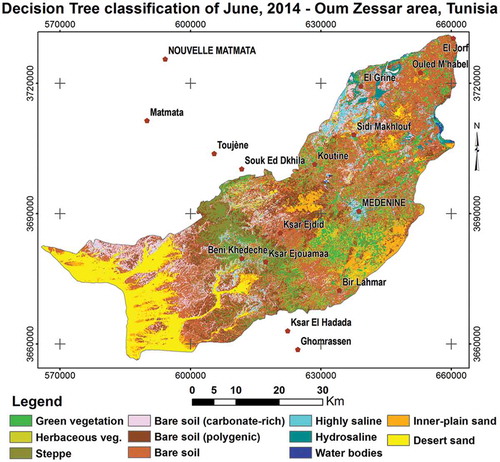
Figure 9. Example of sand encroachment area in the Jeffara-Medenine plain (360-degree-view panoramic photograph).
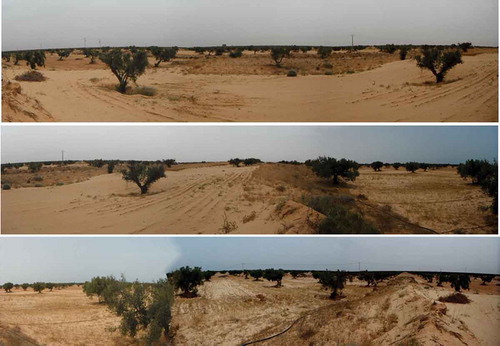
Figure 10. Example of aeolian erosion indicators: The roots of Olive trees indicate previous level of soil. Field observations were carried out in collaboration with the technicians from the Eremology Laboratory of the Institute des Regions Arides (IRA, Medenine, Tunisia), one of the WADIS-MAR project partner.
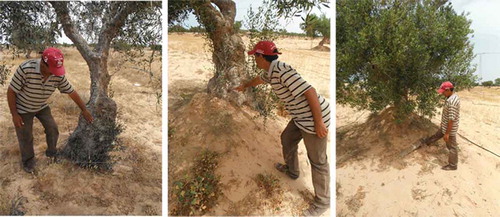
Figure 11. and location represented on the 742 RGB FCC of Landsat 8 OLI image of June 2014. Map projection: UTM – WGS 1984, Zone 32N, EPSG 32632.
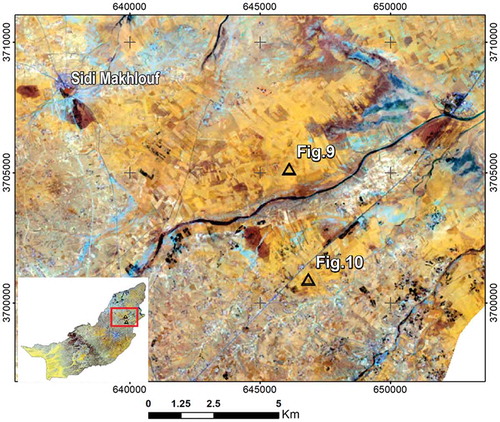
Figure 12. and location represented on the DT map of June 2014. Map projection: UTM – WGS 1984, Zone 32N, EPSG 32632.
The spectral separation of the two sand types may have been possible mainly due to the different mineralogical composition of the two sets of samples, as shown by the XRD analysis. The XRD results are presented in and , where the corresponding locations of the points are highlighted in the same colours. The mineralogical composition seem to be strongly connected to the spectral separability of the two types of sandy surfaces. Despite that, the XRD data are not conclusive, and further insights are needed, as well as more samples. An important aspect observed during the analyses is the contribution of granulometry and petrographic characteristics in separating the inner-plain samples from the desert ones. This aspect will be deepened in a future analysis as well as collecting more sand samples from both sectors (inner-plain and desert).
Figure 13. XRD analysis and percentages (semi-quantitative R.I.R. method): The inner-plain sand samples are grouped in the red rectangle and the Grand Oriental Erg sand samples are clustered in the yellow rectangle, in correspondence with the same separation in .
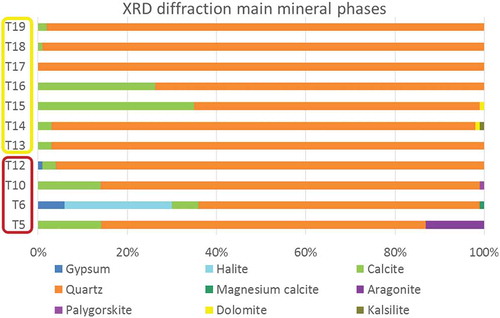
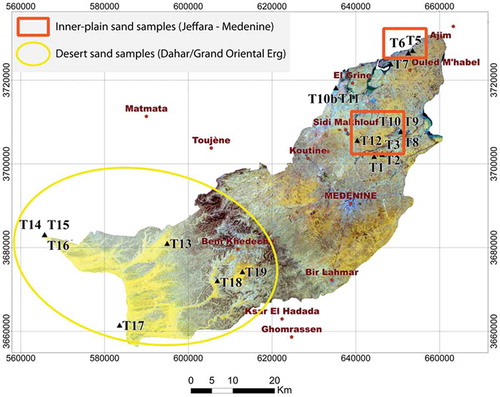
Figure 14. Location of XRD sampling points within the study area, displayed on the FCC 742 RGB, where the inner-plain sand samples are differentiated from the Grand Oriental Erg sand samples through the red and yellow rectangles, respectively, in correspondence with the same separation in . Map projection: UTM – WGS 1984, Zone 32N, EPSG 32632.
Accuracy assessment
The validation of the DTC maps showed an overall accuracy of around 89% and a kappa coefficient of 0.87. The confusion matrix statistics are presented in and accuracy percentages, in . The accuracy assessment of the DT map and field data confirm the validity of the methodological approach and the need of dedicated spectral techniques for challenging extraction of classes known to be prone to spectral confusion (Fares & Philip, Citation2008). In fact, the only classes that presented an accuracy below 80% are carbonate-rich areas (68.18% producer accuracy) and polygenic areas (76.92% user accuracy). Indeed, the confusion matrix show that the most important spectral confusion issues, though slight, occurred in these class pairs (a) polygenic areas and bare land, (b) highly saline areas and carbonate-rich areas class, (c) carbonate-rich areas and desert sand and (d) steppe and herbaceous. These results are explained and confirmed by existing literature, among which we mention:
The mineralogy of these features, in particular for pair (b), whose fundamental anion groups (HOH, OH−, CO32−, SO42) (Afrasinei et al., Citation2017; Clark, Citation1999) the internal vibration modes and thus spectral response.
In the case of pair (a), (b) and (c), (G. Metternicht & Alfred Zinck, Citation2008; G. I. Metternicht & Zinck, Citation2003; Xu, Citation2010) explained the spectral confusion between light-coloured bedrock or high-mineral content areas (salt crusts, sebkhas, rocky desert “reg”, limestone outcrops, sand dunes, sand sheets) and light soil, and between salty crusts and bright silt loam structural crusts.
The pair (d) can be explained by the fact that even though steppe contains a high number of woody and typical dry shrub vegetation, and the herbaceous class refers to annual crops, natural annual herbaceous vegetation, small shrubs (see ), areas where a cereal crop had been recently harvested and the stubble and straw were left covering the field, can contribute to this confusion, as confirmed by (Pellikka & Clark, Citation2009).
The case of pair (c) is also reposted in (Fares & Philip, Citation2008) mentioning that separating quartz minerals from carbonate minerals is challenging. However, this can be also explained by the fact that in the western part of the area, there are vast areas where thin sheets or layer of blown desert sand overlay irregularly the reg (rocky desert often consisting of local bedrock, in our case limestone, calcareous concretions), thus often leaving small windows of the underneath feature to be detected by the sensor.
However, other factors must be taken in consideration in order to explain our results. One regards the salt and pepper effect that a substantial percentage of the area has, since we did not apply any post-classification refinement (Latifovic & Pouliot, Citation2006), thus maintaining, as far as possible, the original information contained in the images. These areas are numerous where complex vegetation occurs, where natural vegetation is mixed with tabias and jessour crops (both in the mountain and lain areas), with interspersed sand sheets and nebkas and patches of sebkhas (in the coastal areas).
Table 7. DT confusion matrix.
Table 8. Accuracy assessment.
Another aspect concerns possible interference by vegetation cover (olive trees cultivations that overlap all the inner-plain sandy areas, distributed following a regular pattern). Furthermore, fine aeolian gypsum deposits are often blown, deposited and mixed with the sandy component, and thus the sand encroachment areas have a substantial gypsum component as shown by the XRD analyses.
Another aspect to be considered is that ROIs were not grown or buffered, being derived from point data, thus making validation challenging for us. This regards also the issue of mixed-pixels and the fact that, given a pixel of 30m by 30m, a GPS receiver may present low accuracies in remote areas such as the present one, especially in the mountain parts.
Finally, this procedure is a priori subjected to some errors due to the in-field recognition (Gomarasca, Citation2009), the field of view of the observer, and the evaluation subjectivity of the user when estimating the predominant land cover facet when collecting a field point information and eventually determining the correspondent land cover class.
Change detection
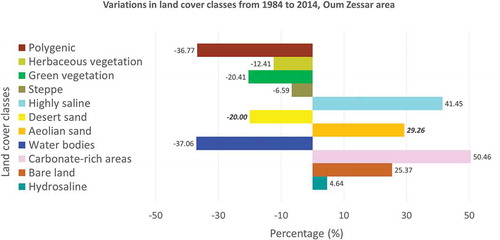
The results and statistics of the change detection analysis indicated an increase of the inner-plain sand by 29% and a decrease in desert sand by 20%, as shown in . This analysis demonstrated substantial change in several landscape components in the last decades, particularly concerning sand encroachment expansion within the Jeffara-Medenine plain by 29%. Spectral and mineral analyses indicate that the Jeffara-Medenine plain may have a main, possible in-situ source area of sand. A decrease of 20% of the “desert sand” class areal extent would be consistent with these findings. In fact, transport of sand from western directions to eastern parts is not significant enough to create vast areas of sand encroachment in the Jeffara-Medenine plain (Bachir et al., Citation2013; Khatelli & Gabriels, Citation2000; M. Ouessar, Citation2010).
Figure 15. Change detection statistics obtained from the DT maps of 1984 and 2014, Jeffara-Medenine-Dahar area.
The geomorphological and soil/vegetation parameters define the current potential, although limited, of the agricultural and livestock practices, despite the high incidence of human activity. The strong predisposition to the onset of arid conditions suggests a thorough planning of the agricultural and livestock husbandry activities. The geomorphological interpretation of the territory (100 km in length) shows the presence of three distinct morpho-climatic systems: semi-arid, arid and desert. Transition zones between adjacent systems are very limited. The rapid passing from a morpho-climatic system to another can be related to physiographic causes, for example, orography control over the distribution of rainfall and influence of local wind regime that participate to generate aeolian forms, sand encroachment and dune morphologies. This aspect, apart from having a key role over surface morphologies and processes, highlights the importance of the assessment of the desertification problem, highly contextualised to the morphological and orographic setting.
The methodological approach and the use of Landsat 8 data has provided results that show a clear distinction between the spectral reflectance of the desert sand and the inner-plain sandy surfaces. Their spectral signatures extracted from remotely sensed data are separable, confirming XRD analysis of the sand samples, which show slightly different mineralogical composition. We can infer that by means of the remote sensing techniques, integrated with ground truth information and the X-ray diffraction, it is possible to discriminate the two types of sandy surfaces and to assess spatial and temporal variations of each class. The XRD analysis showed that the inner plain samples are characterised by the presence of quartz (70–80%) mainly associated with clay minerals as well as gypsum and calcite, whereas desert sand revealed a greater proportion of quartz (usually over 90%) mainly associated with calcite and dolomite.
The results gave a reading of the dynamics of forms and processes of aeolian morphologies and their connection to either natural or anthropic factors. However, a clear distinction should be made between factors which influence a process and driving factors that trigger that process. The indicated changes are likely to be related to increased anthropic pressure and settlement, agricultural policies and national development strategies, in accordance with other works conclusions. Considering both factors, it would be accurate to say that the wind is a vector, not a trigger. The anthropic factor can be a trigger, related to the type and the degree of agricultural practices, change in land use, overexploitation of resources. We may argue that the sand encroachment phenomenon present within the Jeffara-Medenine plain has an autochthone, internal main source area. This inner-plain source area is also shown by predominant wind circulation and macro-scale studies of current aeolian processes. During the three-months internship at the “Institute des Regions Arides” headquarters at El Fje, Medenine, the issue of in-situ sand production has been extensively discussed with local researchers, field technicians and local farmers. Furthermore, field observations, past agricultural reports on pastures extent and land use change helped understand that around 30 years ago, the current sandy areas of the Jeffara-Medenine plain and costal area were mainly covered by natural vegetation. Sandy areas increased their expansion in the last 30 years concomitant with the transformation of those lands in vast Olive trees plantations, which have been constantly ploughed ever since (mouldboard).
Conclusion
The customised and replicable methodological approach proposed in this study, involving remote sensing techniques and field data analysis, proved to be efficient for monitoring spatio-temporal dynamics of sand encroachment phenomena. Using a Decision Tree classifier, both new and already existing spectral indices were employed for the extraction of eleven land cover classes. The new indices were specifically designed for the extraction of high-mineral content surfaces, among which two different sand types: desert (Grand Oriental Erg) and inner plain (Jeffara-Medenine). The classification results presented an overall accuracy of approx. 90%. The Decision Tree classifier has proven to be more flexible and adequate for the extraction of sandy areas and major land cover types, as it allows multi-source information and higher user control.
The results of 1984–2014 change detection analysis show an increase of inner-plain sandy areas and a decrease of desert sand. This is consistent with a possible in-situ production of sandy material and would be related to extensive change in land use over the past decades and intensive agricultural practices. Therefore, the assessment of land cover change through remote sensing and GIS is a valuable and efficient approach for delivering comprehensive findings to stakeholders and decision makers. A better evaluation of the sustainable strategies against desertification problem and taking effective measures of soil degradation reduction in such arid and semi-arid areas can be achieved through the proposed approach.
In the Jeffara-Medenine plain and costal area, land use change, overgrazing, expansion of cultivation and use of tillage or mouldboard ploughing instead of deep mole plough may have a great contribution in fine particles/sand production, potentially transportable by active winds (>3m/s). Mouldboard or turn plough is commonly applied in less fertile areas. To grow crops regularly, the soil must be turned to bring nutrients to the surface. In the Jeffara-Medenine plain area, mouldboard ploughing is practiced on small farming patches for crops and trees (private family cultivated perimeters, subsistence agriculture) but also on extended surfaces for Olive trees plantations (in the whole Jeffara coastal plain and inner, east of Dahar plain, mainly in areas already affected by sand encroachment). Therefore, the intensive and wide-ranging agricultural activities in the Jeffara-Medenine plain give a major contribution to the additional formation of dust, silt and sandy sediments through ploughing, re-working and intense mechanical labour of land in the whole Jeffara-Medenine plain. Sandy areas expansion in the Jeffara plain, massive land use change and decrease in natural vegetation cover infer intense anthropic pressure and agricultural practices.
The importance of this research is given by the likelihood that driving factors not related to climate change or the environment have strongly marked the landscape functionalities in the last decades, such as the anthropic ones. The necessity of this study is given by the need of constant monitoring through repeatable mapping of ongoing land degradation processes, which is indispensable for a proper land management designation and the implementation of adequate agricultural practices. In its turn, these operations require a good understanding of the dynamics and processes of these phenomena. Therefore, the methodologies and tools employed in this study contribute to a knowledge of desertification and land degradation processes, and hence a better territorial planning.
Acknowledgements
This study was developed within the frame of the doctoral research (2013–2016) of Gabriela Mihaela Afrasinei, financed by the Italian Ministry of Education, Universities and Research (MIUR), in “Soil preservation, environmental vulnerability, and hydrogeological protection” of the Doctoral school in Environmental and Land Sciences and Engineering, University of Cagliari, Italy. We wish to acknowledge the NRD team of the University of Sassari, the WADIS-MAR team for the scientific and financial support and the possibility of conducting the current research. We also thank the TeleGIS Laboratory team of the University of Cagliari (Italy) for their comprehensive support and collaboration. We also acknowledge the contribution given by the fellow researchers and professors of the Chemical and Geological Department of the University of Cagliari, and particularly Prof. Franco Frau for the support provided for the XRD analyses. We also wish to thank the WADIS-MAR partners for the provided data and support. Among the Tunisian partners, we owe distinct gratitude to the Institut des Regions Arides of Medenine, Tunisia (IRA), in particular to Dr. Mohamed Ouessar, Amar Zerrim, Messaoud Guied, Kamel Nagaz, Mohamed Moussa, Bouajila Essifi, Mongi Ben Zaied, Hanen Jarray, Hanen Dhaou, Dalel Ouerchefani and Amor Jlali for their invaluable support and collaboration during the field campaign, and the undertaken three-months internship.
Disclosure statement
No potential conflict of interest was reported by the authors.
Additional information
Funding
References
- Afrasinei, G.M. (2016). Study of land degradation and desertification dynamics in North Africa areas using remote sensing techniques. University of Cagliari. doi:10.13140/RG.2.1.2412.6327
- Afrasinei, G.M., Melis, M.T., Buttau, C., Arras, C., Zerrim, A., Guied, M., … Ghiglieri, G. (2017). Classification methods for detecting and evaluating changes in desertification-related features in arid and semi-arid environments. In M. Ouessar, D. Gabriels, A. Tsunekawa, & S. Evett (Eds.), Water and land security in drylands. Springer. doi:10.1007/978-3-319-54021-4_23.
- Afrasinei, G.M., Melis, M.T., Buttau, C., Bradd, J.M., Arras, C., & Ghiglieri, G. (2017). Assessment of remote sensing-based classification methods for change detection of salt-affected areas (Biskra area, Algeria). Journal of Applied Remote Sensing, 11(1), 016025.
- Afrasinei, G.M., Melis, M.T., Frau, F., Demurtas, V., Buttau, C., Arras, C., & Ghiglieri, G. (2015). Metodologia per la caratterizzazione spettrale delle superfici saline e delle aree interessate da aspersioni sabbiose tramite proximal sensing e remote sensing in Tunisia. Asita, 11–18. Retrieved from http://atti.asita.it/ASITA2015/Pdf/1-322.pdf
- Ahmady-Birgani, H., McQueen, K.G., Moeinaddini, M., & Naseri, H. (2017). Sand dune encroachment and desertification processes of the rigboland sand sea, central Iran. Scientific Reports, 7(1), 1523.
- Aleksandrowicz, S., Turlej, K., Lewiński, S., & Bochenek, Z. (2014). Change detection algorithm for the production of land cover change maps over the European union countries. Remote Sensing, 6(12), 5976–5994.
- Allbed, A., & Kumar, L. (2013). Soil salinity mapping and monitoring in arid and semi-arid regions using remote sensing technology: A review. Advances in Remote Sensing, 2(4), 373–385.
- Allbed, A., Kumar, L., & Aldakheel, Y.Y. (2014). Assessing soil salinity using soil salinity and vegetation indices derived from IKONOS high-spatial resolution imageries: Applications in a date palm dominated region. Geoderma, 230–231, 1–8.
- Allbed, A., Kumar, L., & Sinha, P. (2014). Mapping and modelling spatial variation in soil salinity in the Al Hassa Oasis based on remote sensing indicators and regression techniques. Remote Sensing, 6(12), 1137–1157.
- Arras, C., Cau, F., Buttau, C., Carletti, A., Funedda, A., & Ghiglieri, G. (2014). Geological modelling for hydrogeological purposes in Oum Zessar area (SE Tunisia). Rendiconti Online Societa Geologica Italiana, 31(1), 543.
- Arras, C., Melis, M.T., Afrasinei, G.-M., Buttau, C., Carletti, A., & Ghiglieri, G. (2017). Evaluation and validation of SRTMGL1 and ASTER GDEM2 for two Maghreb regions (Biskra, Algeria and Medenine, Tunisia). In M. Ouessar, D. Gabriels, A. Tsunekawa, & S. Evett (Eds.), Water and land security in drylands. Springer. doi:10.1007/978-3-319-54021-4_24
- Arras, C., Sy, M., Buttau, C., Da Pelo, S., Carletti, A., Afrasinei, G.M., & Ghiglieri, G. (2016). Preliminary results of a 3-D groundwater flow model in an arid region of NE Algeria using PMWin: The inféro-flux phreatic aquifer (Biskra). Rend Online Social Geological It, 41, 18–21.
- Avelar, S., & Tokarczyk, P. (2014). Analysis of land use and land cover change in a coastal area of Rio de Janeiro using high-resolution remotely sensed data. Journal of Applied Remote Sensing, 8(1), 83631.
- Bachir, M., Essifi, B., Zerrim, A., & Ouessar, M. (2013). Dynamique de l’occupation de sol à travers une classification multi-temporelle des images Landsat-5 et 7 dans le bassin versant d’Oum Zessar (Sud Tunisien). Retrieved from GEOTUNIS Google Scholar, 2013 - geosp.net, http://www.geosp.net/wp-content/uploads/2013/07/Mourtala-BACHIR.pdf.
- Boulghobra, N. (2016). Climatic data and satellite imagery for assessing the aeolian sand deposit and barchan migration, as a major risk sources in the region of In-Salah (Central Algerian Sahara). Arabian Journal of Geosciences, 9, 6.
- Bovolo, F., & Bruzzone, L. (2015). The time variable in data fusion: A change detection perspective. IEEE Geoscience and Remote Sensing Magazine, 3(3), 8–26.
- Brownett, J., & Mills, R. (2017). The development and application of remote sensing to monitor sand dune habitats. Journal of Coastal Conservation, 1–2. doi:10.1007/s11852-017-0504-x
- Byun, Y., Han, Y., & Chae, T. (2015). Image fusion-based change detection for flood extent extraction using bi-temporal very high-resolution satellite images. Remote Sensing, 7, 10347–10363.
- Canty, M.J., & Nielsen, A.A. (2012). Linear and kernel methods for multivariate change detection. Computers & Geosciences, 38(1), 107–114.
- Ceccarelli, T. (2013). Land cover data from Landsat single-date imagery: An approach integrating pixel-based and object-based classifiers. European Journal of Remote Sensing, 46(46), 699–717.
- Chander, G., Markham, B.L., & Helder, D.L. (2009). Summary of current radiometric calibration coefficients for Landsat MSS, TM, ETM+, and EO-1 ALI sensors. Remote Sensing of Environment, 113(5), 893–903.
- Clark, R.N. (1999). Chapter 1: Spectroscopy of rocks and minerals, and principles of spectroscopy by. In A.N. Rencz (Ed.), Manual of remote sensing, remote sensing for the earth sciences (Vol. 3, pp. 3–58). New York: John Wiley and Sons.
- Coudé-Gaussen, G. (1991). Les poussieres sahariennes. Geneviève: British Library Cataloguing in Publication Data Coudé-Gaussen. ISBN 0-86196-304-0.
- Coudé-Gaussen, G., & Rognon, P. (1986). Paléosols et loess du Pléistocène supérieur de Tunisie et d’Israël. Bulletin de l’Association Française Pour L’étude Du Quaternaire, 23(3–4), 223–231. doi:10.3406/quate.1986.1818
- Drake, N.A. (1997). Recent aeolian origin of surficial gypsum crusts in southern Tunisia: Geomorphological, archaeological and remote sensing evidence. Earth Surface Processes And Landforms, 22, 641–656.
- Duan, H.-C., Wang, T., Xue, X., Liu, S.-L., & Guo, J. (2014). Dynamics of aeolian desertification and its driving forces in the Horqin Sandy Land, Northern China. Environmental Monitoring and Assessment, 186(10), 6083–6096.
- El-Hattab, M.M. (2016). Applying post classification change detection technique to monitor an Egyptian coastal zone (Abu Qir Bay). The Egyptian Journal of Remote Sensing and Space Science, 19(1), 23–36.
- Elnaggar, A.A., & Noller, J.S. (2010). Application of remote-sensing data and decision-tree analysis to mapping salt-affected soils over large areas. Remote Sensing, 2(1), 151–165.
- Essifi, B., Ouessar, M., & Rabia, M.C. (2009). Mapping long-term variability of vegetation greenness and sand dunes around watering points in the rangelands of Dahar and El Ouara (Tataouine-Tunisia) during the period 1975-2000 using remote sensing. Journal of Arid Land Studies, 19(1), 319–322.
- Exelis Visual Information Solutions. (2013). ENVI classic tutorials.Boulder, Colorado: Exelis Visual Information Solutions
- Fares, M.H., & Philip, C.G. (2008). Characterization of salt-crust build-up and soil salinization in the United Arab Emirates by means of field and remote sensing techniques. In G. Metternicht & A. Zinck (Eds.), Remote sensing of soil salinization. CRC Press. doi:10.1201/9781420065039.ch8
- Fichera, C.R. (2012). Land cover classification and change-detection analysis using multi-temporal remote sensed imagery and landscape metrics. European Journal of Remote Sensing, 45, 1–18.
- Friedl, M.A., & Brodley, C.E. (1997). Decision tree classification of land cover from remotely sensed data. Remote Sensing of Environment, 61(3), 399–409.
- Gao, B. (1996). NDWI—A normalized difference water index for remote sensing of vegetation liquid water from space. Remote Sensing of Environment, 58(3),257–266. doi:10.1016/S0034-4257(96)00067-3
- García, M., Contreras, S., Domingo, F., & Puigdefábregas, J. (2009). Mapping land degradation risk. In Recent advances in remote sensing and geoinformation processing for land degradation assessment (pp. 261–277). CRC Press. doi:10.1201/9780203875445.ch1710.1201/9780203875445.ch17
- Ge, X., Dong, K., Luloff, A.E., Wang, L., Xiao, J., Wang, S., & Wang, Q. (2016). Correlation between landscape fragmentation and sandy desertification: A case study in Horqin Sandy Land, China. Environmental Monitoring and Assessment, 188(1), 62.
- Ge, X., Li, Y., Luloff, A.E., Dong, K., & Xiao, J. (2015). Effect of agricultural economic growth on sandy desertification in Horqin Sandy Land. Ecological Economics, 119, 53–63.
- Ghose, M.K., Pradhan, R., & Ghose, S.S. (2010). Decision tree classification of remotely sensed satellite data using spectral separability matrix. International Journal of Advanced Computer Science and Applications, 1(5), 93–101.
- Gitelson, A. A., Peng, Y., Arkebauer, T. J., & Schepers, J. (2014). Relationships between gross primary production, green LAI, and canopy chlorophyll content in maize: Implications for remote sensing of primary production. Remote Sensing of Environment, 144(0),65–72.
- Gomarasca, M.A. (2009). Basics of geomatics. doi:10.1007/978-1-4020-9014-1
- Hadeel, A.S., Jabbar, M.T., & Chen, X. (2011). Remote sensing and GIS application in the detection of environmental degradation indicators. Geo-Spatial Information Science, 14(1), 39–47.
- Hanafi, A., & Jauffret, S. (2008). Are long-term vegetation dynamics useful in monitoring and assessing desertification processes in the arid steppe, southern Tunisia. Journal of Arid Environments, 72(4), 557–572.
- Hogland, J. (2013). Comparison of standard maximum likelihood classification and polytomous logistic regression used in remote sensing. European Journal of Remote Sensing, 46, 623–640.
- Immordino, E.F., & Melis, M.T. (2008). Applicazione di indici spettrali a dati SPOT per lo studio delle marshlands dell’Iraq meridionale. Riassunti del 84° Congresso Nazionale della Società Geologica Italiana. (G. Oggiano, L. Carmignani, A. Funedda, & P. Conti, Eds.), Rendiconti Online Societa Geologica Italiana (Vol. 3). Società Geologica Italiana, Roma.
- Jensen, J.R. (2005). Introductory digital image processing: A Remote Sensing Perspective. 3rd Edition, Prentice Hall, Upper Saddle River, 505-512.
- Julien, Y., Sobrino, J.A., & Jiménez-Muñoz, J.-C. (2011). Land use classification from multitemporal Landsat imagery using the Yearly Land Cover Dynamics (YLCD) method. International Journal of Applied Earth Observation and Geoinformation, 13(5), 711–720.
- Khan, N. M., Rastoskuev, V. V, Sato, Y., & Shiozawa, S. (2005). Assessment of hydrosaline land degradation by using a simple approach of remote sensing indicators. Agricultural Water Management, 77(1–3), 96–109. doi:10.1016/j.agwat.2004.09.038
- Khatelli, H., & Gabriels, D. (1998). A study on the dynamics of sand dunes in Tunisia: Mobile barkhans move in the direction of the Sahara. Arid Soil Research and Rehabilitation, 12(1), 47–54.
- Khatelli, H., & Gabriels, D. (2000). Effect of wind direction on aeolian sand transport in southern Tunisia. International Agrophysics, 14, 291–296.
- Kross, A., McNairn, H., Lapen, D., Sunohara, M., & Champagne, C. (2015). Assessment of RapidEye vegetation indices for estimation of leaf area index and biomass in corn and soybean crops. International Journal of Applied Earth Observation and Geoinformation, 34(0),235–248.
- Latifovic, R., & Pouliot, D. (2006). Approaches to IPCC land-use and land-use change reporting in agriculture areas with remote sensing. North America Land Cover Summit. doi:10.1017/CBO9781107415324.004
- Li, Y., Zhao, K., Zheng, X., Ren, J., Ding, Y., & Wu, L. (2014). Identification of saline-alkali soil based on target decomposition of full-polarization radar data. Journal of Applied Remote Sensing, 8(1), 83511.
- Loh, W.-Y. (2011). Classification and regression trees. Wiley Interdisciplinary Reviews: Data Mining and Knowledge Discovery, 1(1), 14–23.
- Lorenz, R.D., Gasmi, N., Radebaugh, J., Barnes, J.W., & Ori, G.G. (2013). Dunes on planet Tatooine: Observation of barchan migration at the Star Wars film set in Tunisia. Geomorphology, 201, 264–271.
- Marconcini, M., Fernandez-Prieto, D., & Buchholz, T. (2014). Targeted land-cover classification. IEEE Transactions on Geoscience and Remote Sensing, 52(7), 4173–4193.
- Marini, A., Melis, M.T., Pitzalis, A., Talbi, M., & Gasmi, N. (2008). La carta della unità geomorfologiche della regione di Medenine (Tunisia meridionale). Memory Descr Carta Geological d’It, LXXVIII, 153–168.
- McFeeters, S. K. (1996). The use of Normalized Difference Water Index (NDWI) in the delineation of open water features. International Journal of Remote Sensing, 17(7),1425–1432.
- Melis, M.T., Afrasinei, G.M., Belkheir, O., Carletti, A., Iocola, I., Pittalis, D., … Ghiglieri, G. (2013). Caratterizzazione spettrale delle aree interessate da salinizzazione nel bacino del Oued Biskra in Algeria a supporto delle politiche di gestione dell’acqua nell’ambito del progetto WADIS-MAR. In Atti 17a Conferenza Nazionale ASITA, 5 – 7 Novembre 2013, Riva Del Garda. Riva del Garda: ASITA. Retrieved from http://atti.asita.it/ASITA2013/pdf/929-1294.pdf
- Melis, M.T., & Pilloni, M. (2011). Analysis and validation of a methodology to evaluate land cover in the mediterranean basin using multitemporal MODIS data [Analisi e validazione di una metodologia per la valutazione del land cover da dati MODIS nell’area mediterranea]. Italian Journal of Remote Sensing/Rivista Italiana Di Telerilevamento, 43(1), 19–31. Retrieved from https://www.scopus.com/inward/record.uri?eid=2-s2.0-80054874583&partnerID=40&md5=df66e7b645c216e98cb87928cab34b20
- Metternicht, G., & Alfred Zinck, J. (2008). Spectral behavior of salt types. In Remote sensing of soil salinization. CRC Press. doi:10.1201/9781420065039.ch2
- Metternicht, G.I., & Zinck, J.A. (2003). Remote sensing of soil salinity: Potentials and constraints. Remote Sensing of Environment, 85(1), 1–20.
- Mia, B., & Fujimitsu, Y. (2012). Mapping hydrothermal altered mineral deposits using Landsat 7 ETM+ image in and around Kuju volcano, Kyushu, Japan. Journal of Earth System Science, 121(4), 1049–1057.
- Micijevic, E., Haque, M.O., & Mishra, N. (2016). Radiometric calibration updates to the Landsat collection. Proc. SPIE 9972, Earth Observing Systems XXI (September 2016), 99720D. doi:10.1117/12.2239426
- Mihi, A., Tarai, N., & Chenchouni, H. (2017). Can palm date plantations and oasification be used as a proxy to fi ght sustainably against desertification and sand encroachment in hot drylands? Ecological Indicators. doi:10.1016/j.ecolind.2017.11.027
- Msadki, H.D., Bouzaida, D.O., Taamallah, H., & Ouessar, M. (2014). Apport des données Landsat Thematic Mapper pour la cartographie des sols dans la région de Menzel Habib. Afrique Science, 10(1), 68–78.
- Nash, D.J. (2000). Arid geomorphology. Progress in Physical Geography, 24(3), 425–443.
- Nielsen, A.A. (2007). The regularized iteratively reweighted MAD method for change detection in multi- and hyperspectral data. IEEE Transactions on Image Processing, 16(2), 463–478.
- Nutini, F., Boschetti, M., Brivio, P.A., Bocchi, S., & Antoninetti, M. (2013). Land-use and land-cover change detection in a semi-arid area of Niger using multi-temporal analysis of Landsat images. International Journal of Remote Sensing, 34(13), 4769–4790.
- Otukei, J.R., & Blaschke, T. (2010). Land cover change assessment using decision trees, support vector machines and maximum likelihood classification algorithms. International Journal of Applied Earth Observation and Geoinformation, 12(Supple(0)), S27–S31.
- Ouerchefani, D., Dhaou, H., Delaitre, E., Callot, Y., & Abdeljaoued, S. (2013). Geographic information system (GIS) and remote sensing for multi-temporal analysis of sand encroachment at Oglet Merteba (South Tunisia). African Journal of Environmental Science and Technology, 7(10), 938–943.
- Ouessar, M. (2007). Hydrological impacts of rainwater harvesting in wadi Oum Zessar watershed (Southern Tunisia). Ghent, Belgium: Faculty of Bioscience Engineering, Ghent University.
- Ouessar, M. (2010). Water harvesting and CC adaptation in the dry areas of Tunisia. Damascus, Syria: Regional Consultation Meeting Climate Change Impacts in the Arab Region: Water Scarcity, Drought, and Population Mobility.
- Ouessar, M., & Zerrim, A. (2014). Analyse de la vulnérabilité de l’oliveraie au changement climatique (CC) dans le gouvernorat de Médenine moyennant un outil SIG. Revue Des Régions Arides. Numéro Spécial Les Systèmes d’Information Géographique Pour l’Etude de l’Environnement, 33(1), 33–37.
- Pal, M. (2012). Advanced algorithms for land use and cover classification. In Advances in mapping from remote sensor imagery (pp. 69–90). CRC Press. doi:10.1201/b13770-410.1201/b13770-4
- Pal, M., & Mather, P.M. (2003). An assessment of the effectiveness of decision tree methods for land cover classification. Remote Sensing of Environment, 86(4), 554–565.
- Pandey, P.C., Rani, M., Srivastava, P.K., Sharma, L.K., & Nathawat, M.S. (2013). Land degradation severity assessment with sand encroachment in an ecologically fragile arid environment: A geospatial perspective. QScience Connection, 43(2013), 17.
- Pandya, R., & Pandya, J. (2015). C5. 0 Algorithm to improved decision tree with feature selection and reduced error pruning. International Journal of Computer Applications, 117(16), 18–21.
- Pellikka, P.E., & Clark, B.F. (2009). Landscape analysis using multi-scale segmentation and object-oriented classification. In Recent advances in remote sensing and geoinformation processing for land degradation assessment (pp. 323–341). CRC Press. doi:10.1201/9780203875445.ch2110.1201/9780203875445.ch21
- Perea Moreno, A.J., & Meroño De Larriva, J.E. (2012). Comparison between new digital image classification methods and traditional methods for land-cover mapping. In Remote sensing of land use and land cover (pp. 137–152). CRC Press. doi:10.1201/b11964-13
- Pilloni, M., Melis, M.T., & Marini, A. (2010). Analysis and validation of a methodology to evaluate land cover change in the mediterranean Basin using multitemporal Modis data. Present Environment and Sustainable Development, 4, 20–24.
- Quinlan, J.R. (1993). C4.5: Programs for machine learning. San Mateo, CA: Morgan Kaufman Publishers.
- Ren, X., Dong, Z., Hu, G., Zhang, D., & Li, Q. (2016). A GIS-based assessment of vulnerability to aeolian desertification in the source areas of the Yangtze and yellow rivers. Remote Sensing, MDPI, 8, 626.
- Rogan, J., Franklin, J., & Roberts, D.A. (2002). A comparison of methods for monitoring multitemporal vegetation change using thematic mapper imagery. Remote Sensing of Environment, 80(1), 143–156.
- Rogan, J., Franklin, J., Stow, D., Miller, J., Woodcock, C., & Roberts, D. (2008). Mapping land-cover modifications over large areas: A comparison of machine learning algorithms. Remote Sensing of Environment, 112(5), 2272–2283.
- Sadiq, A., & Howari, F. (2009). Remote sensing and spectral characteristics of desert sand from Qatar Peninsula, Arabian/Persian Gulf. Remote Sensing, 1(4), 915–933.
- Schiettecatte, W., Ouessar, M., Gabriels, D., Tanghe, S., Heirman, S., & Abdelli, F. (2005). Impact of water harvesting techniques on soil and water conservation: A case study on a micro catchment in southeastern Tunisia. Journal of Arid Environments, 61(2), 297–313.
- Serra, P., Pons, X., & Saurí, D. (2003). Post-classification change detection with data from different sensors: Some accuracy considerations. International Journal of Remote Sensing, 24(23), 4975–4976.
- Sidike, A., Zhao, S., & Wen, Y. (2014). Estimating soil salinity in Pingluo County of China using QuickBird data and soil reflectance spectra. International Journal of Applied Earth Observation and Geoinformation, 26, 156–175.
- Simard, M., Saatchi, S., & DeGrandi, G. (2000). Comparison of a decision tree and maximum likelihood classifiers: Application to SAR image of tropical forest. In Geoscience and Remote Sensing Symposium, 2000. Proceedings. IGARSS 2000. IEEE 2000 International (Vol. 5, pp. 2129–2130). Honolulu, HI, USA: IEEE. 10.1109/IGARSS.2000.858324
- Singh, A. (1989). Review article digital change detection techniques using remotely-sensed data. International Journal of Remote Sensing, 10(6), 989–1003.
- Srimani, P.K., & Prasad, N. (2012). Decision tree classification model for land use and land cover mapping - a case study. International Journal of Current Research, 4(5), 177–181.
- Swezey, C. (2001). Eolian sediment responses to late Quaternary climate changes: Temporal and spatial patterns in the Sahara. Palaeogeography, Palaeoclimatology, Palaeoecology, 167, 119–155.
- Talbi, M. (1997). Action anthropique et dégradation de l’environnement aride : La désertification en Tunisie du Sud-Est. Méditerranée, 86, 25–31.
- Trabelsi, R., Abid, K., Zouari, K., & Yahyaoui, H. (2012). Groundwater salinization processes in shallow coastal aquifer of Djeffara plain of Medenine, Southeastern Tunisia. Environmental Earth Sciences, 66(2), 641–653.
- Vacca, A., Loddo, S., Melis, M.T., Funedda, A., Puddu, R., Verona, M., … Schirru, P. (2014). A GIS based method for soil mapping in Sardinia, Italy: A geomatic approach. Journal of Environmental Management, 138, 87–96.
- van der Meer, F. D., van der Werff, H. M. A., van Ruitenbeek, F. J. A., Hecker, C. A., Bakker, W. H., Noomen, M. F., … Woldai, T. (2012). Multi- and hyperspectral geologic remote sensing: A review. International Journal of Applied Earth Observation and Geoinformation, 14(1),112–128. doi:10.1016/j.jag.2011.08.002
- Vogiatzakis, I.N., & Melis, M.T. (2015). Changing perceptions in Mediterranean Geography: The role of geospatial tools. In A. Douguédroit, L.F.C. Theano, & S. Terkenli (Eds.), Connections, mobilities, urban prospects and environmental threats. The mediterranean in transition. Newcastle upon Tyne, UK: Cambridge Scholars Publishing.
- Wang, D., Liu, X., Jiang, L., Zhang, X., & Zhao, Y. (2012). Rough set approach to multivariate decision trees inducing. Journal of Computers, 7(4), 870–879.
- Woo, D., & Do, V.D. (2015). Post-classification change detection of high resolution satellite images using adaboost classifier multi-class adaboost algorithm. Advanced Science and Technology Letters, 117, 34–38.
- Wu, W., Mhaimeed, A.S., Al-Shafie, W.M., Ziadat, F., Dhehibi, B., Nangia, V., & De Pauw, E. (2014). Mapping soil salinity changes using remote sensing in Central Iraq. Geoderma Regional. doi:10.1016/j.geodrs.2014.09.002
- Xu, H. (2010). Analysis of impervious surface and its impact on urban heat environment using the normalized difference impervious surface index (NDISI). Photogrammetric Engineering & Remote Sensing, 76, 557–565.
- Yang, X., & Lo, C.P. (2000). Relative radiometric normalization performance for change detection from multi-date satellite images. Photogrammetric Engineering & Remote Sensing, 66(8), 967–980.
- Yu, R., Liu, T., Xu, Y., Zhu, C., Zhang, Q., Qu, Z., … Li, C. (2010). Analysis of salinization dynamics by remote sensing in Hetao Irrigation District of North China. Agricultural Water Management, 97(12), 1952–1960.