
ABSTRACT
High temporal and spatial-resolution imageries are a valuable data source for slum monitoring. However, the transferability of OBIA methods across space and time remains problematic, due to the complexity of the term “slum”. Hence, transparency is important when analysing the transferability of OBIA methods for slum mapping. Our research developed a framework for measuring the temporal transferability of OBIA methods employing the trajectory error matrix (TEM). We found relatively low trajectory accuracies indicating low temporal transferability of OBIA methods for slum monitoring using point-based assessment methods. However, the analysis of change needs to be combined with an analysis of the certainty of this change by considering the context of the change to deal with common problems such as variations of the viewing angles and uncertainties in producing reference data on slums.
Introductions
Adverse impacts have emerged as a result of the rapid expansion of cities, particularly in the Global South. The disparities between urban and rural areas are urging people to move to cities searching for a better life. Unfortunately, governmental institutions often fail in providing serviced land with basic facilities to the growing urban population (Centre on Housing Rights and Evictions, Citation2008; Ooi & Phua, Citation2007). High land prices in cities force low-income households to settle in areas that were not planned for development (i.e. slums) with sub-standard facilities (Centre on Housing Rights and Evictions, Citation2008).
Although the reduction of slums is part of the global agenda (United Nations, Citation2014), updated information regarding the dynamics of slums (e.g. growth and clearance) is scarcely available (Shoko & Smit, Citation2013). Commonly employed approaches for data collection on slums, i.e. survey-based methods, have their limitations (Kohli, Sliuzas, Kerle, & Stein, Citation2012). For instance, due to the high temporal dynamics of slums, such data might be obsolete when they are used (Hofmann, Strobl, Blaschke, & Kux, Citation2008).
The use of satellite images offers an opportunity to capture the dynamics of slums since they can provide spatially consistent data with both high spatial detail and temporal frequency (Hofmann et al., Citation2008). However, detecting slums from satellite images has challenges as slums often share similar surface materials with other urban features (Kohli, Warwadekar, Kerle, Sliuzas, & Stein, Citation2013; Kuffer, Pfeffer, & Sliuzas, Citation2016). Hence, slum detection methods that rely on spectral information alone should be avoided (Jain, Citation2007), and additional criteria, e.g. shape, texture and density should be considered to avoid misclassifications (Kohli et al., Citation2013). Object-Based Image Analysis (OBIA) has this potential compared to classical pixel based methods as it can incorporate contextual information of objects (Ebert, Kerle, & Stein, Citation2009). However, OBIA shows limited transferability, i.e. methods developed for a specific image cannot be easily applied to another image, city or even other part of the same city (Hofmann et al., Citation2008). To improve transferability, Hofmann et al. (Citation2008) suggested using an ontology as a basis for slum detection. Consequently, Kohli et al. (Citation2013) developed the generic slum ontology (GSO) to assist slum detections by providing a comprehensive characterisation of slums in an image. The GSO builds on one of the five indicators for slum household i.e. the durable housing indicator from the definition specified by UN-Habitat (Citation2009). It describes slum characteristics at three spatial levels, i.e. environs, settlement and object level (Kohli et al., Citation2012). The GSO was developed as a generic framework for slums, but it requires adaptations for applying it to a local context (Kohli et al., Citation2013). Moreover, slums change over time (e.g. Kim, Hensley, Yun, & Neumann, Citation2016; Kit & Lüdeke, Citation2013), which makes multi-temporal information crucial to monitor slum dynamics, and to analyse the impact of slum-related policies (Patel, Crooks, & Koizumi, Citation2012).
The OBIA approach relies on a ruleset that operationalises slum indicators of the GSO. The aim of a rule-based classification is to increase the accuracy of urban features, particularly to minimise the confusion errors among classes with similar spectral information (Bouziani, Goita, & He, Citation2010). A ruleset represents a set of rules, which allows employing various characteristics to distinguish slum and non-slum areas. However, due to the need for local adaptation of the GSO, ruleset adaptations are inevitable (Anders, Seijmonsbergen, & Bouten, Citation2015; Kohli et al., Citation2013; Tiede, Lang, Hölbling, & Füreder, Citation2010). Therefore, it is crucial to describe these adaptations transparently (e.g. when employing the ruleset to a different image) to ensure the objectivity of the ruleset (Anders et al., Citation2015).
Various studies have discussed the transferability of OBIA rulesets for slum detection (Hofmann, Blaschke, & Strobl, Citation2011; Kohli et al., Citation2013), by comparing mapped slum locations using a specific or adapted ruleset across different locations (i.e. spatial transferability). However, to the best of our knowledge, a study focusing on measuring the temporal transferability of OBIA rulesets for slum detection has not been done so far. The aim of this study is to develop a framework for measuring the temporal transferability of a ruleset for OBIA-based slum detection. First, we develop a framework for measuring the temporal transferability of OBIA-based rulesets for slum detection. Second, we implement the framework for post-classification-based change detection of multi-temporal Pleiades imageries. Third, we discuss and evaluate the usage of our framework. Finally, we provide conclusions in terms of applicability of the trajectory error matrix (TEM) for analysing temporal dynamics of slums.
Development of the transferability framework
This section consists of two parts. First, we discuss various frameworks used for measuring transferability in different domains. Second, we discuss the process of implementing the framework for measuring temporal transferability of OBIA rulesets for slum detection.
Comparison of different frameworks for measuring temporal transferability
Transferability refers to the capability of a certain method to provide comparable results with a minimum of adaptations when applied to different image conditions (Kohli et al., Citation2013), thus transferability of a model developed for images collected at one point in time to another point in time, of the same area (Fox, Daly, Hess, & Miller, Citation2014). Therefore, temporal transferability in our study refers to the ability of a ruleset to produce comparable results when applied to a different temporal image.
In the OBIA domain, researchers commonly measure transferability on the basis of required adaptations of the ruleset (e.g. Anders et al., Citation2015; Hamedianfar & Shafri, Citation2015; Tiede et al., Citation2010) for obtaining similar accuracies. For mapping slums, Hofmann et al. (Citation2011) developed a framework for measuring the robustness of OBIA rulesets based on the need of threshold adaptations, for obtaining similar results in different images. Kohli et al. (Citation2013) analysed the transferability of a locally adapted ruleset based on the GSO for one image subset and applied it to other subsets comparing accuracy results.
Thus in most frameworks, the accuracy achieved with minimum adaptations is the key parameter for measuring transferability, i.e. the more similar the accuracy of different classification results, the more transferable the ruleset. The most common methods for accuracy assessment are the error matrix and kappa coefficient. However, these methods are designated for single temporal thematic mapping (Li & Zhou, Citation2009). Therefore, Macleod and Congalton (Citation1998) proposed a change detection error matrix, by modifying the standard error matrix to assess accuracies of a land cover change detections. Li and Zhou (Citation2009) proposed the TEM, which is more suitable for analysing multi-temporal images compared to the change detection error matrix (which can be optimally employed for only two observations). The TEM is based on a modification of the change detection error matrix from Macleod and Congalton (Citation1998), it utilises the land cover change trajectories (Crews-Meyer, Citation2001; Mertens & Lambin, Citation2000; Petit, Scudder, & Lambin, Citation2001).
Although Li and Zhou (Citation2009) used a small number of classes and images (i.e. four classes in three different temporal images, and five classes in two different temporal images), they dealt with a large number of land cover change trajectories. A high number of possible trajectories can make the implementation difficult as the TEM results in too many columns and rows. Therefore, they classified the possible trajectory combinations into six confusion sub-groups (shown in ) to reduce the complexity in change detection analysis. To this end, we argue that TEM with six confusion sub-groups from Li and Zhou (Citation2009) is the most suitable framework for assessing the temporal transferability as it can utilise multi-temporal images and also reduces the complexity in the confusion matrix.
Table 1. Adaptation of difference subgroups in the trajectory error matrix (TEM) (Li & Zhou, Citation2009).
Implementation of the temporal transferability framework
We adopt the TEM using four steps for calculating the accuracy of change detections. The first step is to develop the land cover/use change trajectories and the reference data. Second, determine the confusion sub-groups in the TEM for each sample (see ). Third, calculate the total members of each sub-group. Fourth, compute the accuracy indices.
Regarding the first step, several approaches can be used for change detection, e.g. post classification, image differencing, unsupervised change detection (Leichtle, Geiß, Wurm, Lakes, & Taubenböck, Citation2017). In post-classification change detection, which is commonly employed in urban remote sensing (Hussain, Chen, Cheng, Wei, & Stanley, Citation2013), each image is first classified separately, either using pixel-based techniques or OBIA; then the classification results are compared to indicate changes (Macleod & Congalton, Citation1998). In general, post-classification change detection is less sensitive to radiometric variations among different temporal images (Mas, Citation1999). This approach is more appropriate to our study since we use an OBIA-based method for slum detection. A similar approach is to conduct OBIA-based classification followed by pixel-based post-classification for change detection (see Zhou, Troy, & Grove, Citation2008). We specifically focused on change detection between slum and non-slum areas across different temporal images.
In the second step, we extracted six categories of confusion sub-groups, as shown in . In (S1), both reference data and image classification agree, and slum or non-slum areas are correctly classified. For instance, in the sample (x), pixels are correctly classified as slums, and both reference and image classification indicate that the area remains a slum. In (S2), both reference and image classifications indicate changes, i.e. both reference and the image classification result indicate that the area changed from slum to non-slum. In (S3), both reference data and image classification show similar results, but without a correct classification. In (S4), the reference data indicate no change, but it is detected as a change in image classification. In (S5), reference data indicate that the sample changes, but the image classification does not show changes. Last, for (S6), both reference and image classification indicate changes, but with incorrect trajectories, i.e. the reference data show change from slum to non-slum, but the image classification shows a change from non-slum to slum. To give a better understanding, illustrates the difference between the subgroups (S1–S6).
Figure 1. Different combinations of classification result, reference data and change trajectory in the trajectory error matrix (TEM), adapted from Li and Zhou (Citation2009).
In the third step, we compared the classification results with the reference data to calculate the accuracy of the land cover classification. For this purpose, we generated 300 random points, which were assigned classes based on visual image interpretations using Google Street View and ground knowledge. Therefore, we obtained 300 random points with its corresponding classification between 2013 and 2015 (i.e. 900 reference data). We used this information as an input to determine the change trajectory (S1–S6).
Regarding the fourth step, Li & Zhou (Citation2009) proposed two accuracy measures, i.e. overall accuracy and accuracy difference. Overall accuracy is measured by using two indices, trajectory overall- accuracy (AT) and change/no change accuracy (AC/N). Trajectory overall accuracy is measured as the ratio between correct cases (classification and changes) over the total samples (1).
Meanwhile, the change/no change accuracy (AC/N) is measured by including any correct change between the reference and image classification (2).
The higher the value for AT, the more reliable the change detection result. The accuracy difference is used to indicate how much AC/N can represent the accuracy of individual trajectories. To measure accuracy differences, Li and Zhou (Citation2009) proposed two indices, i.e. overall accuracy difference (OAD) and the accuracy difference of individual class (ADIC). OAD indicates the difference between AC/N and AT (3), where a high OAD indicates high accuracy when measuring AT (Li & Zhou, Citation2009).
Meanwhile, ADIC measures accuracies for individual trajectories, and it considers both no-change and change classes, Equation (4) measures the no-change trajectory (ADICN), and (5) calculates the change trajectory (ADICC).
A high value for AC/N is not necessary to obtain a high accuracy for an individual trajectory if the ADIC value is low.
Methodology: implementation of the TEM
This section consists of two parts. First, we describe the study area, the data and image pre-processing to ensure comparison of multi-temporal images. Second, we locally adapt the GSO based on interviews with local experts and develop a ruleset to detect slums in the study area across multi-temporal Pleiades imageries (2013–2015).
Study area, data and pre-processing
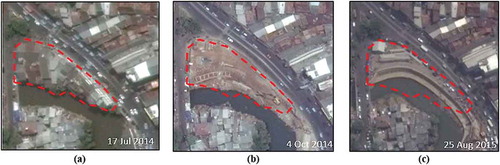
To demonstrate the applicability of our framework, we chose Jakarta, Indonesia as a study area. Jakarta is a highly dynamic urban area with more than 30 million inhabitants within its metropolitan area (Demographia, Citation2016). Recently, the government of Jakarta started programme for mapping all slums across the country, to meet the national policy target of zero slums by 2019 (UN-Habitat, Citation2014). The programme will include slum upgrading but also relocating slum dwellers at a massive scale (). Presently, slum mapping is done based on ground surveys using a complex set of indicators (Ministry of Public Works and Housing (Kemen PUPR), Citation2016), which results in inconsistent maps (done by local surveys) and an observed dramatic increase in reported slums by municipalities, hoping to acquire national funds for upgrading (Leonita, Citation2018). Obtaining timely and reliable information regarding the dynamics of slums is crucial for a consistent slum database that allows monitoring the policy implementation.
Figure 2. The dynamics of slums in Jakarta (Image source: Google earth). In (a), we see a slum (red-stripped area). Three months later, the slum did not exist (b), and within one year (c), the government finished construction of a road for river inspection.
However, slum mapping in Indonesia employing morphological indicators in remotely sensed imageries is challenging. Informal areas, locally called kampungs, dominate residential areas in Jakarta. These areas appeared more than 50 years ago when the planning institutions were not yet established (Rukmana, Citation2008). A kampung is a spontaneous urban settlement that has grown organically without planning guidance or provision of services (Sihombing, Citation2014). Kampungs are not necessarily slums, although they may share similar morphological characteristics as slums. Nowadays, many kampung residents have a formal ownership on land, and they often come from middle-class income households (see Sihombing, Citation2007, Citation2014).
We employed multi-temporal Pleiades images with standard-ortho bundles for the years 2013–2015. The images have a spatial resolution of 0.5 m for red, green, blue and near infra-red bands. We selected an image for each year with less than 10% cloud cover. Since multi-temporal data was used, variations of the atmosphere during this period could affect the outcome. Therefore, image pre-processing, i.e. haze and sun angle correction, was done to ensure consistent input for the ruleset.
Local adaptations and slum detection
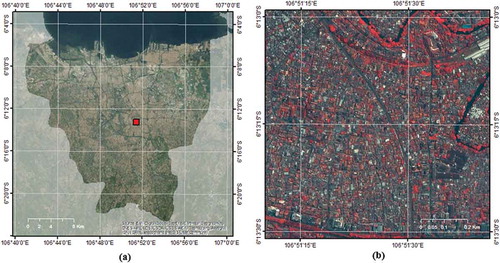
Topic-focused interviews (Groenendijk & Dopheide, Citation2003) were conducted with local experts from different institutions and backgrounds (i.e. central government, local government, NGO, consultant) to determine the local characteristics of slums. We selected subsets within the Tebet District of South Jakarta (), due to three reasons. First, Tebet District comprise of various urban land uses, namely high-class residential, central business district (CBD), transportation hub and slums. Second, slums are often located on the riverbanks of this district. Third, different typologies of slums exist in the district, e.g. slums located on the riverbanks, near railroads and close to the CBD. Thus, the selected area is a complex area, where local experts exhibited high level of uncertainties when visually delineating slum boundaries as shown in a previous study (Pratomo, Kuffer, Martinez, & Kohli, Citation2017). Across the three years used in this study, slum do not show substantial changes, which provides an optimal and very complex test case to assess whether the TEM captures the low dynamics in the area and analysing the temporal transferability of the ruleset.
Figure 3. Map of the study area, where (a) shows the administrative boundary of Jakarta, while (b) shows the image subset of Tebet district (size = 1 square kilometre).
The six local experts that were interviewed had different perceptions regarding slum characteristics (). For some features, the experts had a high agreement, i.e. located on riverbank, small building size, irregular pattern and poor roof materials. Meanwhile, two characteristics were only mentioned by one expert from the local government, i.e. located close to the high-class residential or CBD, built on illegal land. The tenure status (i.e. built on illegal land) cannot be directly detected from the satellite imagery. However, experts from the local government argued that slum and non-slum kampungs can be only distinguished by this characteristic.
Table 2. Different characteristics of slums specified by local experts. (1) is from the central government; (2) is from the local government; (3) is from Non-Government Organization (NGO); and (4) and (5) are local housing consultants (Pratomo et al., Citation2017).
We translated the real-world definitions of slums from the local experts to the image based features by using several visual elements, e.g. tone, shape, size, association and texture. For instance, slums have an unorganised layout, which relates to the object geometry, i.e. the shape of slums. We also used association to describe the relationship between objects and other spatial features. For instance, slums are often found on riverbanks, thus, river can be associated with slums. Regarding tenure characteristics (), we used ancillary data (e.g. socio-economic, tenure status) as demonstrated by Kohli et al. (Citation2013) or Netzband (Citation2010). We also used the official land-use planning map, obtained from the Government of Jakarta. According to the discussions with the local experts, the government owns open spaces (e.g. public parks, riverbanks) and it is prohibited to build on them. Therefore, this data could be used as a proxy indicator for determining the tenure status. Thus illegal settlements could be identified by overlaying the boundaries of open spaces on the imageries. A comparison of the real-world and image domain characteristics of slum can be seen in .
Table 3. Association of the real-world characteristics from the local experts with image domain characteristics (adapted from Pratomo et al., Citation2017).
We developed the OBIA ruleset according to image domain characteristics () in Trimble E-Cognition version 9.2.1. Slum detection was conducted in two stages, segmentation and classification. Various algorithms can be used for the segmentation, e.g. chessboard, quad-tree-based, contrast filter, contrast split, multi-resolution, multi-threshold (Trimble Germany GmbH, Citation2015). For slum detection, multi-resolution segmentations (MRS) is the most widely used algorithm (Kohli et al., Citation2012; Kuffer, Barros, & Sliuzas, Citation2014), as it can produce homogeneous objects from different types of data (Baatz & Schäpe, Citation2000). The implementation of MRS depends on the Scale Parameter (SP) (Drǎguţ, Tiede, & Levick, Citation2010) which controls the heterogeneity and size of an image object (Baatz & Schäpe, Citation2000). Often SP values are selected by a trial-and-error process (Whiteside, Boggs, & Maier, 2011), which decreases the robustness of the approach (Arvor, Durieux, Andrés, & Laporte, 2013). Hence, we employed Estimation of Scale Parameter (ESP), developed by Drǎguţ et al. (Citation2010), to optimise the selection of SP based on the rate of change in the local variance (ROC-LV).
Following the segmentation process, we employed a two-level classification, which started with background removal followed by slum detection. First, we focused on extracting the background classes with smooth segmentation (MRS, SP = 5), i.e. vegetation, railroad, road and river. To assist the classification of the background classes, we used ancillary data from Open Street Map (OSM) to extract roads, railroads and rivers. The normalised difference vegetation index (NDVI) was used for detecting vegetation. Second, we calculated the SP using the ESP tool. For the complete process of developing the ruleset, refer to . This ruleset started with a smooth segmentation for background removal and was followed by coarser segmentation at Level 2. In this level, we implemented the SP obtained from ESP for each image. In addition, we implemented different classification thresholds for each image.
Figure 4. OBIA-based ruleset for slum detection.
A fine-tuning of threshold values was employed, using trial and error, to the indices that are affected by atmospheric variations (i.e. colour), to obtain comparable results from the ruleset across different years (). Meanwhile, we kept other indicators constant, i.e. association, shape, size ().
Table 4. Implementation of difference thresholds for level 2 classification for slum detection, by employing different SP, NDVI and roof tone.
Results
In this section, we apply OBIA across multi-temporal Pleiades imageries (2013–2015) to classify slums. Further, based on the classified slums, we calculate accuracies of the change detection and the temporal transferability according to TEM framework.
Object-based classification of slums
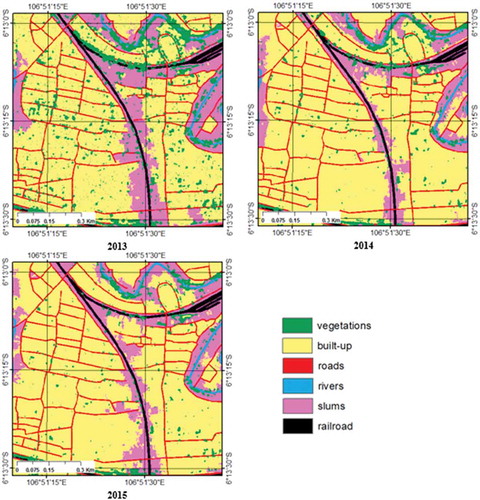
Following the steps in , we classified the image into six classes, i.e. vegetation, built-up, roads, river, slums and railroad. shows how slums change over the 3 years in the study area. In general, slums follow the railroad and river. In principle, slums are found at the same locations across the years but boundaries differ.
Figure 5. Slums detection using the OBIA ruleset, indicating changes of slums between 2013 and 2015 in subset area.
Change detection analysis
To conduct the post-processing change detection, first, the classification is reclassified () into binary images, reducing the number of classes from six to two classes. Thus we kept the slum class and merged the other classes as background class (), assigning a unique class value for each year.
Table 5. Classes from OBIA slum detection and their corresponding binary value for change detection analysis.
Second, the binary classification result from 2013 to 2015 is combined into a composite map (). Since we worked with three images and two classes (i.e. slum and non-slum), the possible trajectory combinations were two to the power of three, resulting in eight trajectories.
Figure 6. Change trajectory of slums based on the post-classification change detection, by calculating a binary map of slum and background between 2013 and 2015: (a) shows the change detection map; (b) shows the proportion between changes and no change, and the proportion of trajectory changes.
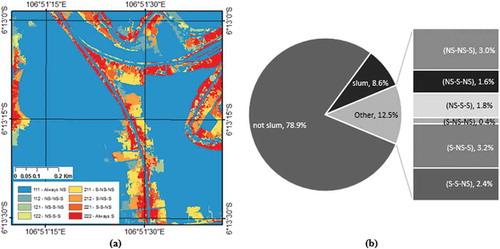
Following the new classification (), eight change trajectories were obtained (i.e. 111, 112, 121, 122, 211, 212, 221 and 222). For instance, a pixel labelled 111 means that the pixel remains classified as non-slum between 2013 and 2015. Meanwhile, a pixel labelled 121 means that this pixel was labelled as non-slum in 2013, changed into slum in 2014 and in 2015, this pixel changed again into non-slum. shows that most of the area did not change (87.5%). Among the various types of change trajectories, 212 has the highest percentage of change trajectory (3.2%), followed by 112, which is 3.0%. Based to the eight possible trajectories, the size of the area that improved and worsened can be determined. In the improved area, the slum status changed from a slum into non-slum (i.e. 211 and 221), this contributes to 22.6% of total changes. Meanwhile, for the worsened area, where the slum status changed from non-slum into slum contributes to 38.7% of total changes. Thus, considering the proportion of changes, results indicate more slum areas worsened than improved between 2013 and 2015.
Transferability measurements
By comparing the reference data and results from the post-classification change detection, we obtained the number of samples for each sub-group in TEM, as can be seen in .
Table 6. Total number and percentage of sample for each confusion groups in the trajectory error matrix (TEM).
In total, 74.3% of the samples were categorised as S1, where the samples were correctly detected as no change, having the correct land cover classification, followed by 15.3% as S4 where the image classification indicated a change but no change occurred on the ground. According to the results in , we measured the accuracy as mentioned in Equations (1) to (5) ().
Table 7. Accuracy of change detection.
For the overall trajectory accuracy (AT), we obtained the value of 74.7%, which means that 74.7% of the samples have a correct classification with a correct change trajectory. AT is lower than overall classification accuracy (OA), as in AT, the correctness of change trajectory is also considered. For the change/no change overall accuracy (AC/N), we obtained 83.7%, which is higher than AT. The reason for this is that in AC/N, we only consider the correctness of the change detection, without considering the correctness of the classification accuracies and the trajectory of changes. For instance, a point with incorrect classifications, as long as it is correctly detected a change, either from slum to non-slums, or vice versa. For the OAD, we obtained the value of 9.0%, which means that the value of AC/N is higher than AT. The high value of OAD indicates that although we have successfully determined the change and no-change status, some of the trajectories do not match with the reference data.
For ADICN we obtained 89.6%, which is higher than the five previous measurements that we employed (i.e. (1) to (5)). The value indicates that the majority of “no change” cases can be identified from the correct classification results. Meanwhile, for ADICC, we obtained 50%. It means that half of all change cases can be identified from the correct classification.
Discussion
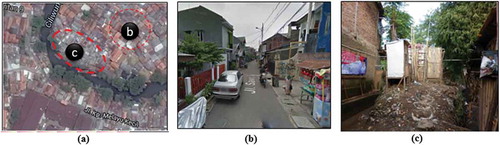
We have demonstrated the usage of our framework for measuring the temporal transferability of the employed OBIA ruleset for slum detection. The relatively low value of overall accuracy of trajectory (AT) indicates that our OBIA ruleset has a moderate-low transferability for measuring change detection. We argue that problems with the temporal transferability were caused by several reasons. First, the overall accuracy of classification obtained for individual images was low (i.e. 65% for 2015). However, similar accuracy levels have also been reported by other OBIA-based slum mapping studies (e.g. Hofmann et al., Citation2011; Kohli, Stein, & Sliuzas, Citation2016; Kuffer et al., Citation2014). The low accuracies could be due to difficulties in formulating crisp definition of slums that can be transferred to an OBIA ruleset. As shown in , local experts have different agreements on slum characteristics in the study area, which was also shown in recent studies by Kohli et al. (Citation2016) and Pratomo et al. (Citation2017). This causes uncertainties when generating reference data. For instance, many high-density areas that are detected in the images as slums cannot be categorised as slums on the ground (see, e.g. ). In addition, using morphological characteristics in imagery, it is difficult to precisely identify the boundaries between slum and non-slum areas, particularly in transition zones. Therefore, location based information are very important (Taubenböck, Kraff, & Wurm, Citation2018), which we included into our ruleset (e.g. proximity to river), improving the separability.
Figure 7. Settlements with similar morphological characteristics (a), i.e. unorganised layout and high density, have different characteristics on the ground. Here, (b) shows a settlement with basic facilities and durable housing materials, while (c) shows settlements without basic facilities and poor building materials.
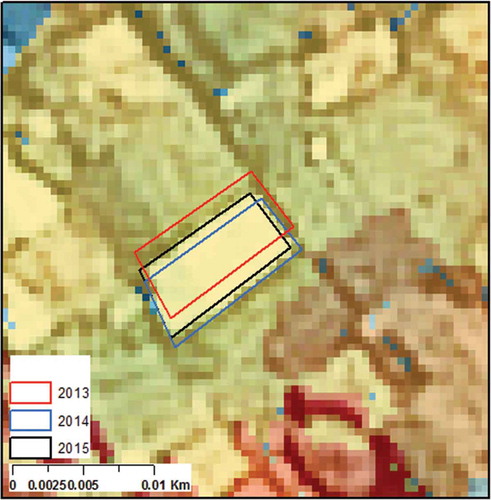
Second, since we conducted a change detection analysis employing a post-classification method, any error that has been made in the classification stage propagated in the change detection. The variations in the viewing angle of the multi-temporal images resulted in misclassification of changes as also indicated by Leichtle et al. (Citation2017). showed an example of an area that did not change on the ground but was detected as a change in the image.
Figure 8. Impact of different viewing angle on change detection (2013–2015), a similar object was shifting, which was detected as changes (2015 image as background).
Although the trajectory of overall accuracy (AT) indicates a moderate value (75%), the high value of ADICN shows that our OBIA ruleset has a relatively high transferability when applied to multi-temporal imageries. More than 84% of the samples with no change and change have been correctly classified.
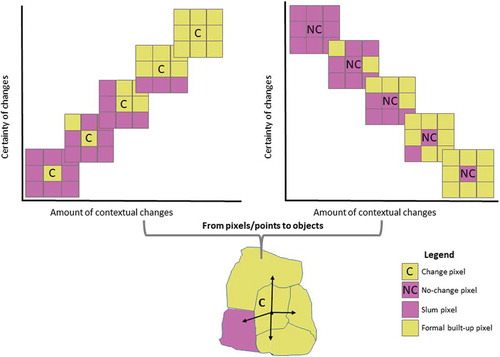
A fundamental limitation of the research is to base the assessment via the TEM on whether an individual point changed or not. This makes the assessment vulnerable to changes in imaging conditions (e.g. viewing angles, shading effects). In order to support monitoring of slum upgrading programmes, a more aggregated-contextual assessment would be required. Thus, in addition to a point, it would require to assess whether the neighbourhood (context) also confirm this change (). This would reduce a large amount of “noise” (e.g. caused by different viewing angles), and would improve the certainty that a location really changed. shows the relationship between amount of contextual change and certainty. For example, in the case of pixel, when all the surrounding pixels confirm this change the certainty of the change is high. While when none of the surrounding pixels changed, the certainty of the change is low. In case of objects, the topological relationship between change and neighbouring objects need to be assessed for analysing the certainty of the change. Thus, in order to inform policy development and indicate changes in a certain area, a sufficient contextual threshold needs to be defined. This would need to be combined with a decision what minimum context should be considered (e.g. direct neighbouring pixels/objects or are large context of a minimum change area).
Figure 9. Relation between certainty of change (of central pixel) and the amount of contextual change (neighbouring pixels).
In our study, we considered a relatively short time span of three years. This was considering the fast changes in the context of Jakarta where slum-related policies are being implemented to improve, or re-settle slum settlements. For further research, our method could be tested on other contexts to capture the changes over longer time spans.
Conclusions
Our study has developed a framework to quantify the temporal transferability of an OBIA ruleset by adopting the TEM. We demonstrated the usability of our framework by employing multi-temporal Pleiades imageries over 3 years (2013–2015). Two sources of uncertainties occurred, potentially causing a relatively low trajectory of the overall accuracy (AT). First, the fuzzy boundaries and definition of slums caused difficulties when generating reference data for slum and non-slum areas. The local context increased this problem as kampungs are informally developed and high-density areas but not necessarily slums. Second, variations in the viewing angle of the images led to misclassification of changes. These results demonstrate that a pixel-based accuracy assessment without including the neighbourhood (context) of the change produces a noisy change analysis. Therefore, further research should be done to quantify various sources of temporal uncertainties and adding a contextual certainty analysis. In the context of Indonesia, particularly in Jakarta, the government has set a target to achieve zero slums by 2019; this requires monitoring the implementation of such slum reduction policies. For this purpose, TEM is a suitable tool to quantify trajectory accuracies in multi-temporal VHR imageries. However, this would need to be combined with an assessment of the certainty of change. This would allow policymakers to be aware of the correctness of change trajectories and the certainty in measuring slum dynamics.
Acknowledgements
Multi-temporal Pleiades imagery that was used for this research was granted by the European Space Agency (ESA) for this research purpose.
Disclosure statement
No potential conflict of interest was reported by the authors.
References
- Anders, N.S., Seijmonsbergen, A.C., & Bouten, W. (2015). Rule set transferability for object-based feature extraction: An example for cirquemapping. Photogrammetric Engineering and Remote Sensing, 81(6), 507–514.
- Baatz, M., & Schäpe, A. (2000). Multiresolution segmentation – An optimization approach for high quality multi-scale image segmentation. In J. Strobl, T. Blaschke, & G. Griesebner (Eds.), Angewandte Geographische Informationsverarbeitung XII (pp. 12–23). Heidelberg: Wichmann-Verlag.
- Bouziani, M., Goita, K., & He, D.C. (2010). Rule-based classification of a very high resolution image in an urban environment using multispectral segmentation guided by cartographic data. IEEE Transactions on Geoscience and Remote Sensing, 48(8), 3198–3211.
- Centre on Housing Rights and Evictions. (2008). Women, slums and urbanization: Examining the causes and consequences. Geneva: COHRE Secretariat. Retrieved from http://globalinitiative-escr.org/wp-content/uploads/2013/05/women_slums_and_urbanisation_may_2008.pdf.
- Crews-Meyer, K.A. (2001). Assessing landscape change and population environment interactions via panel analysis. Geocarto International, 16(4), 71–82.
- Demographia. (2016). Demographia World Urban Areas (11th ed.). Demographia. Belleville. Retrieved from http://www.demographia.com/db-worldua.pdf .
- Drǎguţ, L., Tiede, D., & Levick, S.R. (2010). ESP: A tool to estimate scale parameter for multiresolution image segmentation of remotely sensed data. International Journal Geographic Information Sciences, 24(6), 859–871.
- Ebert, A., Kerle, N., & Stein, A. (2009). Urban social vulnerability assessment with physical proxies and spatial metrics derived from air- and spaceborne imagery and GIS data. Natural Hazards, 48(2), 275–294.
- Fox, J., Daly, A., Hess, S., & Miller, E. (2014). Temporal transferability of models of mode-destination choice for the Greater Toronto and Hamilton Area. Journal of Transport and Land Use, 7(2). doi:10.5198/jtlu.v7i2.701
- Groenendijk, E.M.C., & Dopheide, E.J.M. (2003). Planning and management tools. Enschede: ITC.
- Hamedianfar, A., & Shafri, H.Z.M. (2015). Detailed intra-urban mapping through transferable OBIA rule sets using WorldView-2 very-high-resolution satellite images. International Journal of Remote Sensing, 36(13), 3380–3396.
- Hofmann, P., Blaschke, T., & Strobl, J. (2011). Quantifying the robustness of fuzzy rule sets in object-based image analysis. International Journal of Remote Sensing, 32(22), 7359–7381.
- Hofmann, P., Strobl, J., Blaschke, T., & Kux, H. (2008). Detecting informal settlements from QuickBird data in Rio de Janeiro using an object based approach. In T. Blaschke, S. Lang, & G. Hay (Eds.), Object-based image analysis (pp. 531–553). Berlin\Heidelberg, Germany: Springer.
- Hussain, M., Chen, D., Cheng, A., Wei, H., & Stanley, D. (2013). Change detection from remotely sensed images: From pixel-based to object-based approaches. ISPRS Journal of Photogrammetry and Remote Sensing, 80, 91–106.
- Jain, S. (2007). Use of Ikonos satellite data to identify informal settlements in Dehradun, India. International Journal of Remote Sensing, 28(15), 3227–3233.
- Kim, D.J., Hensley, S., Yun, S.H., & Neumann, M. (2016). Detection of durable and permanent changes in urban areas using multitemporal polarimetric UAVSAR data. IEEE Geoscience and Remote Sensing Letters, 13(2), 267–271.
- Kit, O., & Lüdeke, M. (2013). Automated detection of slum area change in Hyderabad, India using multitemporal satellite imagery. ISPRS Journal of Photogrammetry and Remote Sensing, 83, 130–137.
- Kohli, D., Sliuzas, R.V., Kerle, N., & Stein, A. (2012). An ontology of slums for image-based classification. Computers Environment and Urban Systems, 36(2), 154–163.
- Kohli, D., Stein, A., & Sliuzas, R. (2016). Uncertainty analysis for image interpretations of urban slums. Computers Environment and Urban Systems, 60, 37–49.
- Kohli, D., Warwadekar, P., Kerle, N., Sliuzas, R., & Stein, A. (2013). Transferability of object-oriented image analysis methods for slum identification. Remote Sensing, 5(9), 4209–4228.
- Kuffer, M., Barros, J., & Sliuzas, R. (2014). The development of a morphological unplanned settlement index using very-high-resolution (VHR) imagery. Computers Environment and Urban Systems, 48, 138–152.
- Kuffer, M., Pfeffer, K., & Sliuzas, R. (2016). Slums from space—15 years of slum mapping using remote sensing. Remote Sensing, 8(6), 455.
- Leichtle, T., Geiß, C., Wurm, M., Lakes, T., & Taubenböck, H. (2017). Unsupervised change detection in VHR remote sensing imagery – An object-based clustering approach in a dynamic urban environment. International Journal of Applied Earth Observation and Geoinformation, 54, 15–27.
- Leonita, G. (2018). Evaluating the Performance of Machine Learning for Slum Mapping using Very High-Resolution Imagery. The case of Bandung City, Indonesia. Unpublished MSc. Thesis. University of Twente, The Netherlands.
- Li, B., & Zhou, Q. (2009). Accuracy assessment on multi‐temporal land‐cover change detection using a trajectory error matrix. International Journal of Remote Sensing, 30(5), 1283–1296.
- Macleod, R.D., & Congalton, R.G. (1998). Quantitative comparison of change-detection algorithms for monitoring eelgrass from remotely sensed data. Photogrammetric Engineering and Remote Sensing, 64(3), 207–216.
- Mas, J.F. (1999). Monitoring land-cover changes: A comparison of change detection techniques. International Journal of Remote Sensing, 20(1), 139–152.
- Mertens, B., & Lambin, E.F. (2000). Land cover change trajectories in southern Cameroon. Annals of the Association of American Geographers, 90(3), 467–494.
- Ministry of Public Works and Housing (Kemen PUPR). (2016). City Without Slum (Kotaku) Program Guide. Jakarta, Indonesia: Ministry of Public Work and Public Housing. Retrieved from https://kotaku.pu.go.id/pustaka/files/170524_materi_rakor_slum_allevation_2017/MATERI DUKUNG KOTAKU/02. Petunjuk Pelaksanaan KOTAKU Tingkat Kota.pdf
- Netzband, M. (2010). Remote sensing for the mapping of urban poverty and slum areas. Panel contribution to the Population-Environment Research Network Cyberseminar,“What are the remote sensing data needs of the population-environment research community?” Retrieved from http://www.populationenvironmentresearch.org/papers/Netzband_PERN_statement.pdf
- Ooi, G.L., & Phua, K.H. (2007). Urbanization and slum formation. Journal of Urban Health: Bulletin of the New York Academy of Medicine, 84(Suppl 1), 27–34.
- Patel, A., Crooks, A., & Koizumi, N. (2012). Simulating spatio-temporal dynamics of slum formation in Ahmedabad, India. Retrieved from http://siteresources.worldbank.org/INTURBANDEVELOPMENT/Resources/336387-1369969101352/Patel-et-al.pdf
- Petit, C., Scudder, T., & Lambin, E. (2001). Quantifying processes of land-cover change by remote sensing: Resettlement and rapid land-cover changes in south-eastern Zambia. International Journal of Remote Sensing, 22(17), 3435–3456.
- Pratomo, J., Kuffer, M., Martinez, J., & Kohli, D. (2017). Coupling uncertainties with accuracy assessment in object-based slum detections, case study: Jakarta, Indonesia. Remote Sensing, 9(11), 1164.
- Rukmana, D. (2008). Planning the Megacity: Jakarta in the twentieth century. Journal of the American Planning Association, 74(2), 263–264.
- Shoko, M., & Smit, J. (2013). Use of agent based modelling in the dynamics of slum growth. South African Journal of Geomatics, 2(1), 54–67.
- Sihombing, A. (2007). Living in the Kampung : A firsthand account of experiences in Jakarta ’ s Kampungs. Journal of Postgraduate Studies in Architecture, Planning and Landscape, 7(1), 15–22.
- Sihombing, A. (2014). Drawing Kampung through cognitive maps case study: Jakarta. APCBEE Procedia, 9, 347–353.
- Taubenböck, H., Kraff, N.J., & Wurm, M. (2018). The morphology of the arrival city - A global categorization based on literature surveys and remotely sensed data. Applications Geographic, 92, 150–167.
- Tiede, D., Lang, S., Hölbling, D., & Füreder, P. (2010). Transferability of OBIA rulesets for IDP camp analysis in Darfur. Paper presented at the GEOBIA 2010, Ghent, Belgium.
- Trimble Germany GmbH. (2015). User guide - eCognition ® developer (9.1.1). Munich, Germany: Trimble.
- UN-Habitat. (2009). Urban indicators guidelines - “Better Information, Better Cities”: Monitoring the habitat agenda and the millennium development goals-slum target. Nairobi, Kenya. Retrieved from https://www.ine.pt/ngt_server/attachfileu.jsp?look_parentBoui=143216309&att_display=n&att_download=y
- UN-Habitat. (2014). Indonesia prepares national report for habitat III. Nairobi, Kenya. Retrieved from http://unhabitat.org/indonesia-prepares-national-report-for-habitat-iii/
- United Nations. (2014). Sustainable development goals open working group proposal for sustainable development goals. Retrieved from http://undocs.org/A/68/970
- Zhou, W., Troy, A., & Grove, M. (2008). Object-based land cover classification and change analysis in the Baltimore metropolitan area using multitemporal high resolution remote sensing data. Sensors, 8(3), 1613–1636.