
ABSTRACT
In conversation, speech planning can overlap with listening to the interlocutor. It has been postulated that once there is enough information to formulate a response, planning is initiated and the response is maintained in working memory. Concurrently, the auditory input is monitored for the turn end such that responses can be launched promptly. In three EEG experiments, we aimed to identify the neural signature of phonological planning and monitoring by comparing delayed responding to not responding (reading aloud, repetition and lexical decision). These comparisons consistently resulted in a sustained positivity and beta power reduction over posterior regions. We argue that these effects reflect attention to the sequence end. Phonological planning and maintenance were not detected in the neural signature even though it is highly likely these were taking place. This suggests that EEG must be used cautiously to identify response planning when the neural signal is overridden by attention effects.
Introduction
In conversation, turns from one speaker to the next happen in rapid succession. This simple finding points to a complicated set of underlying psychological processes. A corpus study by Stivers et al. (Citation2009) showed that turn gaps are often as short as 200 ms. Yet from decades of research on language production, we know that even the production of a single word takes 600 ms on average (Indefrey & Levelt, Citation2004). Taken together, these two findings suggest that in a conversation, planning for production by the second speaker is already taking place while the first speaker is still talking. Experimental evidence in favour of this idea comes from studies that manipulated when critical information necessary to respond, the cue to the answer, became available, either early in the sentence or late (Barthel, Sauppe, Levinson, & Meyer, Citation2016; Bögels, Casillas, & Levinson, Citation2018; Bögels, Magyari, & Levinson, Citation2015). For instance, Bögels et al. (Citation2015) compared “Which character, also called 007, appears in the famous movies” to “Which character from the famous movie is also called 007”. In both sentences the cue “007” is the critical information necessary to start preparing the correct answer “James Bond”. Responses were initiated earlier following sentences with early versus late cues, showing that some production planning was already completed during comprehension of the interlocutor’s utterance. Levinson and Torreira (Citation2015) propose that speaker B will start to plan his or her utterance as soon as possible during the unfolding of speaker A's utterance.
The psycholinguistic model of typical turn-taking proposed by Levinson and Torreira (Citation2015) has several processing components. First, upcoming speakers begin to plan their utterance as soon as there is enough information to do so. Second, while the response is being planned, the incoming speech is continued to be monitored for syntactic and prosodic cues indicating the upcoming turn end. Third, when the turn end is thought to be imminent, articulation of the pre-planned response is initiated. Overt speech then follows promptly, resulting in the short gaps between speakers. In this model, the response is thought to be planned down to the phonological level. Word production consists of several planning stages (Caramazza, Citation1997; Dell, Citation1986; Levelt, Roelofs, & Meyer, Citation1999): conceptual preparation (message encoding), lemma retrieval (meaning and syntax representation of a word), phonological encoding (sound representation of a word), and phonetic encoding (articulatory targets). The early planning hypothesis postulates that production planning can proceed through all stages during an interlocutor’s turn, at least in the most frequent turn-taking scenarios.
To substantiate the early planning hypothesis, it must be shown that, while listening to an interlocutor, (1) planning for production is initiated, (2) response planning proceeds to and includes phonological encoding, (3) the response is maintained until the interlocutor’s turn end and (4) monitoring for the turn end occurs to quickly launch articulation. One method that could be useful in identifying these processes is electroencephalography (EEG). The aim of the present study was to test whether EEG can separate the planning and maintenance of a phonological code from the attention to the cue to speak. Only if EEG can reliably identify response planning on the one hand and attention to turn end on the other hand, this neural signature can be sought in conversational settings to test whether early planning indeed occurs. In other words, we did not aim to validate or refute the early planning hypothesis; instead we investigated whether EEG is a good method to identify one or several of the processing streams suggested by the early planning hypothesis. Later studies could use EEG to assess the early planning hypothesis.
In essence, we are interested in the processes involved in delayed responding. Using EEG during a picture naming task, Laganaro and Perret (Citation2011) showed that the initial processes of delayed naming until 350 ms after picture onset were highly similar to immediate naming evident from both waveform and topographical analyses. However, the age of acquisition of the picture names only modulated amplitudes in the phonological encoding time-window for immediate and not delayed naming, suggesting the processes including and following phonological encoding differed between these conditions. Somewhat relatedly, Eulitz, Hauk, and Cohen (Citation2000) compared overt and covert immediate naming to passive viewing of pictures. The waveforms started to differentiate between the naming conditions and passive viewing after 275 ms, whereas overt and covert naming diverged after 400 ms. The authors argued that all conditions entailed object recognition, but only for the naming tasks the additional process of phonological encoding was required, indexed by the more positive-going waveform. Thus, delayed naming has been compared to immediate naming, and immediate naming has been compared to a passive condition, but delayed naming has never been compared to a passive condition. This is the focus of the current study: how is delayed responding different from no response preparation, and which aspects of delayed responding are reflected in the neural signal?
In two EEG studies by Bögels et al. (Citation2015, Citation2018) participants answered questions in a quiz paradigm where responses could be prepared early versus late (i.e. “Which character, also called 007, appears in the famous movies”). Bögels et al. found that, in the early cue condition, very quickly after the cue was heard, the brain reacted differently than to words in comparable sentence positions that did not allow for production planning to be initiated. The authors found a late positive ERP component starting 500 ms after the cue. They argued that this resembled the positivity found after 275 ms for both overt and covert immediate naming as compared to passive viewing in Eulitz et al. (Citation2000). This positivity may therefore reflect the presence of phonological processing, as suggested by Eulitz et al. Furthermore, Bögels and colleagues localised this positivity effect to the middle and superior temporal gyrus (MTG/STG) and the inferior frontal gyrus (IFG), areas previously found to be involved in language production (Indefrey, Citation2011; Indefrey & Levelt, Citation2004). Specifically, MTG activation is linked to lemma retrieval, STG to word form retrieval, and the IFG to phonological encoding. This led the authors to conclude that planning progressed up to and including phonological encoding.
However, a similar late positivity was found by Laganaro and Perret (Citation2011) in the study described above. They showed a positivity for delayed naming when compared to immediate naming 350 ms after picture onset, which they interpreted as a divergence in processing at the start of phonological encoding based on timing information from previous production studies (Indefrey, Citation2011; Indefrey & Levelt, Citation2004). This was corroborated by a lack of an AoA effect in the waveform of the delayed naming condition. The authors argued that the process of phonological encoding takes longer or is not completed in delayed naming, but more importantly that full phonological and phonetic encoding processes can only be tracked with immediate naming and not delayed naming. This suggests that late positivities found for delayed naming in previous studies might not reflect complete phonological encoding but could instead index early stages of response planning or other processes such as working memory or attention. Moreover, it is difficult to draw strong conclusions from source localisation of the EEG signal, as the spatial resolution is often relatively poor (e.g. Acar & Makeig, Citation2013). Finally, the same areas identified by Bögels et al. have been implicated in speech processing as well (Hickok & Poeppel, Citation2007). It is therefore not a trivial task to disentangle comprehension and production when they, as hypothesised, occur simultaneously.
Besides the late positivity, evidence for the early planning hypothesis came from oscillatory activity, which when measured over the scalp reflects the synchronised rhythmic activity of a large population of neurons (Pfurtscheller & Lopes da Silva Citation1999). Bögels et al. (Citation2015, Citation2018) measured oscillatory power at the onset of the critical information in the early condition compared to that same time-point in the late condition. A reduction in power was found in parietal/occipital and posterior brain regions in the alpha range (8–14 Hz, both studies) and also in the beta range (16–20 Hz, 2018 study), which the authors interpreted as an attentional shift from listening to the auditory input to preparation of the answer.
A similar power reduction was found by Piai, Roelofs, Rommers, Dahlslätt, and Maris (Citation2015) in a delayed speech experiment and they argued that the power reduction reflected attention to the incoming input. Piai et al. (Citation2015) showed participants series of five non-words, with the fourth or fifth being pronounceable. Participants were instructed to read aloud the pronounceable non-word, but only after the fifth non-word was shown. Thus, speech had to be withheld (pronounceable fourth non-word) or speech was immediate (pronounceable fifth non-word). In the withhold condition as compared to the immediate condition, alpha-beta power (12–30 Hz) decreased over occipital regions. Alpha power decreases over visual regions have previously been linked to better performance on visual perception tasks (Jensen & Mazaheri, Citation2010). In the paradigm of Piai et al., the power decrease was therefore thought to reflect heightened attention to the fifth stimulus, which signalled to the participants to initiate speech (i.e. the go-stimulus). Thus the electrophysiological signal is not reflecting a general attention effect to the final stimulus as this would be necessary in both conditions. Instead it reflects a specific attentional effect rendering the system to be maximally sensitive to the end of the sequence to launch articulation of the prepared response, independent of what the final stimulus may be.
Instead of reflecting an attentional shift from listening to production planning, the posterior power decreases could reflect monitoring for the end of the sequence. Such monitoring is argued to happen continuously in conversation, when listening to one's interlocutor. It has been shown in several studies that turn ends in naturalistic conversations can be predicted by using content information and/or turn-final prosodic cues such as intonation (Bögels & Torreira, Citation2015; De Ruiter, Mitterer, & Enfield, Citation2006; Gravano & Hirschberg, Citation2011). This prediction seems to rely on different cues in the incoming auditory stream than planning a response. For instance, Corps, Crossley, Gambi, and Pickering (Citation2018) showed that content predictability, even when it allowed for accurate prediction of word length and consequently sentence end, was only used for preparing a response but not for predicting turn end.
All in all, very similar electrophysiological signatures have been found and interpreted in different ways, either as evidence for planning for production, working memory or attention processes. In this paper we wish to get a better understanding of the link between the EEG signal and the specific processing streams of the early planning hypothesis. It is important to note that we do not wish to claim that no response planning has taken place in the studies by Bögels et al. (Citation2015, Citation2018). Clearly, some planning has taken place as response latencies were shorter in their early planning condition compared to the late planning condition. Rather, we intended to test whether this type of response planning is reflected in the EEG signal, up to and including phonological encoding, or whether a different process of the early planning hypothesis is indexed more dominantly instead. To reiterate, several processes are hypothesised to be involved in delayed responding in a conversation: (1) production planning is initiated, (2) planning proceeds to and includes phonological encoding, (3) the response is maintained until the interlocutor’s turn end and (4) monitoring for the turn end occurs to timely launch articulation. Here we wish to find out whether EEG can detect one or more of these processes in a simple delayed responding paradigm in the absence of heard speech.
In order to do so, we first replicated (Experiment 1) and then adapted (Experiment 2) the paradigm by Piai et al. (Citation2015), using EEG instead of MEG. In this paradigm only phonological planning is taking place, and the response has to be withheld. The optimal strategy for participants is to proceed to the stage of phonological encoding and launch articulation on appearance of the go-stimulus. In the first experiment we tested whether we could find the previously reported effects, a sustained positivity and reduction in power. The aim of the second experiment was to test if we could separate response planning from attentional effects and map each of these onto a neural signal. Finally, in Experiment 3 we repeated Experiment 2 but instead of a vocal response, participants were required to make a manual response. The EEG signal should be different for Experiment 2 and 3 if it can distinguish speech planning from manual response planning. Our goal was to provide a better understanding of the neural signature of withholding a vocal response till turn end so that this neural signature can be used to identify response planning and monitoring of sentence end in more conversation-like studies.
Experiment 1
We replicated Piai et al. (Citation2015) to test whether their paradigm shows consistent results over studies. Participants were presented with five non-words in succession, with the fourth or fifth being pronounceable (see ). They were instructed to read aloud the pronounceable non-word, but only after the fifth non-word was shown. Thus, speech had to be withheld (pronounceable fourth non-word) or speech was immediate (pronounceable fifth non-word). In the current paradigm we can be fairly certain that processing reflects phonological encoding, as pseudowords do not have a concept or lemma associated with them that can be maintained in memory. In other words, the early processes involved in speech production will not take place, only phonological encoding is necessary. In the withhold condition, it seems optimal to plan the phonological code of this pseudoword and keep this in working memory until the go-stimulus is presented.
Figure 1. An example of a withhold trial (top) and a passive trial (bottom) in Experiment 1. Figure adapted from Piai et al. (Citation2015).
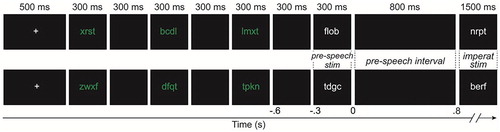
The EEG signal in the 800 ms time-window between the fourth and fifth non-word was compared between the two conditions (i.e. the “pre-speech interval” in ). Henceforth the conditions will be referred to as the withhold condition (pronounceable fourth non-word, speech must be withheld during the pre-speech interval) and the passive condition (pronounceable fifth non-word, no planning during pre-speech interval). Note that for both conditions a blank screen was presented, so the conditions differ only in whether the participants can plan their response or not during this time. We expected to replicate the posterior power desynchronisation found previously when comparing the withhold versus passive condition. Here we used EEG instead of MEG, but the effect and its distribution should be similar (albeit more widespread as the EEG signal is less focal over the scalp than the MEG signal). We predict the power effect to be in the alpha and/or beta band. As mentioned previously, Bögels et al. found their desynchronisation effect to span 8–14 Hz in both studies and also 16–20 Hz in the second study, whereas Piai et al. found the range 12–30 Hz. Both studies used cluster-based permutation tests, and so did we. Whereas this technique elegantly deals with the multiple comparison problem of high-dimensional data, it only allows for testing for the existence of a significant difference. Any information about the cluster, such as timing, frequency range, and location, is only descriptive (Maris & Oostenveld, Citation2007; Sassenhagen & Draschkow, Citation2019). A cluster found in the alpha band does not entail that this cluster is only, or primarily, in the alpha band. Thus the three clusters found for slightly different frequency ranges may very well reflect the same effect, and in which specific frequency range we will find an effect is unclear.
In the study by Piai et al. (Citation2015) not only the posterior decrease in alpha-beta power effect was found but also a frontal beta power increase. This frontal beta synchronisation was thought to reflect the maintenance of the current cognitive set, following the proposal by Engel and Fries (Citation2010). In the withhold paradigm, the synchronisation would reflect maintaining the goal of preparing speech but only producing it once the go-stimulus is presented.
Methods
Participants
Twenty-three native speakers of Dutch participated in the experiment. Three datasets were excluded: for one subject the signal was not recorded for the initial block and for two subjects the signal was very noisy. For the remaining twenty subjects (nine male) the mean age was 22 years. All participants were right-handed and had normal or corrected-to-normal vision. Participants provided written informed consent and were paid for taking part in the study. Ethical approval was granted by the Ethics Board of the Faculty of Social Sciences of the Radboud University, Nijmegen.
Materials and design
Materials and design were identical to Piai et al. (Citation2015), for details on stimuli and list creation please refer to their methods section. Pairs of 204 pronounceable pseudowords and unpronounceable consonant strings, of four to six characters matched pairwise, were presented to participants. Half of the pairs were shown in the withhold condition (e.g. oesar – wppvb), the other half in the passive condition (e.g. rhpk – vego), counterbalanced across participants. At most five consecutive trials of one same condition were presented. Each pair was preceded by three consonant strings.
Procedure
Participants were tested individually in a soundproof and electrically shielded room. Each trial consisted of a sequence of five strings, presented one at a time in the middle of the screen. Four of the five strings consisted only of consonants and were therefore unpronounceable. One of the strings was a pseudoword and participants were instructed to read aloud this pseudoword when the final string of the sequence was presented. The pseudoword could be presented in the fourth position and therefore speech had to be withheld until the next string was presented: the withhold condition. The pseudoword could also be shown in the fifth position and thus no planning took place during the pre-speech interval between the fourth and fifth stimulus: the passive condition. The stimulus presented in the fourth position will be referred to as the pre-speech stimulus and the stimulus presented in fifth position as the imperative stimulus.
Stimuli were presented using Presentation software (Neurobehavioral Systems) in Arial font size 20 on a black background. See for the trial structure including timing information. Not depicted is the final screen that showed five hashtags for two seconds, indicating to the participants they could blink. Participants were first presented with 15 practice trials. The experimental trials were divided into four blocks of 51 trials each, with self-paced breaks in between.
Apparatus
The EEG cap contained 59 active electrodes in an equidistant layout. In addition, one electrode was attached below the left eye to monitor for blinks, and two electrodes were directly placed on the left and right mastoids. All electrodes were online referenced to the left mastoid. The impedance was kept below 10 kΩ for all electrodes. The EEG was digitised at a rate of 600 Hz, and recorded with a low cut-off filter of 0.01 Hz and a high cut-off filter of 300 Hz.
Behavioural analysis
Vocal responses were recorded by a microphone (Sennheiser ME64). Errors were coded online. They included wrong pronunciation and speech initiation before the presentation of the imperative stimulus. RTs for correct trials were determined manually using the programme Praat, measured from the onset of the fifth word (Boersma & Weenink, Citation2012). RTs below 150 ms were removed from the analyses. RTs were analysed using linear mixed effects models using the lme4 package (Bates, Maechler, & Bolker, Citation2013) in R (R Core Team, Citation2012). The full model included condition as a fixed effect, and participant and stimulus pair as random effects. For participant, the slope for condition was added. To determine whether the effect of condition was significant, the model with condition was compared to a model without the fixed effect using a likelihood ratio test.
EEG preprocessing
Pre-processing and analyses were performed using the FieldTrip toolbox (Oostenveld, Fries, Maris, & Schoffelen, Citation2011) in Matlab (R2016q; Mathworks, Inc.). The EEG signal was detrended and a low pass filter of 80 Hz was applied. The data were re-referenced to the average of the left and right mastoid electrodes. Epochs were created time-locked to the pre-speech interval, our interval of interest, from 600 ms before the pre-speech interval (i.e. the onset of the blank screen prior to presentation of the pre-speech stimulus) until 1100 ms after this interval (see for the relevant time points). Incorrect trials and trials with RTs below 150 ms were removed. All epochs were visually inspected for artifacts and noisy trials were removed. On average, 82 out of 102 trials (80%) remained per condition.
EEG data analyses
The time-window of interest was the pre-speech interval where a response could be planned in the withhold condition but not in the passive condition. This corresponded to the window from 0 to 800 ms for each EEG epoch, which was the blank screen between the fourth and fifth stimuli in each trial, see . To allow for comparison both with Bögels et al. (Citation2015) and Piai et al. (Citation2015) three analyses were performed: ERPs and time-resolved spectra as done by Bögels and colleagues and time-averaged spectra as in the Piai et al. study. Analyses were closely matched to these original papers, but we followed Piai et al. rather than Bögels et al. in choosing the time-window of interest for all analyses. As mentioned, we analysed the pre-speech interval, whereas Bögels et al. started their analyses earlier, namely at the onset of the critical stimulus. In our paradigm this would be the start of presentation of the fourth non-word, from −300 ms in . We were not interested in the processing of the stimulus itself, but in response planning and maintenance, which is mainly captured by the pre-speech interval. For each of these three analyses, non-parametric cluster-based permutation tests were performed (Maris & Oostenveld, Citation2007). Cluster-based permutation tests control the family-wise error rate solving the multiple comparison problems inherent to high-dimensional data like EEG. Paired t-tests were performed for each channel, time-point and/or frequency. Only significant t-tests were kept and all t-values within a cluster (neighbouring points in any dimension) were summed. Then, 1000 times, samples were randomly assigned to one of the two conditions and cluster statistics were calculated in the same manner as above. Finally, the observed cluster statistics were compared to those of the random permutations. An observed cluster was taken to be significant when it fell in the 2.5th percentile of the permutation statistic distribution. For the following analyses, all parameters used were the default setting of Fieldtrip unless stated otherwise.
Event-related potentials (ERPs) were obtained by averaging trials in the time domain, separately for each condition and each participant. Amplitudes were compared for each time-point and channel to test for significant clusters.
In addition, following Piai et al. (Citation2015), the time-averaged power over the pre-speech interval was calculated using multitapers based on discrete prolate spheroidal sequences. Then the Fourier transform was taken from the tapered signal. Power, for each trial separately, was estimated between 8 and 30 Hz with 1 Hz spectral smoothing. Then power was averaged over trials for each condition, for each participant. We tested for significant clusters for power in the frequency and spatial dimensions.
Finally, time-resolved spectra analyses were performed, following Bögels et al. (Citation2015). The time-window of interest was elongated by 200 ms on each side (−200 ms to 1000 ms time-locked to the pre-speech interval) to enable power estimation at the edges of the window of interest (−800–0 ms). Cluster-based permutation tests were performed only for the 800 ms of interest. For each participant, single-trial time–frequency representations of power were computed using a sliding window of 250 ms tapered with a single Hanning taper, followed by the Fourier transform of the tapered signal. Power estimates were obtained separately for each electrode from 8 to 30 Hz in frequency steps of 1 Hz, and in time steps of 25 ms.
Results
For RTs, the model with condition included as fixed effect (ß = −152, SE = 23, t = −6.58) was the best fitting model as dropping condition resulted in worse fit (χ2(1) = 24.18, p < .001). As expected, responses were faster in the withhold condition (M = 695 ms, SD = 265) than in the passive condition (M = 846, SD = 227).
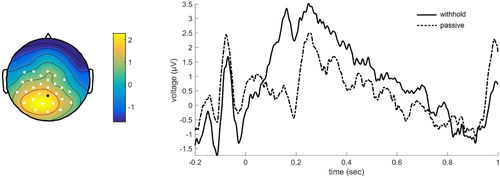
For the ERP results, three significant clusters were found. Over posterior regions, three clusters were found indicating positive deflections for the withhold condition compared to the passive condition: first cluster, p = .008, most prominent deflections in the time-window 0.08–0.24 sec, second cluster, p = .024, most prominent deflections in the time window 0.26–0.45 sec, and third cluster, p = .026, most prominent deflections between 0.59 and 0.80 sec. All in all, this suggests a sustained positivity over posterior regions when speech is withheld compared to no response preparation (see ).
Figure 2. Grand average event-related potentials for the electrode indicated in black. Positivity plotted upwards. The topographical plot is shown for the largest cluster, time-window 0.08–0.24 sec, with electrodes showing a significant effect shown in white.
The time-averaged spectra analysis revealed two significant clusters of power decreases for the withhold condition compared to the passive condition, p = .004 and p = .036. The power decreases were most prominent over posterior regions, for the frequency ranges 15–24 Hz and 25–27 Hz. In other words, the effect appeared in the beta range.
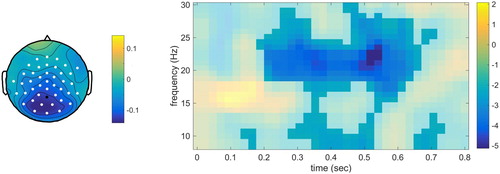
Finally, one significant cluster was found for the time-resolved spectra (p = .002). This was a large cluster in all three dimensions, see . For the withhold condition compared to the passive condition, a power decrease was evident. This seemed to be present for nearly the whole time-window and a large range of frequencies concentrated around the beta range.
Figure 3. Time-frequency results for the electrode indicated in black. The intensity indicates t-values. Time-frequency points associated with the significant cluster are highlighted. The topographical plot is shown for the time-window 0.20–0.60 sec and frequency range 15–27 Hz.
Discussion
When speech was prepared but withheld, several posterior effects were found when compared to a condition without response preparation. First, a sustained positivity was evident in the ERPs for virtually the entire time-window. Second, beta power was reduced. This beta desynchronisation also seemed to hold for the entire time that speech was withheld. This revealed very similar patterns as found in the previous turn-taking studies by Bögels et al. (Citation2015, Citation2018). We only partly replicated Piai et al. (Citation2015) as the posterior power desynchronisation was found but not the frontal beta synchronisation. It is possible that the frontal effect is less stable than the posterior effect and disappeared in a different sample or could not be reliably detected with EEG as opposed to MEG. For the present purposes, however, it is most important that we replicated the posterior effect as this is also the effect found in the turn-taking studies.
It must be noted that the response times were relatively long compared to response times typically seen in word reading studies which are often around 600 ms (i.e. Coltheart & Rastle, Citation1994; Zevin & Seidenberg, Citation2004). We think that the task set in our study was more complex than in typical designs because participants did not just read aloud any stimulus they were presented with, but had to decide which of the five strings to pronounce and had to time it with the presentation of the final stimulus. Furthermore, the EEG setting may have led to overall slower responding, for instance due to participants trying not to blink during the trial.
Importantly, this first experiment showed that our basic paradigm, where speech planning is initiated and withheld, reveals very similar results as the multifaceted question-answering paradigms used to investigate turn-taking. In other words, even when delayed responding is studied in isolation, without concurrent listening, the EEG signature reveals a sustained positivity and posterior beta desynchronisation. It is still unclear however if these two effects reflect response planning, response maintenance, and/or attention to the cue to speak. Experiment 2 aimed to test if the positivity and/or the power decreases could be linked to one of these processes.
Experiment 2
To tease apart response planning and maintenance from attention to the cue to speak, we adapted the withhold paradigm to not only present visual sequences but also auditory sequences. In addition, we now presented real words and pronounceable non-words, or pseudowords henceforth. Participants were asked to say the words aloud. If the posterior effects reflect response planning and maintenance, the findings should be identical for both the visual and auditory version of the paradigm. The low-level processing of the stimulus will be different as this will require modality specific routes. Importantly, this processing takes place in the pre-speech stimulus time-window only, and this is the same for the withhold and passive condition. As soon as the decision is made that the stimulus is a word or not, the withhold and passive condition will start to deviate: for pseudowords processing can stop, but for words a response needs to be prepared. This is what is measured in the critical time-window, the pre-speech interval. We argue that this response planning is independent of the modality the word was presented in, as the output will be identical, namely overt speech. Retrieving and maintenance of the phonological code should be identical, and therefore if the EEG signal reflects these processes, the ERP positivity and power reduction should be identical for both the auditory and visual version of the withhold paradigm.
If, however, the posterior effects reflect increased sensitivity to the final, imperative stimulus, results should differ depending on the modality of the incoming input. In the visual version, we should find a posterior effect as in Experiment 1, originating from the visual cortex (Piai et al., Citation2015). This effect should shift towards the auditory cortex when attention is heightened to an incoming auditory stimulus (Mazaheri et al., Citation2014). As mentioned in the general introduction, scalp EEG has poor spatial resolution. It remains difficult to precisely localise an effect due to the inverse problem: there is an infinite set of possible cortical sources that can explain a particular data pattern at the sensor level. What is possible however is to test whether two effects have the same or different topographies using angle tests (Tian & Huber, Citation2008). Angle tests allow for comparing the similarity of spatial patterns to determine whether the distribution of neural sources is different. Importantly, this technique does not require selection of a subset of electrodes, nor does it require averaging over participants, or mapping each brain onto a canonical brain. Instead, responses across all channels are compared between two conditions, for each individual separately. Here we test whether the withhold-passive effect is driven by similar or different neural sources for the two modalities. In the present study, identifying the two topographies as the same or different is enough to shed light on the functional interpretation of the posterior effects.
To be able to create an auditory version, the paradigm from Piai et al. (Citation2015) had to be adapted as unpronounceable nonwords could not be presented auditorily. Instead, participants were presented with one pseudoword and one existing word. The word should be read aloud (visual version) or repeated (auditory version), but only at the end of the trial. The pseudoword should be ignored. In the passive condition, participants could immediately pronounce the word after seeing or hearing the word (pseudoword presented first, the word second). In the withhold condition, participants needed to withhold their response until seeing or hearing the pseudoword (word presented first, pseudoword second). Participants performed both the visual and auditory experiment. Thus, in the pre-speech interval between the first and second stimulus, the two conditions differed in whether a response could be planned (withhold) or not (passive).
Methods
Participants
Twenty-nine young adults participated, with the same criteria as in Experiment 1. Five datasets were excluded: four due to excessive blinking and one due to missing recordings for one block. This left 24 participants (six male) with a mean age of 22 years.
Materials and design
Four lists of fifty pseudoword and word pairs were created. For each pair, the word and pseudoword consisted of the same number of letters, phonemes and syllables. The four lists, on average, were matched on number of letters, phonemes, and syllables. Furthermore, the ratio of concrete versus abstract words was kept constant. Finally, words were matched for semantic category, initial phoneme, and word frequency. For the auditory part of the experiment, all stimuli were recorded by a male speaker of Dutch. The (pseudo)words were spoken with neutral intonation. The sound files were normalised to ensure similar intensity for all stimuli.
For each participant, two lists were used in the visual modality and the other two in the auditory modality. Of the two lists in each modality, the words of one list appeared in the first position and the words of list two appeared in the second position. Which lists appeared in which modality and position was counterbalanced across participants. Modality was blocked: half of the participants started with the visual modality lists and the other half with the auditory modality lists. Within modalities, the pseudoword and word pairs were presented pseudorandomly with no more than five trials of one condition appearing consecutively.
Procedure
The procedure was similar to that of the previous experiment but now a trial only consisted of a sequence of two strings, a pseudoword and a word. Participants were asked to read aloud or repeat the word at the end of the sequence. The word could be presented in the first position and speech had to be withheld until the next string was presented: the withhold condition. The word could also be presented in the second position and should be read aloud instantly: the passive condition. The stimulus in the first position is referred to as the pre-speech stimulus, and the stimulus in second position as the imperative stimulus.
For a depiction of the trial structure see . Presentation duration of the (pseudo)words differed for each trial as the recording length was different for each stimulus. Presentation duration of the visual stimulus was identical to the duration of that specific word in the auditory modality (average duration 665 ms). Each trial was followed by a two-second blink screen. The 200 experimental trials were divided in four blocks with self-paced breaks in between. Fifteen practice trials preceded each half, in the modality that would be presented next.
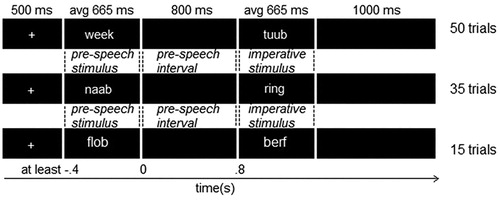
Figure 4. An example of a withhold trial (top), a passive trial (middle), and a no-response trial (bottom) in the visual modality. Experiment 2 only included the withhold and passive condition, Experiment 3 included all three conditions. In the auditory modality, the (pseudo)words were played over speakers and a fixation cross was presented on the screen.
Apparatus
The apparatus was identical to Experiment 1.
Behavioural analysis
Analysis was identical to Experiment 1 except that besides condition, the fixed effect modality was added to the model. Therefore, the full linear mixed effects model included condition and modality and its interaction. For the random structure, participant and stimulus pair were included. For both participant and stimulus pair, random slopes were added for condition, modality and their interaction. Through backward elimination and likelihood ratio tests, it was determined which model provided the best fit and therefore which fixed effects made a significant contribution to explaining variation in RTs.
EEG preprocessing
As in Experiment 1, trials with incorrect responses or RTs below 150 ms were removed. Remaining trials were visually inspected for blinks or noise. On average, for each condition in each modality, 35 out of 50 trials remained.
EEG data analysis
Initially we set out to run similar analyses to Experiment 1, but based on visual inspection of the results we extended the time-window of interest from 0–800 ms to −400–800 ms with 0 being the start of the pre-speech interval. To pre-empt the results, in the visual modality differences between the withhold and passive condition appeared very early. This is probably due to the presentation duration, as the presentation of the visual (pseudo)word is matched to its auditory counterpart: whereas processing of the auditory stimulus must span that duration, reading of the visual equivalent was probably completed earlier. The change in time-window of interest meant that for the time–frequency representations of power the time-window was elongated to −600–1000 ms. Besides the main effect of condition, all analyses included the main effect of modality. Non-parametric cluster-based permutation tests are ideal for comparing two conditions at a time. We therefore compared the withhold and passive condition separately for the visual and auditory modality.
Upon finding significant clusters, we reanalysed the data by first computing a Laplacian transformation on the single-trial data before averaging over trials within each condition. Laplacian transformations were performed to enhance spatial resolution of the withhold-passive difference (Law, Rohrbaugh, Adams, & Eckardt, Citation1993; Nunez et al., Citation1994). Then, for the significant clusters as identified by the cluster-based permutation tests on the non-transformed data, the difference topographies were compared between the visual and auditory modalities using angle tests (Tian & Huber, Citation2008). When multiple clusters were found for one modality, the strongest cluster (i.e. smallest p-value) was used for the comparison. We calculated the angle based on the average over the dimensions that were associated with the significant clusters (i.e. time and/or frequency and channels). A cosine of the angle of −1 indicates completely opposite response patterns, +1 indicates identical patterns and 0 dissimilar patterns. In case of similarity, it can be assumed that the underlying distribution of cortical sources generating the scalp effect is similar whereas for dissimilarity, it can be assumed that the configuration of the underlying sources differs between the two conditions being compared. We used t-tests to evaluate if the cosine differed significantly from −1, 1, or 0.
Results
The best-fitting model for RTs included both main effects, condition and modality, but not their interaction. Starting with the full model, dropping the interaction did not result in worse fit (χ2(1) = 0.27, p = .60). Removing condition caused poorer model fit (χ2(1) = 13.99, p < .001), and so did modality (χ2(1) = 17.74, p < .001). The winning model therefore included condition (ß = −70, SE = 17, t = −4.18) and modality (ß = 254, SE = 50, t = 5.04). Responses were faster in the withhold condition (M = 941 ms, SD = 293) than in the passive condition (M = 1010, SD = 357). Moreover, responses were faster in the visual modality (M = 848 ms, SD = 334) than in the auditory modality (M = 1108 ms, SD = 263). The fast responses in the visual modality supports our decision to extend the EEG analyses time-window to include an earlier window, as processing seems to proceed at a quicker rate than in the auditory modality.
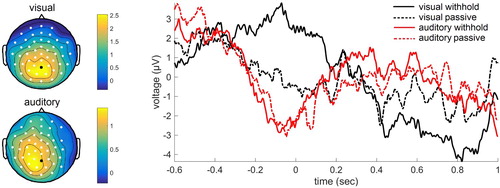
The ERPs revealed a significant difference between the withhold condition and the passive condition in both modalities. For the visual modality, three significant clusters were found. The first cluster was associated with a larger positivity for the withhold condition relative to the passive condition (p = .002). This effect was widespread with a posterior peak in the time-window −0.29–0.19 sec. Two other clusters were identified associated with a larger positivity for the passive condition than the withhold condition (p = .048 and p = .002). This larger positivity was present in central electrodes in later time-windows, from 0.44–0.52 sec and from 0.57–0.74 sec. For the auditory modality, two significant clusters were found with a larger positivity for the withhold condition than the passive condition. This positivity was predominantly over left posterior electrodes from 0.14–0.20 sec and from 0.25–0.33 sec (p = .049 and p = .044, respectively). See for the ERPs.
Figure 5. Grand average event-related potentials for the electrode indicated in black. Positivity plotted upwards. The topographical plot is shown separately for the visual modality (time-window −0.29–0.19 sec) and auditory modality (time-window 0.14–0.33 sec), with electrodes showing a significant effect shown in white.
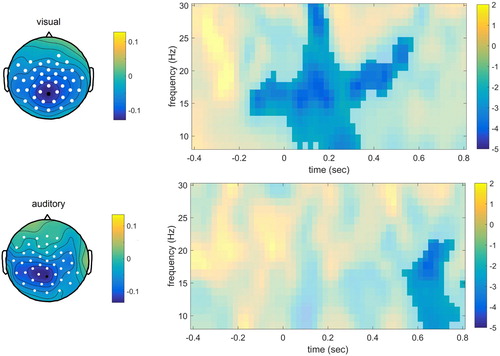
The time-averaged spectra analyses revealed one significant cluster in each modality, associated with power decreases for the withhold condition compared to the passive condition (visual modality: p = .002; auditory modality: p = .002). For the visual modality, the power decreases were most prominent in the frequency range 13–18 Hz and for the auditory modality, the range was 13–15 Hz, in both cases over posterior channels. The effect seems to appear in the beta range.
For the time-resolved spectra data, one significant cluster was found for both the visual (p = .003) and auditory modality (p = .022), associated with power decreases for the withhold condition compared to the passive condition, see . This seemed to be present for a large time-window and large frequency range concentrated around the beta range for the visual modality. The cluster was later and smaller for the auditory modality.
Figure 6. Time-frequency results for the electrode indicated in black, for the visual modality (upper panel) and auditory modality (lower panel) separately. The intensity indicates t-values. The topographical plot for the visual modality is shown for the time-window 0–0.5 sec and frequency range 8–30 Hz, for the auditory modality for 0.60–0.80 sec and 8–22 Hz.
Angle tests were used to compare the topography of the effects associated with the significant clusters in the visual and auditory modality. For ERPs, the withhold-passive difference was calculated for −0.29–0.19 for the visual domain and for 0.25–0.33 in the auditory modality. For power, this was done for the previously mentioned significant clusters (visual: 13–18 Hz; auditory: 13–15 Hz). Finally, for the time–frequency representations, the withhold-passive effect was calculated from 0 to 0.5 sec and in the frequency range 8–30 Hz for the visual modality, and 0.6–0.8 sec and 8–25 Hz for the auditory modality. The angle tests revealed that the cosines of the angles were close to zero: −0.04, 0.10, 0.14 for ERPs, power, and TFR respectively. All differed from + 1 and −1 (all p < .001) but not from 0 (p > .05).
Discussion
As in Experiment 1, we found a positivity and a beta power reduction over posterior regions when speech was prepared and withheld compared to the same time-window when no response preparation was possible. Both of these effects were found for the visual and auditory modality, suggesting similar processes are taking place independently of input modality. The processes were not identical in terms of neuronal generators, however, as the angle tests revealed that all reported effects showed dissimilar topographies in the two modalities. This suggests that the posterior effects did not reflect response planning, as this should not depend on stimulus modality. Instead, the posterior effects most likely reflected attention to the second stimulus, the go-stimulus, to timely initiate speech.
There were several surprising findings. In the visual modality, the posterior effects started much earlier than predicted. The effects already appeared before the visual word had been removed from the screen. As mentioned in the method section, this is probably due to the fact that (pseudo)words were presented for the same duration in both modalities, on average for 665 ms. Whereas processing of the auditory (pseudo)word must span that duration, reading of the visual stimuli was probably completed earlier. Consequently, maintenance of the phonological code was already implemented. Maintaining this code, or maintaining attention to the go-stimulus, may have proven to be difficult towards the end of the pre-speech interval, as a negativity appeared over central electrodes in the withhold condition compared to the passive condition. What this negativity reflects exactly is currently unclear, however. In contrast to the visual modality, the posterior effects appeared relatively late in the auditory modality and were short-lived. This suggests that processing of the auditory word required additional time after stimulus offset and both response planning and the attention to the cue to speak were initiated at a later time point.
Our interpretation of both the positivity and the power reduction as an attentional effect only holds if our assumption that response planning is identical for the visually and auditorily presented words is correct. As argued previously, the low-level processes do call upon modality-specific processes but as soon as the decision is made whether the stimulus is a word or pseudoword, planning is initiated. This planning is a process we believe to be identical as the output must be identical: speech. However, this assumption may be wrong. First, we have followed the production model by Levelt et al. (Citation1999) which is a hierarchical model with separation of the different planning stages. Other word production models assume interactivity (Dell, Citation1986) or are non-hierarchical (Pulvermüller, Citation1999; Strijkers & Costa, Citation2016). In these models the response plan may interact with early processes, so with either the visual or auditory brain areas, and as such still differ for the two modalities. Second, in the auditory condition one could imitate the just heard speech and bypass phonological encoding whereas in the visual condition this is not possible. As a result, response planning would not be identical, and different neuronal sources could be involved, just as what our angle tests show. In Experiment 3 we removed the process of phonological encoding completely by asking participants to perform a lexical decision task instead.
Experiment 3
Just as in the previous experiment, participants were presented with words and pseudowords. Now they were required to indicate if a sequence contained a word or not by button press if that was the case. No response was to be given to pseudowords. Again, their response could only be given at the end of the trial, upon seeing or hearing the go-stimulus. Participants needed to withhold their response on half of the trials. Importantly, the planned response was not verbal but manual. If the first string of letters was an existing word, the decision to press the button was made and a manual response was planned and maintained. This motor response does not include phonological encoding and solely requires the motor cortex to be activated. The motor response is therefore identical for the two stimulus modalities. Therefore, the logic from Experiment 2 applies here too. If the sustained positivity and/or power decreases reflect response planning, the findings should be identical for both versions of the paradigm. If instead one or both of these effects index increased sensitivity to the final stimulus, results should differ depending on the modality of the incoming input. We again used angle tests to shed light on this issue. Furthermore, we compared the withhold conditions of Experiment 2 and 3. The planned responses are different in the two experiments, but in both attention is paid to the go-stimulus. Thus, if we find significant differences between the two experiments, this points to some aspect of the neural signal reflecting response planning. If however no significant differences are found this would suggest the signal predominantly reflects attentional processes.
Methods
Participants
Twenty-eight young adults participated, four datasets were excluded: two due to excessive blinking and two due to missing recordings for one block. The final sample comprised 24 participants (four male) with a mean age of 23 years.
Materials and design
Nearly the same stimuli were used as in Experiment 2. However, in that experiment, each stimulus pair included a word and a pseudoword. For Experiment 3, we needed to include no-response catch trials with two pseudowords. Without such trials, all sequences would contain a word. Participants would quickly learn that they did not have to pay attention to the written words and could just press a button upon seeing the second stimulus. Therefore, 15% of the sequences were changed such that the go-stimulus stimulus was turned from a word into a pseudoword, what we call the no-response condition. In other words, 15 visual trials and 15 auditory trials were taken from the passive condition and changed to become the no-response condition. Thus for each modality 50 withhold, 35 passive and 15 no-response trials were presented, see .
To alter 15% of the original passive sequences, the initial pseudoword of the sequence was kept but the word, the second stimulus, was replaced by a new pseudoword. Words were removed such that all lists adhered to the criteria from Experiment 2. Furthermore, the new pseudowords adhered to the same rules as the already existing pseudowords. For the auditory modality, pseudowords were taken from the items used in the practice block in Experiment 2 (half of the 30 items), so that we did not have to create new recordings. This left 15 auditory items for the current practice phase. We created 30 new pseudowords for the visual version with half presented in the practice phase and the other half in the experimental phase.
Procedure
Participants were instructed to press the left button on a button box with their left index finger when the sequence contained a word, but only upon seeing the final stimulus. They were told that there were trials that did not include a word and it was therefore important to pay attention to be able to withhold a button response when necessary.
Apparatus
The apparatus was identical to Experiment 1 and 2, except that a button box was used as well.
Analyses
Analyses were nearly identical to Experiment 2. The passive condition contained fewer trials as 15 out of 50 trials were changed into the new no-response condition. In the EEG analyses, these two conditions could be combined to be compared to the withhold condition as the passive and no-response conditions were identical in the pre-speech interval of interest. However, in the RT analysis these two conditions could not be combined as there should be no button press in the no-response condition, and therefore no RT data. The no-response condition was therefore not analysed.
EEG preprocessing
As in the previous experiments, trials with incorrect responses or RTs below 150 ms were removed. Incorrect responses now included button presses in trials with only pseudowords and no response or premature responses to word trials. Remaining trials were visually inspected for blinks or noise. On average, 36 out of 50 trials remained for each condition.
Results
The RT analysis started with the full model, but removing the interaction did not lead to worse fit (χ2(1) = 2.39, p = .12). Removing condition resulted in poorer model fit (χ2(1) = 6.87, p = .01), and so did modality (χ2(1) = 42.14, p < .001). The winning model therefore included condition (ß = −56, SE = 19, t = −2.89) and modality (ß = 359, SE = 33, t = 10.89). Responses were faster in the withhold condition (M = 851 ms, SD = 392) than in the passive condition (M = 909, SD = 307), and they were faster in the visual modality (M = 688 ms, SD = 318) than in the auditory modality (M = 1071 ms, SD = 293).
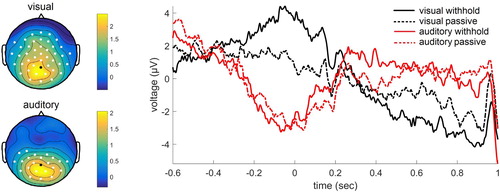
For the ERPs, the visual modality analysis revealed two significant clusters, one associated with a larger positivity for the withhold condition relative to the passive condition (p < .001), and another associated with the reverse pattern (p = .003), i.e. the passive condition showing a larger positivity than the withhold condition. The first positivity (withhold > passive) was most prominent in the time-window −0.16–0.17 sec over posterior electrodes. The second positivity (passive > withhold) was most prominent from 0.53–0.70 sec for central electrodes. For the auditory modality, no significant clusters were found (smallest Monte Carlo p = 0.085). This effect became significant when limiting the analysis to the time-window of 0–800 ms as was originally intended (p = .049), with the withhold condition showing a larger positivity than the passive condition. This effect was most prominent over posterior electrodes from 0.37–0.42 sec. See for the ERPs.
Figure 7. Grand average event-related potentials for the electrode indicated in black. Positivity plotted upwards. The topographical plot is shown separately for the visual modality (time-window −0.16–0.17 sec) and auditory modality (time-window 0.37–0.42 sec), with electrodes showing a significant effect shown in white.
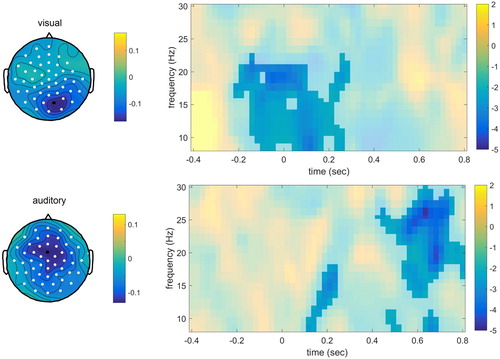
The time-averaged spectra analyses revealed one significant cluster for the visual modality (p = .044), with power decreases for the withhold condition compared to the passive condition. The power decreases were most prominent in the frequency range 8–10 Hz over posterior electrodes. For the auditory modality, two significant clusters were found (first cluster p = .008, second cluster p = .006), again with power decreases for the withhold condition compared to the passive condition. The power decreases were found for the 8–10 Hz and 13–15 Hz range, both over posterior channels.
Finally, for the time-resolved spectra data, one significant cluster was found for both the visual (p = .014) and auditory modality (p < .001), see . For the withhold condition compared to the passive condition, a power decrease was evident. This seemed to be present mostly for right posterior electrodes between 8 and 22 Hz for the visual modality, whereas the power decreases for the auditory modality had a central distribution between 12 and 30 Hz.
Figure 8. Time-frequency results for the electrode indicated in black, for the visual modality (upper panel) and auditory modality (lower panel) separately. The intensity indicates t-values. The topographical plot for the visual modality is shown for the time-window −0.1–0.2 sec and frequency range 8–22 Hz, for the auditory modality for 0.50–0.70 sec and 17–28 Hz.
Angle tests were used to compare the topography of data points associated with the significant clusters in the visual and auditory modality. For ERPs, the withhold-passive difference was calculated for −0.16–0.17 for the visual modality and for 0.37–0.42 in the auditory modality. For time-averaged power, this was done for the two posterior clusters (visual: 8–10 Hz; auditory: 13–15 Hz). Finally, for the time–frequency representations, the withhold-passive effect was calculated from −0.1–0.2 sec and in the frequency range 8–22 Hz for the visual modality, and 0.5–0.7 sec and 17–28 Hz for the auditory modality. The angle tests revealed that the cosines of the angles were close to zero: 0.02, 0.08, 0.13, for ERPs, time-averaged power, and time-resolved power, respectively. All differed from + 1 and −1 (all p < .001), the angles for ERPs and power did not differ from 0 (p > .05) but the angle for the time-resolved spectra did differ from 0 (p = .01).
Comparison Experiment 2 and 3
Finally, for additional evidence, we compared the withhold conditions of Experiment 2 and 3, separately for the visual and auditory conditions. If linguistic response planning is reflected in the EEG signal, this should differ from the signal measured during planning a motor response. Analyses were similar as previously reported (time-window −400–800 ms), but now for a between-subjects design. For none of the comparisons – ERP, time-averaged power, and time-resolved power – did we find significant clusters. Thus, there were no detectable differences between linguistic response planning and maintenance on the one hand, and manual response planning and maintenance on the other hand.
Discussion
Experiment 3 showed remarkably similar results to Experiment 2. Even though the response was changed from speech to a button press, from a linguistic plan to a motor plan, the neural signature was highly similar. Again, we found a positivity and a power reduction over posterior regions when a manual response was withheld compared to the time-interval where no response was planned. In Experiment 3 the power reduction seemed to not only be present in the beta band as in Experiment 2, but also seemed to include the alpha band. For both effects, the topographies differed for the visual and auditory modality, implying different underlying neuronal sources. Furthermore, the withhold conditions of Experiment 3 did not differ significantly from those of Experiment 2. It must be noted that the null finding warrants caution as it could also be due to lack of power in a between-subjects design possibly leading to greater variability. However, this test was included only to provide additional evidence next to the analyses of the experiments separately. When taking all of the results together, the overall picture points to the neural signal reflecting attention to the final stimulus, the cue necessary to launch the response, but not the actual response planning itself.
General discussion
Turn-taking between speakers happens so rapidly that it has been suggested that response planning must already take place while listening to one's interlocutor (Levinson & Torreira, Citation2015). It has been suggested that response planning is initiated as soon as possible, and that this planning proceeds down to the phonological encoding level. Simultaneously, the auditory input stream is being monitored for turn-final cues such as a syntactic closure or an intonational phrase boundary. The phonological code is held in a buffer and articulation is only launched upon detection of such turn-final cues. Indeed, there are several studies showing on the one hand that some response planning is taking place (Barthel et al., Citation2016; Sjerps & Meyer, Citation2015) and on the other hand that turn ends can be predicted (Bögels & Torreira, Citation2015; De Ruiter et al., Citation2006).
The aim of the present study was to test if the processes of response planning and turn end monitoring can be identified using EEG. We wished to find separate neural signatures for response planning and maintenance on the one hand, and attention to the end of a sequence on the other hand, using a delayed response paradigm. Delayed word production has previously been studied with delayed picture naming, in comparison to immediate naming (Laganaro & Perret, Citation2011). Here we compared delayed speech to a condition where no response was prepared and maintained. This is a crucial contrast if one wants to identify the presence of response planning in conversation-like paradigms. First we must know what the neural signature of response planning and maintenance actually is before we can show it occurs in more complicated settings. The present study therefore did not wish to (dis)prove the early planning hypothesis, but test which processing streams can reliably be identified using EEG.
Two neural effects have been proposed to reflect response planning. Two EEG studies on turn-taking by Bögels et al. (Citation2018, Citation2015) showed a sustained positivity starting 500 ms after the onset of the information that allowed participants to prepare their answer, proposed to reflect production planning including phonological encoding. Moreover, around the same time alpha power decreased over posterior regions. The authors interpreted these effects as a shift from auditory attention and working memory (for comprehension) to preparation and maintenance of the answer (for production). However, these neural signatures could also reflect the other process necessary for successful turn-taking, namely monitoring the auditory stream for turn-end cues. In a delayed pseudoword production experiment, Piai et al. (Citation2015) had shown a similar alpha-beta power reduction over posterior regions and interpreted this as heightened attention to the go-signal. In other words, the EEG effects taken to reflect production planning could reflect attention to the sentence end in the studies by Bögels and colleagues (even though behavioural evidence for response planning was present). The current study set out to test which functions the neural responses most likely reflect.
We solely tested what happens when a participant must prepare and maintain an answer, first replicating and then adapting the paradigm introduced by Piai et al. (Citation2015). Depending on the position of the letter string to be pronounced in the sequence of stimuli, speech was either passive (string in final position) or delayed (string in pre-final position). In Experiment 1 participants were presented with a sequence of an unpronounceable and a pronounceable nonword, whereas in Experiment 2 these where changed to a pronounceable nonword (i.e. a pseudoword) and a word. Just the pronounceable nonword or word needed to be produced, but only upon seeing the final stimulus – the cue to speak. Thus, in half of the trials speech had to be withheld until this cue was presented. The time-window where speech was withheld was compared to the same time-window when no response could be planned and we found an ERP positivity and a reduction in beta power over posterior electrodes in both experiments.
Critically, in Experiment 2, we compared a visual version with an auditory version to understand the nature of these neural effects. If these effects reflect planning for production, they should be the same for both modalities. If however, they index attention to the end of the sequence, the go-stimulus, the effects should be generated in auditory areas for heard stimuli and visual areas for seen stimuli yielding different EEG scalp topographies. For all performed analyses – ERPs, time-averaged spectra and time-resolved spectra – the angle tests revealed that the topographies differed from each other. The underlying distribution of neural sources is therefore different for the two modalities. This suggests that what is being measured by EEG in this withhold paradigm is the attention to the final stimulus instead of response planning. This interpretation was supported by findings from Experiment 3, where instead of a linguistic response, participants had to prepare and withhold a manual response in a delayed lexical decision task. No phonological encoding took place, but instead a motor response was planned. We found very similar results as in Experiment 2: the auditory and visual version of the lexical decision task both revealed a positivity and power reduction, but with dissimilar topographies. Furthermore, the withhold conditions of Experiment 2 and 3 did not differ from each other, suggesting that response type differences were not captured at the scalp level. Instead, the neural signal most likely reflects attention to the sequence end.
Thus, even in a paradigm where response planning is taking place, highly likely including the process of phonological encoding, the neural signal does not seem to index planning itself. Planning must have been initiated as the attention effect is dependent on the intention to respond: in the withhold condition, and not in the passive condition, this intention is present and the final stimulus is treated as a cue to respond quickly (whereas in the passive condition the final stimulus is processed fully in order to generate a response). Indeed, some planning must have taken place, as response times were shorter for the early planning compared to the late planning condition. However, when exactly this planning was initiated, and how extensive it was remains unclear. Attention to the cue to respond quickly is dependent on the initiation of response planning, but not necessarily on the completion of response planning. These two processes may occur in parallel.
The current set of experiments suggests that phonological planning and maintenance may be difficult to detect with EEG when monitoring for the end of the sequence is taking place concurrently. A different technique, like fMRI, may be better at distinguishing between these two processes, providing more accurate and possibly separate sources of the effects. However, due to the poor temporal resolution of the haemodynamic signal, timing information is lost and it would still not be evident which stages of word production occur when.
It is also possible that this late process of phonological encoding is difficult to measure with EEG when attention effects are present, whereas earlier processes of production planning like lemma retrieval would not be overridden. This could mean that the effects by Bögels et al. (Citation2015, Citation2018) did indeed reflect response planning, but only early processes of planning and not phonological encoding. Furthermore, whereas our attention effect can explain the results in our simple paradigm, this specific attention effect alone cannot explain the results Bögels and colleagues observe at the end of their question sentences. Regardless of whether the critical information was presented early or late, attention to the end of the sentence to launch articulation should have been heightened. The fact that Bögels et al. do observe differences at this late time-point for the early versus late condition shows that this type of monitoring to respond quickly cannot be the only factor contributing to the EEG signal.
Finally, it may be that phonological planning and maintenance were not only concealed by the attention effects, but additionally by other differences in the stimuli used in our design. We measured the time-interval between the pre-speech stimulus and imperative stimulus, arguing that the only difference between the withhold and passive condition was the presence or absence of response planning. However, the pre-speech stimulus differed in the two conditions – in Experiment 1 phonological properties differed between pseudowords and non-words whereas in Experiment 2 and 3 semantic properties differed between words and pseudowords. The impact of this difference may have extended into the pre-speech interval. These stimuli differences may have, in addition to the attention effect, overridden response planning effects.
Using only words would be a good next step to see if response planning can be made visible in the EEG signal even in the presence of attention effects. One way would be to present words and ask participants to read aloud or repeat only the animal names. This could identify the early production stages. To increase the chance of identifying phonological encoding one could manipulate the ease of phonological encoding. A neural difference between easy and difficult phonological encoding can only be due to response planning, not monitoring for the sequence end. Alternatively, one might vary the difficulty of monitoring the spoken utterances and hold the ease of phonological encoding constant. Thus, further experimentation in combination with the excellent temporal information from the electrophysiological signal resolved at the source level is necessary to address these questions. Only when we can distinguish between response planning and monitoring for sequence end, can we learn more about when and how these two processes co-occur in conversation.
Acknowledgments
We thank Mirte Dikmans for testing the participants.
Disclosure statement
No potential conflict of interest was reported by the authors.
References
- Acar, Z. A., & Makeig, S. (2013). Effects of forward model errors on EEG source localization. Brain Topography, 26(3), 378–396. doi: 10.1007/s10548-012-0274-6
- Barthel, M., Sauppe, S., Levinson, S. C., & Meyer, A. S. (2016). The timing of utterance planning in task-oriented dialogue: Evidence from a novel list-completion paradigm. Frontiers in Psychology, 7, 1858. doi: 10.3389/fpsyg.2016.01858
- Bates, D., Maechler, M., & Bolker, B. (2013). lme4: Linear mixed-effects models using S4 classes. R package version 0.999999-2. Retrieved from http://CRAN.R-project.org/package=lme4
- Boersma, P., & Weenink, D. (2012). Praat: doing phonetics by computer [Computer program]. Version 5.3.32, Retrieved from http://www.praat.org/
- Bögels, S., Casillas, M., & Levinson, S. C. (2018). Planning versus comprehension in turn-taking: Fast responders show reduced anticipatory processing of the question. Neuropsychologia, 109, 295–310. doi: 10.1016/j.neuropsychologia.2017.12.028
- Bögels, S., Magyari, L., & Levinson, S. C. (2015). Neural signatures of response planning occur midway through an incoming question in conversation. Scientific Reports, 5, 12881. doi: 10.1038/srep12881
- Bögels, S., & Torreira, F. (2015). Listeners use intonational phrase boundaries to project turn ends in spoken interaction. Journal of Phonetics, 52, 46–57. doi: 10.1016/j.wocn.2015.04.004
- Caramazza, A. (1997). How many levels of processing are there in lexical access? Cognitive Neuropsychology, 14(1), 177–208. doi: 10.1080/026432997381664
- Coltheart, M., & Rastle, K. (1994). Serial processing in reading aloud: Evidence for dual-route models of reading. Journal of Experimental Psychology: Human Perception and Performance, 20(6), 1197–1211.
- Corps, R. E., Crossley, A., Gambi, C., & Pickering, M. J. (2018). Early preparation during turn-taking: Listeners use content predictions to determine what to say but not when to say it. Cognition, 175, 77–95. doi: 10.1016/j.cognition.2018.01.015
- Dell, G. S. (1986). A spreading-activation theory of retrieval in sentence production. Psychological Review, 93(3), 283–321. doi: 10.1037/0033-295X.93.3.283
- De Ruiter, J. P., Mitterer, H., & Enfield, N. J. (2006). Projecting the end of a speaker's turn: A cognitive cornerstone of conversation. Language, 82, 515–535. doi: 10.1353/lan.2006.0130
- Engel, A. K., & Fries, P. (2010). Beta-band oscillations—signalling the status quo? Current Opinion in Neurobiology, 20(2), 156–165. doi: 10.1016/j.conb.2010.02.015
- Eulitz, C., Hauk, O., & Cohen, R. (2000). Electroencephalographic activity over temporal brain areas during phonological encoding in picture naming. Clinical Neurophysiology, 111(11), 2088–2097. doi: 10.1016/S1388-2457(00)00441-7
- Gravano, A., & Hirschberg, J. (2011). Turn-taking cues in task-oriented dialogue. Computer Speech & Language, 25(3), 601–634. doi: 10.1016/j.csl.2010.10.003
- Hickok, G., & Poeppel, D. (2007). The cortical organization of speech processing. Nature Reviews Neuroscience, 8, 393–402. doi: 10.1038/nrn2113
- Indefrey, P. (2011). The spatial and temporal signatures of word production components: A critical Update. Frontiers in Psychology, 2, 255. doi: 10.3389/fpsyg.2011.00255
- Indefrey, P., & Levelt, W. J. M. (2004). The spatial and temporal signatures of word production components. Cognition, 92(1–2), 101–144. doi: 10.1016/j.cognition.2002.06.001
- Jensen, O., & Mazaheri, A. (2010). Shaping functional architecture by oscillatory alpha activity: Gating by inhibition. Frontiers in Human Neuroscience, 4, 186. doi: 10.3389/fnhum.2010.00186
- Laganaro, M., & Perret, C. (2011). Comparing electrophysiological correlates of word production in immediate and delayed naming through the analysis of word age of acquisition effects. Brain Topography, 24(1), 19–29. doi: 10.1007/s10548-010-0162-x
- Law, S. K., Rohrbaugh, J. W., Adams, C. M., & Eckardt, M. J. (1993). Improving spatial and temporal resolution in evoked EEG responses using surface Laplacians. Electroencephalography and Clinical Neurophysiology/Evoked Potentials Section, 88(4), 309–322. doi: 10.1016/0168-5597(93)90055-T
- Levelt, W. J. M., Roelofs, A., & Meyer, A. S. (1999). A theory of lexical access in speech production. Behavioral and Brain Sciences, 22, 1–38.
- Levinson, S. C., & Torreira, F. (2015). Timing in turn-taking and its implications for processing models of language. Frontiers in Psychology, 6, 731. doi: 10.3389/fpsyg.2015.00731
- Maris, E., & Oostenveld, R. (2007). Nonparametric statistical testing of EEG-and MEG-data. Journal of Neuroscience Methods, 164(1), 177–190. doi: 10.1016/j.jneumeth.2007.03.024
- Mazaheri, A., van Schouwenburg, M. R., Dimitrijevic, A., Denys, D., Cools, R., & Jensen, O. (2014). Region-specific modulations in oscillatory alpha activity serve to facilitate processing in the visual and auditory modalities. NeuroImage, 87, 356–362. doi: 10.1016/j.neuroimage.2013.10.052
- Nunez, P., Silberstein, R., Cadusch, P., Wijesinghe, R., Westdorp, A., & Srinivasan, R. (1994). A theoretical and experimental study of high resolution EEG based on surface Laplacians and cortical imaging. Electroencephalography and Clinical Neurophysiology, 90(1), 40–57. doi: 10.1016/0013-4694(94)90112-0
- Oostenveld, R., Fries, P., Maris, E., & Schoffelen, J.-M. (2011). Fieldtrip: Open source software for advanced analysis of MEG, EEG, and invasive electrophysiological data. Computational Intelligence and Neuroscience, 2011, 1–9. doi: 10.1155/2011/156869
- Pfurtscheller, G., & Lopes da Silva, H. F. (1999). Event-related EEG/MEG synchronization and desynchronization: Basic principles. Clinical Neurophysiology, 110(11), 1842–1857. doi: 10.1016/S1388-2457(99)00141-8
- Piai, V., Roelofs, A., Rommers, J., Dahlslätt, K., & Maris, E. (2015). Withholding planned speech is reflected in synchronized beta-band oscillations. Frontiers in Human Neuroscience, 9, 549. doi: 10.3389/fnhum.2015.00549
- Pulvermüller, F. (1999). Words in the brain's language. Behavioral and Brain Sciences, 22(2), 253–279. doi: 10.1017/S0140525X9900182X
- R. Core Team. (2012). R: A language and environment for statistical computing. Vienna, Austria: R Foundation for Statistical Computing. ISBN 3-900051-07-0. Retrieved from URL http://www.R-project.org/
- Sassenhagen, J., & Draschkow, D. (2019). Cluster-based permutation tests of MEG/EEG data do not establish significance of effect latency or location. Psychophysiology, 56(6), e13335. doi: 10.1111/psyp.13335
- Sjerps, M. J., & Meyer, A. S. (2015). Variation in dual-task performance reveals late initiation of speech planning in turn-taking. Cognition, 136, 304–324. doi: 10.1016/j.cognition.2014.10.008
- Stivers, T., Enfield, N. J., Brown, P., Englert, C., Hayashi, M., Heinemann, T., … Levinson, S. C. (2009). Universals and cultural variation in turn-taking in conversation. Proceedings of the National Academy of Sciences, 106(26), 10587–10592. doi: 10.1073/pnas.0903616106
- Strijkers, K., & Costa, A. (2016). The cortical dynamics of speaking: Present shortcomings and future avenues. Language, Cognition and Neuroscience, 31(4), 484–503. doi: 10.1080/23273798.2015.1120878
- Tian, X., & Huber, D. E. (2008). Measures of spatial similarity and response magnitude in MEG and scalp EEG. Brain Topography, 20(3), 131–141. doi: 10.1007/s10548-007-0040-3
- Zevin, J. D., & Seidenberg, M. S. (2004). Age-of-acquisition effects in reading aloud: Tests of cumulative frequency and frequency trajectory. Memory & Cognition, 32(1), 31–38. doi: 10.3758/BF03195818