
Abstract
Systematic observation in educational research highlights a wide diversity of aspects of classroom interactions, yet frequency of score cycles is crucial when analysing dimensions of classroom teaching. The aim of this study is to focus on differences in quality of teaching and loss of instructional time using Classroom Assessment Scoring System—Secondary Manual with fifteen-minute score analysis and five-minute score analysis. Video data are collected from five English as a foreign language lessons with one teacher in addition to an interview with the teacher. Data is collected in a Norwegian lower-secondary school. The lessons are analysed with both the standardised and novel approach. Results suggest that the five-minute score analysis produces a more accurate account of the phenomena of study. Instructional time is lost for more than 5 min on two occasions after further examination of the CLASS-S productivity dimension due to an instructional pattern of finishing lessons early. Paradoxically, the interviewed teacher emphasises lack of time for the facilitation of student learning as a limiting factor for own teaching.
PUBLIC INTEREST STATEMENT
Use of observation manuals to study teacher–student interactions in lessons can focus on different aspects of what teachers and students do and how they interact. If the observer chooses to analyse video observations with more frequent intervals, the data have the potential to become more fine-masked and nuanced, yet this depends on the nature of the dimension of interest. How often a classroom observer rates the aspects of the observation manual seems to have impact for the results, especially when the aspect is use of instructional time. This paper compares observations of five English as a foreign language lessons with the use of 15 fifteen-minute score analysis and five-minute score analysis. The paper discusses how systematic video observation with more frequent cycles can map quality in teacher–student interactions, highlight teachers’ use of instructional time, and identify periods within the teaching lesson where instructional time is lost.
1. Introduction
Systematic observation has long historical roots in the field of education with important contributions to the potential of studying classroom interactions in a naturalistic setting (Hardman & Hardman, Citation2017; O’Leary, Citation2014). Observation manuals are systems with categories or rubrics which raters use to judge the quality of teaching within lessons (Bell, Dobbelaer, Klette, & Visscher, Citation2019; Wragg, Citation1999), and typically include scores every 15–20 min (e.g., Grossman et al., Citation2009; Pianta, Hamre, & Mintz, Citation2012; Pianta, La Paro, & Hamre, Citation2008). Nonetheless, length of scoring intervals differs with the purpose of observation, and scoring procedures related to frequency might benefit from adaptations. A study by Saloviita (Citation2013) found a delay in the start of instructional test across 131 lessons in Finnish classrooms. Saloviita’s (Citation2013) study measured lesson starts exclusively, but the work points to potential benefits of scoring full lessons at more frequent intervals if the purpose is to study loss of instructional time. Loss of instructional time can pose serious impediments to the overall teaching quality of lessons. In the context of studying sequences with systematic video observation, scoring frequency is an important aspect and often reflected in the scope of manuals (Bell et al., Citation2019; Gregory & Mikami, Citation2015).
Knowledge about key aspects of teaching quality is essential to student learning and can improve professional development processes (Gamlem, Citation2019), because systematic observation manuals provide standardised approaches to measuring strengths and weaknesses of teaching behaviour (Allen et al., Citation2013). Observation manuals for classroom interactions are often characterised by a focus on teaching quality, learning quality or both (Bell et al., Citation2019). Learning and theory into how students self-regulate involve metacognitive, emotional and motivational processes within students (Zimmerman, Citation1990). As such, classroom observation often focuses on how students appear to be learning (Wragg, Citation1999), yet systematic video observation can be combined with other data, such as students’ self-reports or interviews. In the field of classroom observation, teaching quality is conceptualised as classroom interactions among teachers and students around central aspects of the facilitation of student learning (Hiebert & Grouws, Citation2007; Pianta et al., Citation2012). Teacher–student interactions are understood as a multifaceted concept, consisting of emotional support, classroom organisation and instructional support (Hamre et al., Citation2013; Pianta et al., Citation2012), but operationalisation depends on different observation manuals.
Observation manuals vary in aims, purposes and structures (Gregory & Mikami, Citation2015; Hardman & Hardman, Citation2017). In education, this becomes evident in aims that vary from scoring the quality of learning processes to measuring the frequency of behaviours or activities. However, no observation manual can accomplish all goals (Harvey, Citation2006). Focusing on the important characteristics of the observation system is important, and the narrowness or breadth of the observations should be dictated by the overall purpose (Hill & Grossman, Citation2013). Observation manuals are often designed to match a studied phenomenon with strengths and weaknesses for each system (Gregory & Mikami, Citation2015). Aim and purpose are reflected in the frequency of scoring with more complex construct analysed in longer cycles, for example, 15-minute score analysis. In systematic observation of classroom research, the unit of study is a teaching lesson. Scoring frequency in lessons range from scoring in cycles of minutes or seconds. The Classroom Assessment Scoring System (CLASS) Pre-K (Pianta et al., Citation2008), CLASS-S (Pianta et al., Citation2012), and Protocol for Language Arts Teaching Observation (PLATO) (Grossman et al., Citation2009) include score cycles in a span of 15–20 min. However, some observation manuals have shorter scoring span. The Pathways to Literacy Coding Manual tracks the amount of time preschool teachers and students are involved in academic and non-academic activities in minutes and seconds, and any activity must have lasted of at least 15 s (Connor, Morrison, & Slominski, Citation2006). The scoring manual, Student Interaction in Specific Settings (SISS), includes scores every 5 min (Cash, Bradshaw, & Leaf, Citation2015). SISS is a direct observation manual of student interactions pattern with the emphasis on social climate and violating behaviours (Cushing, Horner, & Barrier, Citation2003). The frequent scoring pattern of the SISS enables the researcher to gauge the frequency of rule violations for students.
The use of systematic observation of classroom interactions might pose challenges. There is now a myriad of different observation manuals available for answering questions about quantity in classroom interactions, and selections should be based on relevance rather than convenience (O’Leary, Citation2014). Observer presence in the classroom can also influence classroom interactions which is problematic. Thus, minimising the intrusion into the classroom is further important for reliability (Wragg, Citation1999). Despite the many advantages to video observation, such as inter-rater reliability and opportunity to replay events (Gamlem & Munthe, Citation2014; Gregory & Mikami, Citation2015), there are also some potential challenges. These challenges might relate to sound quality, out-of-angle events, camera effect and effects of observer presence (Erickson, Citation2006; Wragg, Citation1999).
1.1. Loss of instructional time and productivity
Learning outcomes and academic achievement have been associated with the amount of time students are involved in learning tasks (Abadzi, Citation2007, Citation2009; Brown & Saks, Citation1986; Jez & Wassmer, Citation2015). Time lost on management tasks, disruptive behaviour, tardiness, or other classroom elements could potentially cause negative consequences to student learning. Previous research has shown that lesson starts are transitional events that are object to cause management problems for teachers (Arlin, Citation1979; Saloviita, Citation2013). Saloviita (Citation2013) found that on average the 131 lessons observed were delayed by 6 min. Both teachers and students might affect time delay in lessons in different ways. Slow starts, lengthy transitions and lack of preparations of activities are examples of reasons for teachers being responsible for the loss of instructional time, while students are responsible when causing disruptions or spending a significant amount of time in transitions. A study by Behar-Horenstein, Isaac, Seabert, and Davis (Citation2006) found that students and teachers were both responsible for the loss of instructional time with loss ranging from 14% to 39% across elementary, middle and high schools in the United States. Instructional time loss has been a major issue in developing countries (Abadzi, Citation2007, Citation2009). Abadzi (Citation2007) reported on results of the percentage of time that students were engaged in learning activities, and found that this amounted to 39% in Ghana, 63% in Pernambuco, 71% in Morocco, and 78% in Tunisia.
Loss of instructional time seems small at the surface but has a severe impact when it accumulates (Saloviita, Citation2013). Students are also most engaged and active in classrooms with focus on effective time management (Brophy & Evertson, Citation1976; Good & Grouws, Citation1977; Medley, Soar, & Coker, Citation1983). In an examination and comparison of two observation frameworks, Framework for Teaching and Tripod 7C, Ferguson and Danielson (Citation2014) found that classroom management was the strongest predictor of achievement gains. The teacher’s ability to maintain and sustain proper managerial and organisational aspects of classroom teaching is consequently of importance. Solheim, Ertesvåg, and Dalhaug Berg (Citation2018) found evidence for the productivity dimension through teachers’ own reports of how they considered own preparation of their teaching as a prerequisite for student learning, which suggests a link between time management and teacher preparation.
The productivity dimension in the CLASS-S manual (Pianta et al., Citation2012) is well-suited and relevant to use if the studied phenomenon is loss of instructional time. This is particularly because the dimension captures the downtime in lessons, that is, instances when the teacher has not facilitated activities or direction. The CLASS-S operationalises productivity in the domain of classroom organisation, and defines it in the following manner:
Productivity: how well the classroom runs with respect to routines, how well students understand the routines and the degree to which teachers provide activities and directions so that maximum time can be spent in learning activities. (Pianta et al., Citation2012, p. 3)
If teachers fail to provide activities or directions, or further yet start or end lessons earlier than expected, then this obstructs learning time for students. Productivity in this regard means teacher’s facilitation of routines, but also the students’ comprehension and activation of the routines in classroom activities. In addition, it means teacher’s ability to provide activities for students and direct them towards tasks and activities, so that learning time is maximised (Allen et al., Citation2013; Woolfolk Hoy & Weinstein, Citation2006). An example of a classroom with high productivity is a classroom where management tasks run smoothly, teacher minimises disruptions, students know and act on routines whilst spending minimal time in transitions, and where the teacher is fully prepared for learning activities. The CLASS-S manual (Pianta et al., Citation2012, p. 49) further specifies that productivity in this sense is “not a code about student engagement or about the quality of instruction or activities”. Since productivity is operationalised fully under the broad domain of classroom organisation in CLASS-S (Pianta et al., Citation2012), students might be engaged in out-of-subject tasks of lower instructional quality, but still be considered “productive” if time spent in learning activities is maximised. However, the CLASS-S manual scores in cycles of 15-min cycles, and for a more fine-masked observation of the downtime of the classroom, it is relevant to study in shorter intervals.
Studying loss of instructional time in English as a foreign language (EFL) lessons seems important as the EFL classroom is also an important arena for target language exposure (Vattøy & Smith, Citation2019). This study analyses the productivity dimension to map loss of instructional time across five EFL lessons with both the standardised CLASS-S approach and a new analytic approach of five-minute score analysis, as well as the differences in overall teaching quality.
What are the differences in quality of teaching and loss of instructional time when studying teacher-student interactions with two analytic video-score approaches (i.e., 15-minute score analysis and five-minute score analysis)?
2. Method
2.1. Sample
Five video-recorded lessons of EFL teaching by one teacher in lower secondary school are collected. The teacher was recruited from a school in the west of Norway. This school was selected based on previous results from the national test in English (2014–2018) with results that were representative of the national results in English for Year 8. The head teacher of the school was initially contacted, and information about the study and an invitation was passed on to the teacher, who agreed to participate. An invitation letter with information about the research study was subsequently passed on to students and parents/caregivers, who all signed an informed consent form prior to commencement of the data collection. The teacher participating in this study had over a decade of teaching experience.
2.2. Procedure
Two video cameras were used to collect audio-visual data of classroom interactions, as use of a second camera is used to collect supplementary information and ensure that both angles of the classroom are captured (Gamlem & Munthe, Citation2014). The teacher had a collar-clip microphone which was connected to the primary camera of analysis. This ensured high-quality audio of teacher–student audio communications. There were no special teaching plans associated with the data collection, and the teacher was asked to carry out teaching as normal. Each lesson was video recorded from start to end by the first author. Recording was initiated once the school bell gave signal for “lesson start” and turned off once the bell signalled for “break”. The length of lessons at this school was set to 45 min.
2.3. Measure
Classroom Assessment Scoring System—Secondary Manual (CLASS-S) (Pianta et al., Citation2012) is used to score the quality of teacher–student interactions. Developmental theory and research focusing on the patterns of interactions between teachers and students form the theoretical foundations of the Teaching Through Interactions (TTI) framework which is the theoretical basis of the CLASS-S (Hafen et al., Citation2015; Hamre et al., Citation2013). The TTI framework operationalises interactions between teachers and students as grouped into three broad domains: Emotional support, classroom organisation, and instructional support. These domains are measured by 11 specific dimensions and one global measure of student functioning: Student engagement. Table provides an overview of the domains, dimensions, and the global measure. The CLASS-S is content-neutral, which means it is validated to be used across subjects.
Table 1. Descriptions of Classroom Assessment Scoring System Secondary domains and dimensions (Pianta et al., Citation2012)
CLASS-S dimensions are scored on a 7-point Likert scale, with 1–2 expressing low range, 3–5 expressing medium range, and 6–7 expressing high range. The videos were scored with two approaches. Firstly, each of the five lessons was scored in three cycles (i.e., every 15 min) for the 11 dimensions of CLASS-S and the global measure. For the five lessons, this resulted in 180 observation scores. Secondly, the same videos were scored every 5 min, resulting in nine scores for each of the 11 dimensions and the global measure. For the five lessons, the total of observation scores amounted to 540 in this data set. Total score is measured by calculating the mean score in the score units: 15-minute score analysis (1 + 2 + 3)/3 and for the five-minute score analysis (1 + 2 + 3 + 4 … +9)/9. The productivity dimension is selected for comparative analysis due to the greatest change in mean score across the dimensions and relevance to studying loss of instructional time.
The videos were scored by two researchers. One of the researchers is a certified CLASS-S trainer, whilst the other researcher attended systematic CLASS-S training, which included frequent and recurrent calibration sessions for reliability testing. Inter-rater reliability check with the two researchers resulted in an agreement of the coding above 80%, in accordance with the CLASS-S manual (Pianta et al., Citation2012). Cronbach’s α estimates for the CLASS-S dimensions in the analyses was calculated to be: α = .86. This indicates strong overall inter-item consistency.
2.4. Qualitative interview
A qualitative interview was conducted with the teacher who participated in the classroom observation of the present study. This was conducted to gain more depth and understanding of the teacher’s perceptions of the teacher–student interactions. The interview lasted 48 min and consisted of questions related to teaching practice and student learning. The teacher was asked questions about various aspects of teaching English as a foreign language. The recorded interview was transcribed into a data-processing software (NVivo). The interview data is analysed by the constant comparative method, through initial, focused and axial coding (Edmonds & Kennedy, Citation2017). The identified themes elaborated on the dimension of the CLASS-S (Pianta et al., Citation2012).
3. Results
3.1. Quality in teacher–student interactions
Descriptive statistics are presented in Table for both the 15-minute score analysis and five-minute score analysis. The mean scores range from 1.33 (negative climate) to 5.20 (behaviour management) for the 15-minute score analysis. Low scores on the negative climate dimension indicate low levels of negativity (e.g., anger, sarcasm) in the lessons. The mean scores are ranged from 1.20 (negative climate) to 5.53 (behaviour management) for the five-minute score analysis.
Table 2. Descriptive statistics for CLASS-S dimensions (fifteen-minute and five-minute score analysis)
When studying the quality of teacher–student interactions based on length of score cycles of the lessons, we find that some of the dimensions are placed in different ranges. The minimum score for positive climate is placed in the low-range (Min = 2.67) for 15-minute score analysis, whilst the minimum score for positive climate in the five-minute score analysis is more in the mid-range (Min = 3.44). Similarly, student engagement has a lower minimum score in the 15-minute score analysis (Min = 2.33) than in the five-minute score analysis (Min = 3.22). The biggest difference in mean score variation when using different score units is found in instructional learning formats (15-minute score analysis, M = 3.22; five-minute score analysis, M = 2.45). The dimension, analysis and inquiry, shows a mean score of 2.07 in the 15-minute score analysis while there is a drop in the score at the five-minute score analysis (M = 1.55). This shows that the five-minute score analysis maps lower quality in teacher–student interactions concerning facilitation of higher-order thinking skills, opportunities for novel application, and for the use of metacognition.
Bivariate product-moment correlations for the 15-minute observation score analysis are presented in Table . Eleven significant correlations are found. The strongest significant correlations at the p< .01 level are between productivity and negative climate (r = .99, p < .01); and positive climate and behaviour management (r = .97, p < .01).
Table 3. Correlations among CLASS-S dimensions (15-min score analysis)
Table presents the bivariate correlations of the five-minute score analysis. Eleven significant correlations are identified. The strongest positive significant correlations at the p < .01 level include: positive climate and teacher sensitivity (r = .97, p< .01); productivity and behaviour management (r = .97, p< .01); analysis and inquiry and quality of feedback (r = .96, p < .01), and analysis and inquiry and regard for adolescent perspectives (r = .94, p < .05). The highest significant negative correlation is found for negative climate and productivity (r = —.96, p < .05).
Table 4. Correlations among CLASS-S dimensions (five-minute score analysis)
3.2. Productivity
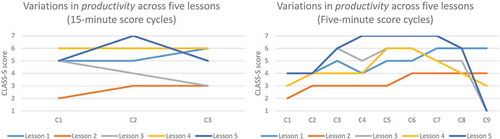
The five-minute score analysis elicited greatest extreme variation in the productivity dimension, and the results from this variable show that the teacher finishes the lesson prematurely at two instances (i.e., teacher ends the lesson 5-min early). The diagram on the left-hand side of Figure has 15-minute score analysis and is thus not particularly nuanced in terms of capturing changes in productivity across a teaching lesson. By contrast, from the diagram of five-minute score analysis on the right-hand side of Figure we see that the two lessons the teacher decides to finish five minutes early have a relatively high score compared to the other lessons in the sample. Productivity is also generally low at the start of lessons, indicating that some instructional time is lost. This raises the question if the teacher chooses to end the lesson due to student effort, or because tasks are managed before scheduled time.
Figure 1. Left: Variations in productivity across five lessons with scores every 15-min cycle. C1-C3 = Cycle 1 to Cycle 3. The CLASS-S scores are on a 1–7 Likert scale. Right: Variations in productivity across five lessons (five-minute scores). C1-C9 = Cycle 1 to Cycle 9. The CLASS-S scores are on a 1–7 Likert scale.
3.3. Interview with teacher
Time management is a central theme when analysing the interview transcripts. The teacher mentions overload in terms of work as negative for teaching. Lack of time is a central issue in terms of the teaching of reading and writing skills for this teacher.
How do you work with the following skills in English? If we start with reading?
We have so much to do in English. I’d wish that we had much more time. So, the reading we engage in with our students is mainly from the textbook, although we sometimes supplement from other texts in the book that we see fit with the learning goals. […]
How do you work with writing in English?
I have sinned a little in terms of the glossary tests. I haven’t emphasised glossary tests this year, and I’m beginning to wonder if I’ve made a fool of my self. I noticed it at the mock exam that some students have a weaker vocabulary than they should have had. […] But there just isn’t time. There isn’t more time to do more. All the texts have to be corrected, too.
4. Discussion
This study set out to examine the differences in quality of teaching and loss of instructional time when studying teacher–student interactions with two analytic video-score approaches. The five-minute score analysis produced a more accurate account of the phenomenon of study, instructional time, with the closer inspection of the productivity dimension of the CLASS-S. In keeping with previous research that has found that instructional time is often lost at the start of lessons (Saloviita, Citation2013), transitions (Arlin, Citation1979; Behar-Horenstein et al., Citation2006) or due to teacher absenteeism (Abadzi, Citation2007), this study found that some instructional time tended to be wasted at the start of lesson and transitions, yet that is not the most remarkable finding of this study. By contrast, this study found that instructional time was completely lost at the end of lessons on two occasions. In fact, the teacher ended the lessons early and students left the classroom. Five minutes might seem small but when time accumulates the total amount of time increases significantly and should not be trivialised (Saloviita, Citation2013), as there is evidence that greater allotted instructional time has a significantly positive impact on students’ academic achievements (Brophy & Evertson, Citation1976; Jez & Wassmer, Citation2015). The five-minute score analysis identified that when there was high productivity in the lesson, the lesson was finished early. This supports the notion of a teaching script in which teachers follow a script rather than aspects related to moments of contingency (Black & Wiliam, Citation2009). In the script notion, when the script is finished, the teacher is finished with the lesson.
The interview data elaborated on the findings from the video-observation data, particularly in terms of instructional time. Paradoxically, the analyses of the videos showed that learning time was lost in the five-minute score analysis whilst the teacher in the interview remarks that there was not enough time. These findings contrast earlier research that has found that teachers were more concerned with “time to kill” than time to be allocated with care (Arlin, Citation1979). It does, however, seem peculiar that the teacher mentions lack of time as a limiting factor when the lessons are finished too early twice. Classrooms with clear routines, attention, behavioural management and time use support students’ self-regulatory and functioning skills to learning and achievement (Emmer & Stough, Citation2001; Hamre et al., Citation2013; Pianta et al., Citation2012).
The five-minute score analysis revealed the lower quality of teacher–student interactions compared to the 15-minute score analysis. The two different analytic approaches to video-score analysis entailed different significant correlations, particularly regarding dimensions in the analysis and inquiry dimension. Whilst the analysis and inquiry dimension did not have any significant correlations in the fifteen-minute score analysis, the five-minute score analysis found significant positive correlations between analysis and inquiry and quality of feedback and regard for adolescent perspectives and instructional dialogue. These dimensions were not significantly correlated in the 15-minute score analysis. The analysis and inquiry dimension for the five-minute score analysis had a lower score than the 15-minute score analysis. This shows that attention to higher-order thinking skills might be useful to analyse at more frequent intervals. These findings seem to indicate the relevance of feedback dialogues that foster students’ higher order thinking and self-regulation, whilst at the same time focusing on the relevance of students’ perspectives. As such, the findings are consistent with studies that have explored the relationships of feedback with other dimensions of student learning in teaching English as a foreign language (Vattøy & Smith, Citation2019). Responsive pedagogy focuses on the recursive dialogue between students’ internal feedback and external feedback provided by significant others (Smith, Gamlem, Sandal, & Engelsen, Citation2016). However, lower-secondary studies focusing on teacher–student interactions have identified missed opportunities for responsive pedagogy, with low quality for important instructional support dimensions of the CLASS-S (Gamlem, Citation2019; Gamlem & Munthe, Citation2014).
5. Limitations
There are several limitations to address for the present study. The number of observations (n = five lessons) is small and deviations have greater impact with only one teacher in the sample. It is also important to consider the limitation of adapting a standardised observation manual, such as the CLASS-S manual, which is designed for a specific use. The CLASS-S is constructed to score quality aspects of instruction at every 15-20-minute cycle. The 11 dimensions and the global measure with their respective behavioural markers increases the cognitive load for the observer to score with a higher frequency. However, in our study, we used video-recorded observations, which provided flexibility in terms of managing each cycle and check inter-rater reliability.
Observation manuals are typically designed to match a studied phenomenon (Gregory & Mikami, Citation2015). To some extent, one could say that this requires researchers to use standardised tools as they are. However, studying new and different uses have the potential of highlighting other important aspect of classroom teaching. More frequent coding seems to have positive effects for smaller samples, as more observations increase the statistical possibilities of the data material, enabling the researcher to conduct more advanced analyses on a smaller sample of video material and on specific dimensions. Using a different observation tool can give different results. No observation system can accomplish all goals, and by focusing on any one activity or aspect of instruction others are likely to be lost (Harvey, Citation2006).
We also accept the limitation that the researcher’s presence when recording audio-visual data material in the classroom could potentially affect teacher and student behaviour (Curby, Johnson, Mashburn, & Carlis, Citation2016; Wragg, Citation1999). Filming five lessons of the same classroom over a period of 2 weeks was an effort to reduce this limitation. Classroom observation requires information processing on the behalf of the observer, which is often referred to as cognitive load (Joe, McClellan, & Holtzman, Citation2014). Issues related to cognitive load are reduced when using video observations (Pianta et al., Citation2012), as video-recorded events are neither ephemeral nor transient.
6. Conclusions
Five-minute score analysis seems to be useful to map nuances of quality aspects of teacher–student interactions. The present study has identified that scores for teacher–student interaction quality become more fine-masked when applying five-minute score analysis. Results show that five-minute observation analysis highlights other features of classroom interactions than 15-minute cycles when using the CLASS-S manual (Pianta et al., Citation2012). This becomes clear when investigating CLASS-S dimensions, such as productivity, as the five-minute analysis revealed that instructional time was completely lost at the end of lessons on two occasions. The study reveals that a higher scoring frequency has the potential of highlighting important aspects of teachers’ classroom management. This was also shown for analysis and inquiry and dimensions related to responsive pedagogy (Smith et al., Citation2016) which were significantly correlated in the five-minute score analysis. This further indicates that teachers need insights into how they can facilitate for students’ self-regulated learning (Zimmerman, Citation1990).
Classroom teaching is complex, and observation manuals are designed and focused on measuring specific aspects. Finding new trajectories into systematic observation of classroom interactions have the potential of casting new light on what remains hidden in our present understanding. Therefore, further research is needed to examine other dimensions’ suitability for five-minute score analysis and identifying successful characteristics for including certain dimensions while excluding others. Instructional time loss has serious implications for the total amount of time that students are involved in learning activities. Larger and more encompassing studies are needed to investigate possible patterns for instructional time loss and its consequences for student learning and wellbeing. Nonetheless, the paradox in the relationship between instructional time loss and teachers’ own perception of time management is an important concern emphasised by the present study.
Declarations of interest
none.
Additional information
Funding
Notes on contributors
Kim-Daniel Vattøy
Kim-Daniel Vattøy is a PhD Candidate at Volda University College, Norway. His main research interests include assessment, systematic observation, English as a foreign language, self-regulated learning, self-efficacy, and teacher education research.
Siv M. Gamlem
Siv Måseidvåg Gamlem is a Professor in Pedagogy at Volda University College, Norway. Research interests are connected to assessment, feedback, and learning processes in education.
Related Research Data
References
- Abadzi, H. (2007). Absenteeism and beyond: Instructional time loss and consequences. Policy research working paper, 4376. doi:10.1596/1813-9450-4376
- Abadzi, H. (2009). Instructional time loss in developing countries: Concepts, measurement, and implications. The World Bank Research Observer, 24(2), 267–15. doi:10.1093/wbro/lkp008
- Allen, J., Gregory, A., Mikami, A., Lun, J., Hamre, B. K., & Pianta, R. C. (2013). Observations of effective teacher-student interactions in secondary school classrooms: Predicting student achievement with the classroom assessment scoring system - secondary. School Psychology Review, 42(1), 76–98.
- Arlin, M. (1979). Teacher transitions can disrupt time flow in classrooms. American Educational Research Journal, 16(1), 42–56. doi:10.3102/00028312016001042
- Behar-Horenstein, L. S., Isaac, C. A., Seabert, D. M., & Davis, C. A. (2006). Classroom instruction and the loss of instructional time: A case study. Education and Society, 24(3), 83–99. doi:10.7459/es/24.3.06
- Bell, C. A., Dobbelaer, M. J., Klette, K., & Visscher, A. (2019). Qualities of classroom observation systems. School Effectiveness and School Improvement, 30(1), 3–29. doi:10.1080/09243453.2018.1539014
- Black, P., & Wiliam, D. (2009). Developing the theory of formative assessment. Educational Assessment, Evaluation and Accountability, 21(1), 5–31. doi:10.1007/s11092-008-9068-5
- Brophy, J. E., & Evertson, C. M. (1976). Learning from teaching: A developmental perspective. Boston: Allyn and Bacon.
- Brown, B. W., & Saks, D. H. (1986). Measuring the effects of instructional time on student learning: Evidence from the beginning teacher evaluation study. American Journal of Education, 94(4), 480–500. doi:10.1086/443863
- Cash, A. H., Bradshaw, C. P., & Leaf, P. J. (2015). Observations of student behavior in nonclassroom settings: A multilevel examination of location, density, and school context. The Journal of Early Adolescence, 35(5–6), 597–627. doi:10.1177/0272431614562835
- Connor, C. M., Morrison, F. J., & Slominski, L. (2006). Preschool instruction and children’s emergent literacy growth. Journal of Educational Psychology, 98(4), 665–689. doi:10.1037/0022-0663.98.4.665
- Curby, T. W., Johnson, P., Mashburn, A. J., & Carlis, L. (2016). Live versus video observations: Comparing the reliability and validity of two methods of assessing classroom quality. Journal of Psychoeducational Assessment, 34(8), 765–781. doi:10.1177/0734282915627115
- Cushing, L. S., Horner, R. H., & Barrier, H. (2003). Validation and congruent validity of a direct observation tool to assess student social climate. Journal of Positive Behavior Interventions, 5(4), 225–237. doi:10.1177/10983007030050040601
- Edmonds, W. A., & Kennedy, T. D. (2017). An applied guide to research designs: Quantitative, qualitative, and mixed methods (2nd ed.). London: Sage.
- Emmer, E. T., & Stough, L. M. (2001). Classroom management: A critical part of educational psychology, with implications for teacher education. Educational Psychologist, 36(2), 103–112. doi:10.1207/S15326985EP3602_5
- Erickson, F. (2006). Definition and analysis of data from videotape: Some research procedures and their rationales. In J. Green, G. Camilli, & P. B. Elmore (Eds.), Handbook of complementary methods in education research (pp. 177–189). Mahwah, NJ: Lawrence Erlbaum.
- Ferguson, R. F., & Danielson, C. (2014). How framework for teaching and Tripod 7Cs evidence distinguish key components of effective teaching. In T. Kane, K. Kerr, & R. C. Pianta (Eds.), Designing teacher evaluation systems: New guidance from the measures of effective teaching project (pp. 98–143). San Francisco, CA: Jossey-Bass.
- Gamlem, S. M. (2019). Mapping teaching through interactions and pupils’ learning in mathematics. SAGE Open, 9(3), 2158244019861485. doi:10.1177/2158244019861485
- Gamlem, S. M., & Munthe, E. (2014). Mapping the quality of feedback to support students’ learning in lower secondary classrooms. Cambridge Journal of Education, 44(1), 75–92. doi:10.1080/0305764X.2013.855171
- Good, T. L., & Grouws, D. A. (1977). Teaching effects: A process-product study in fourth-grade mathematics classrooms. Journal of Teacher Education, 28(3), 49–54. doi:10.1177/002248717702800310
- Gregory, A., & Mikami, A. Y. (2015). Systematic observation of early adolescents in educational settings: The good, the bad, and the ugly. The Journal of Early Adolescence, 35(5–6), 714–721. doi:10.1177/0272431615580772
- Grossman, P., Greenberg, S., Hammerness, K., Cohen, J., Alston, C., & Brown, M. (2009). Development of the Protocol for Language Arts Teaching Observation (PLATO). Paper presented at the American Educational Research Association, San Diego, CA.
- Hafen, C. A., Hamre, B. K., Allen, J. P., Bell, C. A., Gitomer, D. H., & Pianta, R. C. (2015). Teaching through interactions in secondary school classrooms: Revisiting the factor structure and practical application of the classroom assessment scoring system – secondary. The Journal of Early Adolescence, 35(5–6), 651–680. doi:10.1177/0272431614537117
- Hamre, B. K., Pianta, R. C., Downer, J. T., DeCoster, J., Mashburn, A. J., Jones, S. M., … Rivers, S. E. (2013). Teaching through interactions: Testing a developmental framework of teacher effectiveness in over 4,000 classrooms. The Elementary School Journal, 113(4), 461–487. doi:10.1086/669616
- Hardman, F., & Hardman, J. (2017). Systematic observation: Changes and continuities over time. In R. Maclean (Ed.), Life in schools and classrooms (pp. 123–137). Singapore: Springer.
- Harvey, P. (2006). Improving teaching observation practice in the learning and skills sector: A literature review. Norwich, UK: City College Norwich.
- Hiebert, J., & Grouws, D. A. (2007). The effects of classroom mathematics teaching on students’ learning. In F. K. Lester (Ed.), Second handbook of research on mathematics teaching and learning (Vol. 1, pp. 371–404). New York, NY: Information Age Publishing.
- Hill, H. C., & Grossman, P. (2013). Learning from teacher observations: Challenges and opportunities posed by new teacher evaluation systems. Harvard Educational Review, 83(2), 371–384. doi:10.17763/haer.83.2.d11511403715u376
- Jez, S. J., & Wassmer, R. W. (2015). The impact of learning time on academic achievement. Education and Urban Society, 47(3), 284–306. doi:10.1177/0013124513495275
- Joe, J. N., McClellan, C. A., & Holtzman, S. L. (2014). Scoring design decisions: Reliability and the length and focus of classroom observations. In T. J. Kane, K. A. Kerr, & R. C. Pianta (Eds.), Designing teacher evaluation systems: New guidance from the measures of effective teaching project (pp. 415–442). San Francisco, CA: Jossey-Bass.
- Medley, D., Soar, R., & Coker, H. (1983). The minimum conditions for valid evaluation of teacher performance. The Journal of Classroom Interaction, 19(1), 22–27.
- O’Leary, M. (2014). Classroom Observation: A guide to the effective observation of teaching and learning. London: Routledge.
- Pianta, R. C., Hamre, B. K., & Mintz, S. (2012). Classroom Assessment Scoring System (CLASS): Secondary manual. Charlottesville, VA: Teachstone.
- Pianta, R. C., La Paro, K. M., & Hamre, B. K. (2008). The classroom assessment scoring system: Pre-K manual. Baltimore, MD: Brookes.
- Saloviita, T. (2013). Classroom management and loss of time at the lesson start: A preliminary study. European Journal of Educational Research, 2(4), 167–170. doi:10.12973/eu-jer.2.4.167
- Smith, K., Gamlem, S. M., Sandal, A. K., & Engelsen, K. S. (2016). Educating for the future: A conceptual framework of responsive pedagogy. Cogent Education, 3(1), 1227021. doi:10.1080/2331186X.2016.1227021
- Solheim, K., Ertesvåg, S. K., & Dalhaug Berg, G. (2018). How teachers can improve their classroom interaction with students: New findings from teachers themselves. Journal of Educational Change, 19(4), 511–538. doi:10.1007/s10833-018-9333-4
- Vattøy, K.-D., & Smith, K. (2019). Students’ perceptions of teachers’ feedback practice in teaching English as a foreign language. Teaching and Teacher Education, 85, 260–268. doi:10.1016/j.tate.2019.06.024
- Woolfolk Hoy, A., & Weinstein, C. S. (2006). Student and teacher perspectives on classroom management. In C. M. Evertson & C. S. Weinstein (Eds.), Handbook of classroom management: Research, practice and contemporary issues (pp. 181–219). Mahwah, NJ: Lawrence Erlbaum.
- Wragg, T. (1999). An Introduction to Classroom Observation. London: Routledge.
- Zimmerman, B. J. (1990). Self-regulated learning and academic achievement: An overview. Educational Psychologist, 25(1), 3–17. doi:10.1207/s15326985ep2501_2