
 ?Mathematical formulae have been encoded as MathML and are displayed in this HTML version using MathJax in order to improve their display. Uncheck the box to turn MathJax off. This feature requires Javascript. Click on a formula to zoom.
Abstract
This study is the first to investigate and validate the psychometric properties of an Indonesian translation of the Student Performance Opportunity of Competence Development (SPOCD) questionnaire that covers five key competencies related to the mathematics learning process, namely: (1) thinking; (2) relating to others; (3) using language, symbols and text; (4) managing self, and; (5) participating and contributing. The SPOCD questionnaire comprises 30 items, with a 5-point Likert scale. A total of 1413 Indonesian high-school students (46.4% male, 53.6% female) from three regions (eastern, western and central Indonesia), aged from 16 to 19 years and ranging from the 10th to the 12th grade, completed the SPOCD questionnaire. A Rasch rating scale model (RSM) and confirmatory factor analysis were applied to evaluate the psychometric characteristics and factor structure of the SPOCD questionnaire. The results indicated that assumptions of unidimensionality, local independence and monotonicity of the SPOCD questionnaire were met. In the Rasch RSM assessment, the SPOCD questionnaire response set worked well, matched the threshold estimates and functioned as an appropriate model for the response categories. The SPOCD questionnaire showed excellent psychometric characteristics for use in measuring the development of competence in middle school students in Indonesia.
PUBLIC INTEREST STATEMENT
The research investigates the psychometric properties of the Indonesian translation of the Student Perception of Opportunity Competence Development (SPOCD) Questionnaire in a middle education context. This is done within the framework of Rasch measurement models and Confirmatory factor analysis. These models where chosen as they set strict standards for measurement quality. The study is the first validity study of these questionnaire. The findings from this study indicated that the items in the SPOCD questionnaire were generally adequate and appropriate for the measurement of opportunities for competence development in mathematics as perceived by Indonesian students. The findings from this study should help to facilitate use of the SPOCD questionnaire in future educational evaluation studies and encourage awareness, understanding and use of the scale among students, teachers, and decision-makers. Although the current study focused on the SPOCD questionnaire, the same method may be used to assess and validate other educational performance assessment scales.
1. Introduction
With a population of around 271 million people, Indonesia is the fourth largest country in terms of population in the world, on 17,000 islands with more than 200 ethnic groups speaking 300 different languages/dialects (Worldometers, Citation2019). Such a diverse pattern of population demographics closely relates to differences in student academic performance. The underperformance of Indonesian students in international assessment programs has become a cause for concern and provided an impetus to calls for major national education reform (Wihardini, Citation2016). One cause of this underperformance is low performance related to poor mathematical competencies found in large-scale assessments and in computer-based national exams for Indonesian students, where mathematics has been reported as being “too hard” from the student perspective (Swaragita, Citation2018; Zulkardi, Putri, & Wijaya, Citation2019). There is a high cost to low educational performance, especially in Indonesia, despite the efforts of so many involved in education to improve education performance.
Addressing deficiencies in mathematical competencies has become a growing concern of the Indonesian government, following the implementation of a competence-based curriculum in 2004 by the Indonesian Ministry of National Education. However, despite wishing to promote mathematical literacy, when the Indonesian government changed the educational curriculum in 2013, competency development in mathematics education was not subject to investigation, specifically when related to student perceptions in the context of the mathematics learning process. This situation reveals a shortcoming in the Indonesian educational curriculum, especially when compared to many other countries.
One interesting approach to competency development was put forward by the Ministry of Education in New Zealand concerning the New Zealand education curriculum (Ministry of Education of New Zealand, Citation2007), where five key competencies were identified, namely: thinking; using language, symbols, and texts; managing self; relating to others; and participating and contributing. These key competencies were not simply a New Zealand Ministry of Education proposal, but had been adapted from an Organization for Economic Cooperation and Development project, and many other countries have their own version, meaning there was already a rich research base and a wealth of practical ideas that New Zealand could draw on (Ministry of Education, New Zealand, Citation2015).
These five key student competencies are developed through the learning process when applying various learning strategies, learning models and assessment techniques that are appropriate to the subject matter. In the learning process, teachers organize the learning environment so that students can interact with each other, with teachers and with the learning resources. Students can discuss issues and conduct self-monitoring in order to be able to understand the mathematics material well. The quality of the learning process is key to improving student competency, and any classroom learning activity can help students learn and influence their competencies (Brown, McNamara, Hanley, & Jones, Citation1999).
Previous studies have also examined mathematical competencies, including these five competencies. Theorizing has occurred on how competence with written mathematical symbols develops (Hiebert, Citation1988). Mathematical thinking was explored within the context of the Scottish Curriculum for Excellence reform (Hudson, Henderson, & Hudson, Citation2014). More specifically, it has been claimed that mathematics self-efficacy can be thought of as part of one of the key five competencies, managing self, which is “associated with self-motivation, a ‘can-do’ attitude, and with students seeing themselves as capable learners” (Bonne & Lawes, Citation2016). How the competency “relating to others” can be applied has been explored among New Zealand students (Tait-McCutcheon, Citation2014). Furthermore, another study has analyzed the collective learning process occurring in the classroom in terms of the evolution of classroom mathematical practices (Cobb, Stephan, McClain, & Gravemeijer, Citation2001). These studies have illustrated the importance of certain key competencies in the mathematical context.
However, these competencies, specifically the five key competencies previously identified, have never been measured in students in Indonesia especially in the context of mathematics learning, due to the unavailability of relevant instruments. The availability of appropriate and readily usable measuring instruments is very important because of Indonesia’s vast geographical area and the distance between large cities and remote areas. It is also essential that any potential instruments can be used by mathematics teachers in Indonesia, which precludes the use of English-language instruments as teachers in Indonesia are generally not required to speak English, especially in remote areas.
Although this kind of measurement has never been undertaken with Indonesian students and there are few measurement instruments available, we identified an appropriate measurement tool that measures the same competencies as classified in the New Zealand Education curriculum, and also an appropriate context-based measure, for mathematics. To assess the development of student competence in terms of the five key competencies in learning mathematics, a Student Perception of Opportunity Competence Development (SPOCD) questionnaire was adopted for use. The five key competencies provided the scale factors of the SPOCD questionnaire for measuring students’ perceptions of development opportunities concerning mathematics competence. Although various reports have discussed research using the SPOCD questionnaire instrument, the validity of the SPOCD questionnaire in evaluating the five key competencies has not been assessed. This study is the first to address this gap. We adapted the SPOCD questionnaire for use in the Indonesian language, and sought to validate the SPOCD questionnaire and to assess its factor structure, as well as its psychometric characteristics, for the first time.
The psychometric evaluation of this type of instrument has typically been conducted using classical test theory. However, within the psychological sciences and for educational measurement, there has been a growing shift to using modern test theory, such as item response theory and the Rasch measurement model (Kean, Brodke, Biber, & Gross, Citation2018). A Rasch measurement model allows for investigation of many aspects of a measure. These include the response format, the fit of individual items and persons, dimensionality, local independence testing and the use of Wright maps (Andrich & Marais, Citation2019). A key feature of this model is the notion of parameter separation for the person and item estimates, which allows users to compare persons and items directly without reference to each other (Wright, Citation1968; Wright & Masters, Citation1982). Furthermore, many studies, while using confirmatory factor analysis (CFA) to validate the factor structure of a scale (Flora & Flake, Citation2017), have also used Rasch analysis “as a contrasting statistical approach” (Allison, Baron-Cohen, Stone, & Muncer, Citation2015). Given that CFA allows for formal statistical tests of multiple aspects of hypothesized models and provides a strong empirical basis concerning the factor structure of a model (Brown, Citation2015), we considered that a combination of both methods would provide relevant information on the psychometric characteristics of the SPOCD questionnaire from differing perspectives.
Consequently, the aim of this study was to investigate the dimensionality or factor structure and measurement properties of the SPOCD questionnaire, using both modern psychometrics analysis, such as CFA, and item and sample independent models, such as Rasch models. As a result of this study, we hope that the SPOCD questionnaire may subsequently be used directly by teachers to measure student perceptions of their mathematics competence without concern for the validity, reliability and score interpretative quality of the SPOCD questionnaire.
1.1. The student performance opportunity of competence development (SPOCD) questionnaire
The SPOCD questionnaire was developed at Curtin University, Australia, as an instrument to measure students’ perceptions of competency development in the learning process of mathematics, although no publications have as yet resulted concerning its development. The SPOCD questionnaire covers 5 competencies, namely: (1) thinking: involving the use of creative and critical processes to make sense of information, experiences, and ideas; (2) relating to others: that is, listening actively, recognizing different points of view, negotiating and sharing ideas; (3) using language, symbols and text: concerning how students make meaning—how they express and communicate our ideas, experiences, and information using a rich mix of language, symbols and texts, including spoken and written language, visual language such as photos and video, the symbols used in mathematics and much more; (4) managing self: that is, being self-motivated, having a can-do attitude, and understanding oneself as a learner, and; (5) participating and contributing: including contributing in a group, making connections with others and creating opportunities for others in a group (Ministry of Education, New Zealand, Citation2007, Citation2015; Tait-McCutcheon, Citation2014).
Each competency consists of 6 items, evaluated using a 5-point Likert scale (see Appendix A for item wording). The response options are almost never, seldom, sometimes, often and almost always. In this study, we assumed that all the SPOCD questionnaire items together would constitute a single construct, which we termed opportunity for competence development. This construct allowed for a bipolar dimension (less-more), with a single line representing a single (unidimensional) construct, with the relevant person located at some point along the line. This approach enables a global score from the SPOCD questionnaire to be produced that can be understood by mathematics teachers throughout Indonesia for use as an evaluation and diagnostic tool. Higher scores would indicate that the students perceived greater opportunities to develop competence in the mathematics learning context.
The SPOCD questionnaire was translated into Bahasa (an Indonesian language). The translation process complied with the standards set by International Test Commission Guidelines for Test Adaptation (International Test Commission, Citation2018). The original English version of the SPOCD questionnaire used in this study was translated into Bahasa by two qualified translators who are Indonesian and lecturers at our university. They are fluent in English and have post graduate degrees from Australian universities. The Bahasa version of the SPOCD questionnaire was then translated back into English by English native translators. A committee of experts, comprising the first author and two lecturers fluent in English with more than 15 years of teaching experience, reviewed the original English versions, the English back translation, and the Bahasa versions of the SPOCD questionnaire in order to confirm an agreed and acceptable translation of the SPOCD questionnaire. The questionnaires were in paper-and-pencil format. Participation was voluntary and the purpose of the study was stated in a letter that accompanied the questionnaires. Participating persons were required to sign the informed consent form, also attached to the questionnaire.
2. Methods
2.1. Participants
Respondents for this study comprised 1413 (46.4% male, 53.6% female) high school students from six types of school in Indonesia, namely: public high schools (SMAN; sekolah menengah atas negeri), private high schools (SMAS; sekolah menengah atas swasta), public vocational high schools (SMKN; sekolah menengah kejuruan negeri), private vocational high schools (SMKS; sekolah menengah kejuruan swasta), public Islamic high schools (MAN; madrasah Aliyah negeri), and private Islamic high schools (MAS; madrasah Aliyah swasta). Samples were taken using nonprobability sampling methods. These respondents came from 12 of 34 provinces in Indonesia that covered three region: central Indonesia (Bali, East Kalimantan, South Sulawesi), western Indonesia (Daerah Khusus Ibukota Jakarta, Banten, Lampung, West Java, Central Java, Jambi, West Kalimantan), eastern Indonesia (Maluku, North Maluku). Table provides their socio-demographic characteristics.
Table 1. Demographic characteristics of the sample (N = 1413)
2.2. The rasch model
The probabilistic model proposed by Rasch (Citation1960) revolutionized psychometrics (Mair, Citation2018). The Rasch model is an advanced measurement approach, which is able to overcome some limitations of classical test theory, such as a lack of control over the difficulty level of scale items and appropriate ordering of ordinal response categories (Mitchell-Parker, Medvedev, Krageloh, & Siegert, Citation2018). Although mathematically simple, it is extremely effective in terms of measurement, and can be used when constructing a scale that meets the highest standards of measurement (Mair, Citation2018). Rasch measurement models, such as the Rasch rating scale model (RSM) and the dichotomous Rasch model, are distinguished from other latent trait models by a fundamental statistical characteristic, namely, separable person and item parameters; thus providing a more complete set of statistical data. This feature makes possible “specifically objective” comparisons of persons and items, enabling comprehensive measurement (Masters & Wright, Citation1984).
The Rasch RSM is appropriate for assessing polytomous data using a rating scale, as employed in this study (Andrich, Citation1978). Where applicable, a response rating scale yields ordinal data that need to be transformed into an interval scale to be useful. A Rasch RSM generally follows the equation:
where is the probability that person n on encountering item i would be observed in category k,
is the probability that person n would be in category
,
is the latent ability level of person n,
is the difficulty of item i (difficulty for respondents to endorse the item) and
is the probability of being observed in category k relative to category
. In this study, estimates of item difficulty (
) and respondent trait level (
) were expressed on a scale of log odd ratios or logits. The average logit was arbitrarily set at 0, with positive logits indicating higher than average estimates and negative logits lower than average estimates. A threshold indicates the location on the trait level scale at which a respondent had a 50/50 chance of choosing a higher category than the current one (Luo et al., Citation2009).
A Rasch RSM requires tenable assumptions for accurate estimation, including (1) construct unidimensionality, (2) local independence, and (3) a monotonic scale (that is, higher scores refer to higher levels of the latent construct) (de Ayala, Citation2009). In addition, a Rasch RSM requires that the rating scale categories increase in line with endorsement difficulty, and that the thresholds for each item are ordered (DiStefano & Morgan, Citation2010).
2.3. Data analyses
2.3.1. Confirmatory factor analysis (CFA)
A CFA model specifies how the observed variables are related to the latent variables. CFA is one type of structural equation model and provides a powerful method for testing a variety of hypotheses about a set of measured variables (Flora & Curran, Citation2004). In this study, the factorial structure of the translated version of the SPOCD questionnaire was tested using CFA. We investigated three hypothesized models, namely, first-order, five-factor and higher-order models of the SPOCD questionnaire. Analysis was conducted with Mplus version 8.3 (Muthén & Muthén, Citation1998/2017), using the weighted least squares mean and variance corrected estimator.
Several indices for goodness-of-fit were used in this study to check the adequacy of the hypothesized models. The chi-square test were used to evaluate the individual model, and the standardized root mean squared residual (SRMR) and the root mean square error of approximation (RMSEA) (Browne & Cudeck, Citation1993) were used to estimate the lack of fit in the model compared with a perfect model. The larger the value the greater the misspecification, as an RMSEA value of less than 0.05 is considered indicative of an adequate fitting model and smaller values for the SRMR are associated with better fitting models, with scores below 0.05 considered as evidence of good fit (Maydeu-Olivares & Joe, Citation2014). Finally, an incremental fit index measure, namely, the comparative fit index (CFI) (Bentler, Citation1990) was also employed. The CFI enabled a comparison to be made of the fit between the specified model and a null model. For the CFI, a value of .90 is generally considered to indicate an acceptable model (Hu & Bentler, Citation1999).
2.3.2. Rasch analysis
An analysis was conducted employing the Rasch RSM to calibrate the SPOCD questionnaire items, using the Winsteps (v. 3.65) statistical package (Linacre, Citation2008). Person and item parameters were estimated using joint maximum likelihood estimation. In order to establish the psychometric properties of each of the subscales, the following analyses were performed: (1) an analysis of the dimensionality of each version to check for expected unidimensionality in the Rasch RSM using principal component analysis of the residuals (PCAR); (2) local independence assumption testing using the Q3 statistic; (3) a verification of the fit of each of the questions to the model, taking into account the mean squares (MNSQ) statistics when using the Rasch RSM; (4) a verification of the adequacy of the response categories to establish the functioning of their order and their rating scale discrimination; (5) a verification of reliability for persons and items, and; (6) a construction of a graphical representation using a Wright map and data concerning the test information function of the scales.
3. Results
3.1. Confirmatory factor analysis
The fit indices of the unidimensional, five-dimensional, and higher order models were compared using the entire sample. Results of the CFA indicated that the higher order factor model fit the data reasonably well [χ2 (400) = 1397.144, p < 0.001; RMSEA = 0.042 (90% CI = 0.040–0.044), CFI = 0.905, SRMR = 0.038] compared to the unidimensional model [χ2 (405) = 1742.349, p < 0.001; RMSEA = 0.048 (90% CI = 0.046–0.051), CFI = 0.873, SRMR = 0.042] and the five-factor model [χ2 (405) = 4681.959, p < 0.001; RMSEA = 0.086 (90% CI = 0.084–0.089), CFI = 0.592, SRMR = 0.245]. Thus, the results indicated that the higher order model, composed of five first-order competency factors (thinking; relating to others; using language, symbols and text; managing self; and participating and contributing) and a single second-order competency factor were satisfactory and provided alternative representations of the underlying structure of our construct. All items loaded significantly (ranging from 0.48 to 0.92) in relation to their respective competency factors, at a p < 0.01 significance level.
3.2. Dimensionality
In testing the unidimensionality assumption of the measuring instrument used, PCAR was performed (Chou & Wang, Citation2010; Smith, Citation2002). The measurement model of the SPOCD questionnaire proved to be unidimensional. Therefore, the results of this analysis confirmed that the Rasch RSM assumption of unidimensionality had been met, and that further analysis was worthwhile. According to PCAR, it can be concluded that a test only measures a dimension when the minimum variance explained by the measure is >30% (Linacre, Citation1998). The test employed here showed a single dimension (unidimensionality), as values above 35.6% (16.6 in eigenvalues unit) of the variance explained by the measure were found. This finding is in line with the results concerning the factor structure following CFA analysis, as noted earlier.
3.3. Local independence
The Rasch RSM is based on the specification of “local independence”. Local independence means that, for a given examinee or examinees of a given proficiency level, the performance on one item is independent of the performance on another item (Mair, Citation2018). After the assumption of unidimensionality was shown to have been met, the assumption of local independence was tested using the Q3 statistic (Yen, Citation1984). When using Q3 statistic index criteria in which it is specified that the raw residual correlation between pairs of items is never > 0.30 (Christensen, Makransky, & Horton, Citation2017; Das Nair, Moreton, & Lincoln, Citation2011) no items were found to have local dependence. The items that had the highest raw residual correlations were items 29 and 30, each at 0.28, which is < 0.30. In other words, the assumption of local independence in this study was met.
3.4. Item fit
Item fit measures such as infit and outfit MNSQ statistics can also be used to determine how well each item contributes to defining one common construct as evidence of scale unidimensionality. An infit or outfit MNSQ value of 1 is considered ideal according to Rasch RSM specifications, and values in the range of 0.5–1.5 are effective for measurement (Andrich & Marais, Citation2019; Bond & Fox, Citation2015).
All 30 items of the SPOCD questionnaire, using infit and outfit MNSQ statistics, were found to be in the acceptable range (0.5–1.5). In addition, the point measure correlation range for the SPOCD questionnaire ranged from 0.44 to 0.74, as set out in Table , indicating that all the items had moved in one direction (Bond & Fox, Citation2015). This result further supported the findings of the Rasch RSM in this study. In general, Rasch item-fit statistics supported the SPOCD questionnaire scale’s unidimensionality.
Table 2. Rasch item statistics of the SPOCD: Item measure order
3.5. Rating scale diagnostics
In practice, most rating scales tend to be unequally spaced instead of conforming to the assumption of equal spacing between points in a response set. Rasch measurement diagnostics were used to evaluate how well the SPOCD questionnaire’s response set functioned to create an interpretable measure (Kim & Kyllonen, Citation2006). For each item, we examined the number of endorsements, the shape of the distribution of endorsements, and the MNSQ statistics of each response for the SPOCD questionnaire (Table ).
Table 3. Rating scale diagnostic table
As presented in Table , the distribution of the observed frequencies was negatively skewed, with no more than 7% of the total endorsements falling into the first category (almost never). However, there was no threshold disordering because the thresholds were ordered from negative to positive. This conclusion was supported further with none of the infit and outfit MNSQ measures being greater than 2 (Linacre, Citation2010), indicating that no noise was introduced into the measurement process. Based on this information, we concluded that the SPOCD questionnaire’s response set functioned well.
Results of the analysis of the scale are presented graphically in Figure to represent the category response function of the SPOCD questionnaire. The graph shows the recommended pattern, where each scale competency was linked to the most probable response at each ability level. In summary, the analysis indicated that the overall rating scale functioned appropriately.
Figure 1. Category response curve of all SPOCD items
3.6. Reliability
In the Rasch RSM, reliability is estimated for both persons and items. The person separation reliability (Wright & Masters, Citation1982), which estimates how well the instrument differentiates persons on the measured variable, was 0.91 for the SPOCD questionnaire. The person separation index for estimating the spread of persons on the measured variable was 3.17, expressed in standard error units. This value indicated good separation among persons. Reliability and separation for items, estimated in the same manner as for persons, were 0.99 and 10.56, respectively, indicating excellent psychometric characteristics for the SPOCD questionnaire. A separation index criterion of 1.5 is considered sufficient to carry out an individual level analysis and a magnitude of > 2.5 is considered sufficient to conduct a comparative analysis at the group level (Tennant & Conaghan, Citation2007); and these criteria were met in this study.
3.7. Wright map
To investigate the sixth research question, we evaluated the items in the SPOCD questionnaire to determine which behaviors were “harder” for students to endorse. Calibrated scores for both person and items in relation to the opportunity for mathematics competence development construct are provided in Figure , plotted using a Wright map (Wilson & Draney, Citation2002). A Wright map combines basic construct map concepts with a Rasch RSM to produce an effective map for interpreting the results of measurements undertaken. In such a map, the overall results between persons and items can be easily compared. The Wright map depicting the results of the Indonesian version of SPOCD questionnaire can be seen in Figure .
Figure 2. Wright Map of SPOCD Questionnaire representing direct comparsion of person dispersion and item distribution
From Figure , it is clear that the least endorsed item was 17: Pekerjaan yang saya lakukan dalam pembelajaran matematika ditampilkan di dalam kelas dalam bentuk grafik, poster, dan bentuk lainnya (Work that I do in mathematics is displayed around the room on charts, posters and in other ways)”. In contrast, the most endorsed item was 29: “Saya bekerja dalam kelompok matematika, dengan teman sebangku, dan teman sekelas (I sometimes work in a mathematics group, sometimes with a partner and sometimes with the whole class)”. The mean person measure value was 0.43 [standard deviation (SD) = 0.74], suggesting that the average student’s opportunity for competence development in mathematics was higher than the average level of item difficulty of the scale (zero). Furthermore, the person distribution spread ranged from −1.70 to 5.86, which exceeded the item difficulty range (−0.79 to 0.56).
3.8. Test information function
Once the relevant information has been determined for each item, it is of considerable interest to find the point along the ability scale at which a test provides the most precise measure of ability. The test information function (TIF) θ is simply the sum of the individual item information functions (Doran, Citation2005), and the TIF of the scale can be seen in Figure , below:
Figure 3. Test information function of SPOCD Questionnaire. This shows the Fisher information for the test (set of items) on each point along the latent variable. The test information function reports the “statistical information” in the data corresponding to each score or measure on the complete test
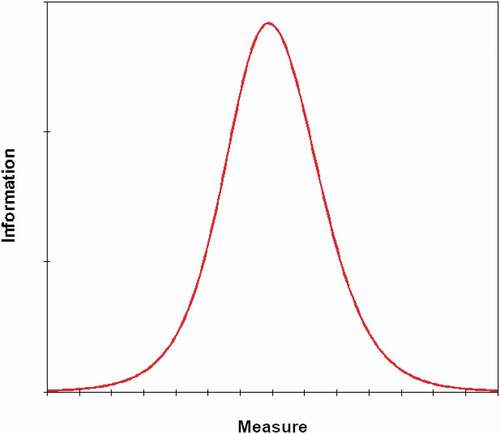
Figure shows a graph concerning the measurement information function of the SPOCD questionnaire. The findings for SPOCD questionnaire indicated that the highest information function was at the moderate opportunity level for competence development, with the information obtained from the measurements being considerable. At a high opportunity level for competence development, the information obtained from the measurements was relatively low, as was the latent trait level. These results showed that the SPOCD questionnaire produced optimal information when given to individuals with moderate trait levels.
4. Discussion and conclusion
The need for more effective competence development measures has increased. In this study, we used the Rasch RSM and CFA to assess and validate the SPOCD questionnaire. The findings from this study indicated that the items in the SPOCD questionnaire were generally adequate and appropriate for the measurement of opportunities for competence development in mathematics as perceived by Indonesian students. The Rasch RSM proved particularly useful in assessing the SPOCD questionnaire and in validating it. In addition, the investigation of the construct validity of the SPOCD questionnaire using CFA provided evidence of a higher-order dimensionality structure of the scale after comparing the quality of goodness-of-fit indices with one- and five-factor models.
The results of validation analyses using Rasch RSM indicated that the SPOCD questionnaire had acceptable item and person reliability. Even a perfectly unidimensional scale will not be useful in practice if the resultant scale score has unacceptably low reliability (Gerbing & Anderson, Citation1988); acceptable Rasch reliabilities of the SPOCD questionnaire can make the scores useful in practice. The SPOCD questionnaire also demonstrated responsiveness to competence developmental change and was able to differentiate between students giving differing levels of responses. The Rasch RSM analysis offered further support to these findings through an additional analysis of the performance of each item and response category of the SPOCD questionnaire. The Rasch RSM assessment indicated that all the SPOCD questionnaire items had acceptable infit and outfit MNSQ statistics, suggesting that, in general, the SPOCD questionnaire items were consistent with the measurement of a single underlying construct. The CFA results supported a similar conclusion, as the higher order model fit to the data reasonably well.
Person measures from Rasch analysis are the single score representing opportunities for competence development in mathematics. A researcher can convert the total ordinal scores into interval-level data based on person estimates of the Rasch model (Andrich & Marais, Citation2019); Indonesian teachers have had guidelines on and were trained to carry out such conversions since the mid-1970s by the Ministry of Education and Culture, Republic of Indonesia (Nasoetion et al., Citation1976). Although the original conceptual of the Rasch model and the results of our analyses support the use of the SPOCD to produce a single score, some researchers may wish to produce separate scores for the five subscales. The good psychometric properties of the higher order CFA model of SPOCD that was taking account of individual subscales as a first order factor suggests that it would be reasonable to use the subscales factor scores if needed (cf. Brown & Croudace, Citation2015). However, it should be noted that the scores generated from the CFA (i.e., EAP or MAP scores) are different from the Rasch measure because of different estimators and models (de Ayala, Citation2009). Further work is needed to explore the analytical procedure that uses subscale factor scores in relation to other variables.
The Rasch RSM assessment also revealed adequate performance of the five SPOCD questionnaire response categories, through showing that: 1) the average measure estimate for each response category increased monotonically and in the expected direction as the response categories moved from lower to higher categories; 2) the thresholds of the adjacent response categories increased monotonically and in the expected direction, and; 3) each of the five response categories showed acceptable infit and outfit MNSQ statistics. This was one of benefits of using the Rasch model (Tennant & Conaghan, Citation2007).
Some limitations of this study were that, first, although the sampled individuals were representative of the high school student populations from which they were selected, the use of a nonprobability sampling approach may not provide an accurate representation of this population in the study areas. However, the use of Rasch RSM analysis was likely to have overcome this issue as its methodology does not depend on the sampling involved, enabling generalization concerning the effective measurement properties of the SPOCD questionnaire. Second, more research is needed to fully understand the gender differences that come into play when considering opportunities for competence development in mathematics.
In summary, the application of the Rasch RSM and CFA to the SPOCD questionnaire helped to confirm the accuracy and usefulness of the SPOCD questionnaire summary scores, because all individuals have their own standard errors, and provided this scale with additional psychometric support. The findings from this study should help to facilitate use of the SPOCD questionnaire in future educational evaluation studies and encourage awareness, understanding and use of the scale among students, teachers, and decision-makers. Although the current study focused on the SPOCD questionnaire, the same method may be used to assess and validate other educational performance assessment scales.
Declaration of Conflicting Interests
The author(s) declared no potential conflicts of interest with respect to the research, authorship, and/or publication of this article.
Additional information
Funding
Notes on contributors

Wardani Rahayu
Wardani Rahayu is a senior lecturer in Graduate School of Education at Universitas Negeri Jakarta, Indonesia. Email: [email protected]
Muhammad Dwirifqi Kharisma Putra
Muhammad Dwirifqi Kharisma Putra is a doctoral student in Psychology at the Gadjah Mada University, Yogyakarta, Indonesia. Email: [email protected]
Deni Iriyadi
Yuli Rahmawati is a lecturer in the Chemistry Education Department, Faculty of Mathematics and Natural Science, Universitas Negeri Jakarta, Indonesia. Email: [email protected]
Yuli Rahmawati
Rekha B. Koul is an associate professor in School of Education at Curtin University, Bentley, Western Australia. Email: [email protected]
Rekha B. Koul
Deni Iriyadi is a doctoral student in Assessment and Program Evaluation Department, Universitas Negeri Jakarta, Indonesia. Email: [email protected]
References
- Allison, C., Baron-Cohen, S., Stone, M. H., & Muncer, S. J. (2015). Rasch modeling and confirmatory factor analysis of the Systemizing Quotient-Revised (SQ-R) Scale. Spanish Journal of Psychology, 18, 1–18. doi:10.1017/sjp.2015.19
- Andrich, D. (1978). A rating formulation for ordered response categories. Psychometrika, 43, 561–573. doi:10.1007/BF02293814
- Andrich, D., & Marais, I. (2019). A course in rasch measurement theory: Measuring in the educational, social and health sciences. Singapore: Springer Nature Singapore Pte Ltd.
- Bentler, P. M. (1990). Comparative fit indexes in structural models. Psychological Bulletin, 107, 238–246. doi:10.1037/0033-2909.107.2.238
- Bond, T., & Fox, C. (2015). Applying the Rasch model: Fundamental measurement in the human sciences (3rd ed.). Mahwah, NJ: Lawrence Erblaum & Associates.
- Bonne, L., & Lawes, E. (2016). Assessing students’ maths self-efficacy and achievement. Assessment News, 2, 60–63.
- Brown, A., & Croudace, T. J. (2015). Scoring and estimating score precision using multidimensional IRT models. In S. P. Reise & D. A. Revicki (Eds.), Handbook of item response modeling: Applications to typical performance assessment (pp. 307–333). New York, NY: Routledge.
- Brown, T., McNamara, O., Hanley, U., & Jones, L. (1999). Primary student teachers’ understanding of mathematics and its teaching. British Educational Research Journal, 25, 299–322. doi:10.1080/0141192990250303
- Brown, T. A. (2015). Confirmatory factor analysis for applied research (2nd ed.). New York, NY: Guilford Press.
- Browne, M. W., & Cudeck, R. (1993). Alternative ways of assessing model fit. In K. A. Bollen & J. S. Long (Eds.), Testing structural equation models (pp. 136–162). Newbury Park, CA: Sage.
- Chou, Y.-T., & Wang, W.-C. (2010). Checking dimensionality in item response models with principal component analysis on standardized residuals. Educational and Psychological Measurement, 70, 717–731. doi:10.1177/0013164410379322
- Christensen, K. B., Makransky, G., & Horton, M. (2017). Critical values for Yen’s Q3: Identification of local dependence in the Rasch model using residual correlations. Applied Psychological Measurement, 41, 178–194. doi:10.1177/0146621616677520
- Cobb, P., Stephan, M., McClain, K., & Gravemeijer, K. (2001). Participating in classroom mathematical practices. The Journal of Learning Sciences, 10, 113–163. doi:10.1207/S15327809JLS10-1-2_6
- Das Nair, R., Moreton, B. J., & Lincoln, N. B. (2011). Rasch analysis of the Nottingham extended activities of daily living scale. Journal of Rehabilitation Medicine, 43, 944–950. doi:10.2340/16501977-0858
- de Ayala, R. J. (2009). The theory and practice of item response theory. New York, NY: Guilford Press.
- DiStefano, C., & Morgan, G. B. (2010). Evaluation of the BESS TRS-CA using the Rasch rating scale model. School Psychology Quarterly, 25, 202–212. doi:10.1037/a0021509
- Doran, H. C. (2005). The information function for the one parameter logistic model: Is it reliability? Educational & Psychological Measurement, 65, 665–675. doi:10.1177/0013164404272500
- Flora, D. B., & Curran, P. J. (2004). An empirical evaluation of alternative methods of estimation for confirmatory factor analysis with ordinal data. Psychological Methods, 9, 466–491. doi:10.1037/1082-989X.9.4.466
- Flora, D. B., & Flake, J. K. (2017). The purpose and practice of exploratory and confirmatory factor analysis in psychological research: Decisions for scale development and validation. Canadian Journal of Behavioural Science, 49, 78–88. doi:10.1037/cbs0000069
- Gerbing, D. W., & Anderson, J. C. (1988). An updated paradigm for scale development incorporating unidimensionality and its assessment. Journal of Marketing Research, 25, 186–192. doi:10.1177/002224378802500207
- Hiebert, J. (1988). A theory of developing competence with written mathematical symbols. Educational Studies in Mathematics, 19, 333–355. doi:10.1007/BF00312451
- Hu, L., & Bentler, P. M. (1999). Cutoff criteria in covariance structure analysis: Conventional criteria versus new alternatives. Structural Equation Modeling, 6, 1–55. doi:10.1080/10705519909540118
- Hudson, B., Henderson, S., & Hudson, A. (2014). Developing mathematical thinking in the primary classroom: Liberating students and teachers as learners of mathematics. Journal of Curriculum Studies, 47, 374–398. doi:10.1080/00220272.2014.979233
- International Test Commision. (2018)ITC guidelines for translating and adapting tests second edition. International Journal of Testing, 18, 101–134. DOI:10.1080/15305058.2017.1398166
- Kean, J., Brodke, D. S., Biber, J., & Gross, P. (2018). An introduction to item response theory and Rasch analysis of the Eating Assessment Tool (EAT-10). Brain Impairment, 19, 91–102. doi:10.1017/BrImp.2017.31
- Kim, S., & Kyllonen, P. C. (2006). Rasch rating scale modeling of data from the standardized letter of recommendation (ETS Research Report RR-06-33). Princeton, NJ: Educational Testing Service.
- Linacre, J. M. (1998). Detecting multidimensionality: Which residual data-type works best? Journal of Outcome Measurement, 2, 266–283.
- Linacre, J. M. (2008). WINSTEPS Rasch measurement computer program [Version 3.65.0]. Chicago, IL: Winsteps.com.
- Linacre, J. M. (2010). Predicting responses from Rasch measures. Journal of Applied Measurement, 11, 1–10.
- Luo, X., Cappelleri, J. C., Cella, D., Li, J. Z., Charbonneau, C., Kim, S. T., … Motzer, R. J. (2009). Using the Rasch model to validate and enhance the interpretation of the functional assessment of cancer therapy–kidney symptom index—disease-related symptoms scale. Value In Health, 12, 580–586. doi:10.1111/j.1524-4733.2008.00473.x
- Mair, P. (2018). Modern psychometrics with R. Cham, Switzerland: Springer International Publishing AG.
- Masters, G. N., & Wright, B. D. (1984). The essential process in a family of measurement models. Psychometrika, 49, 529–544. doi:10.1007/BF02302590
- Maydeu-Olivares, A., & Joe, H. (2014). Assessing approximate fit in categorical data analysis. Multivariate Behavioral Research, 49, 305–328. doi:10.1080/00273171.2014.911075
- Ministry of Education of New Zealand. (2007). The New Zealand curriculum. Wellington, NZ: Ministry of Education by Learning Media Limited.
- Ministry of Education of New Zealand. (2015). Capable kids: Working with the key competencies. Retrieved from https://nzcurriculum.tki.org.nz/Key-competencies/Capable-kids-Working-with-the-key-competencies#collapsible5
- Mitchell-Parker, K., Medvedev, O. N., Krageloh, C. U., & Siegert, R. J. (2018). Rasch analysis of the frost multidimensional perfectionism scale. Australian Journal of Psychology, 70, 258–268. doi:10.1111/ajpy.2018.70.issue-3
- Muthén, L. K., & Muthén, B. O. (1998/2017). Mplus user’s guide: Statistical analysis with latent variables ((8th ed.). Los Angeles, CA: Muthén & Muthén.
- Nasoetion, N., Djalil, A., Musa, I., Soelistyo, S., Choppin, B. H., & Postlethwaithe, T. N. (1976). The development of educational evaluation models in Indonesia. Paris, France: International Institute for Educational Planning.
- Rasch, G. (1960). Probabilistic models for some intelligence and attainment tests. Copenhagen, Denmark: Danish Institute for Educational Research.
- Smith, E. (2002). Detecting and evaluating the impact of multidimensionality using item fit statistics and principal component analysis of residuals. Journal of Applied Measurement, 3, 205–231.
- Swaragita, G. (2018). Indonesian exams ‘too hard’, students ‘want to die’. Retrieved from https://www.thejakartapost.com/news/2018/04/14/indonesian-exams-too-hard-students-want-to-die.html
- Tait-McCutcheon, S. L. (2014). Teacher practice in primary mathematics classroom: A story of positioning. Doctoral dissertation, Victoria University of Wellington
- Tennant, A., & Conaghan, P. (2007). The Rasch measurement model in rheumatology: What is it and why use it? When should it be applied, and what should one look for in a Rasch paper? Arthritis Care and Research, 5, 1358–1362. doi:10.1002/art.23108
- Wihardini, D. (2016). An investigation of the relationship of student performance to their opportunity-to-learn in PISA 2012 mathematics: The case of Indonesia. Doctoral dissertation, University of California: Berkeley
- Wilson, M., & Draney, K. (2002). A technique for setting standards and maintaining them over time. In S. Nishisato, Y. Baba, H. Bozdogan, & K. Kanefugi (Eds.), Measurement and multivariate analysis (pp. 325–332). Tokyo, Japan: Springer-Verlag.
- Worldometers. (2019). Indonesia population. Retrieved from https://www.worldometers.info/world-population/indonesia-population/
- Wright, B. D. (1968). Sample-free test calibration and person measurement. Proceedings of the 1967 Invitational Conference on Testing Problems, (pp. 85–101). Princeton, NJ: Educational Testing Service.
- Wright, B. D., & Masters, G. N. (1982). Rating scale analysis. Chicago, IL: MESA Press.
- Yen, W. M. (1984). Effects of local item dependence on the fit and equating performance of the three-parameter logistic model. Applied Psychological Measurement, 8, 125–145. doi:10.1177/014662168400800201
- Zulkardi, Z., Putri, R. I. I., & Wijaya, A. (2019). Two decades of realistic mathematics education in Indonesia. In M. van den Heuvel-panhuizen (Ed.), International reflections on the Netherlands didactics of mathematics (pp. 325–340). Cham, Switzerland: Springer Nature Switzerland AG.
Appendix A.
Item wording of SPOCD