
 ?Mathematical formulae have been encoded as MathML and are displayed in this HTML version using MathJax in order to improve their display. Uncheck the box to turn MathJax off. This feature requires Javascript. Click on a formula to zoom.
Abstract
This article reports on a study investigating the relationship between university students’ self-reported use and application of learning and study strategies and student success indicators (timeframe and student type, namely low-performing, average-performing, or high-performing). Participants were 1 439 engineering students enrolled for academic studies at a South African University of Technology (UoT). Data were collected using the Learning and Study Strategies Inventory (LASSI) and academic performance data, obtained via the university’s student management information system. The LASSI provides diagnostic information about students’ self-perception regarding their study skills and learning orientations, assists educators in designing interventions for students to improve their skills, and aids in predicting academic achievement. Researchers have questioned the long-term correlation between LASSI scores and academic performance. Our results confirm that time spent in the tertiary environment and student type (low-, average- or high-performing) should be considered when using LASSI as a diagnostic tool. The usefulness of using the Credit Accumulation Rate (CAR), a measure that combines time spent in the tertiary environment and academic performance, is introduced and explored. Some novel trends emerged by investigating the relationships between CAR and LASSI scores. Based on our results, we make recommendations for identifying students at risk for academic failure and propose avenues for further research.
PUBLIC INTEREST STATEMENT
Universities worldwide are interested in enhancing student success. The concept of student success can be defined in various ways. This paper introduces the novel concept, Credit Accumulation Rate (CAR), to measure student success. CAR combines time spent in the tertiary environment and academic performance. We further explore the role of learning and study startegies concerning CAR among a sample of South African engineering students. We present evidence of the relevance of learning and study strategies and explore avenues for further research.
1. Introduction
There is a significant variance in study duration and success rates among students enrolled in higher education studies between countries (Fass-Holmes, Citation2016; Schulmann & Choudaha, Citation2014; Van Den Berg & Hofman, Citation2005). While higher education participation rates have risen sharply in many European countries, the data suggest that approximately 30% of all university entrants leave higher education without obtaining a degree (Mabel & Britton, Citation2018; OECD, Citation2010; Shapiro et al., Citation2014). The survival rate in higher education, which refers to the ratio of students enrolled for a specific qualification compared to those registered for the previous level of study, also fluctuates pointedly between countries (OECD, Citation2019; Van Den Berg & Hofman, Citation2005). Furthermore, there are significant differences in the success rates between various study fields (Bayat & Salehiniya, Citation2019; Van Den Berg & Hofman, Citation2005). The areas of medicine and dentistry typically report the highest success rates, with the technology sector often lagging with moderate to low success rates (Darling-Hammond et al., Citation2020; Fry et al., Citation2009).
In South Africa, the situation is precarious. The Higher Education Management Information System of the Department of Higher Education and Training only recently matured to enable broad undergraduate cohort studies, starting with the 2000 first-time entering student intake, became possible (DHET (Department of Higher Education and Training), Citation2019; Van Wyk & Basson, Citation2014). Analyses indicated that five years after entering university in 2004, only 30% of the total first-time entering student intake graduated, 14% were still in the system, and a staggering total of 56% of students left without graduating (Scott et al., Citation2007). More recent analyses indicate that high drop-out, low participation and low graduation rates remain problematic within the South African higher education setting (Mason, Citation2017). It is further estimated that approximately half of all students enrolled for academic studies within the South African higher education milieu will eventually graduate (CHE (Council on Higher Education), Citation2013; DHET (Department of Higher Education and Training), Citation2019; Wilson-Strydom, Citation2015). Thus, despite significant improvements in physical access to and enrolment in higher education, shortcomings in performance and low completion rates remain problematic (Lewin & Mawoyo, Citation2014; Scott, Citation2018; Van Wyk & Basson, Citation2014; Wilson-Strydom, Citation2015).
The academic performance metrics for engineering students at South African Universities of Technology (UoTs) is similarly troublesome. According to Van Wyk and Basson (Citation2014) approximately 54% of the students who enrolled for a four-year professional bachelor’s degree in engineering in 2000 graduated within five years, and 19% were still in the system. Additionally, 17% of students who enrolled for a three-year diploma in engineering in 2000 at non-distance education institutions graduated within five years, and 14% failed to complete their qualifications in the minimum required time (Statistics South Africa, Citation2019; Van Wyk & Basson, Citation2014). As a developing country, it would be short-sighted to ignore the cost associated with students leaving the system without graduating (Scott et al., Citation2007; Wilson-Strydom, Citation2015).
Although South African tertiary students’ survival rate is comparable to some European countries, the schooling system’s dismal state is no secret (Scott, Citation2018; Sikhwari & Pillay, Citation2012). The knock-on effect of poor schooling is that a significant proportion of first-year students present with low reading, writing and comprehension abilities (Dockrat, Citation2016; Lewin & Mawoyo, Citation2014). With fewer than half of all first-year students having the academic skills required to succeed at university level, the case for access to and success in higher education is grim (Letseka & Cosser, Citation2009; NBT (National Benchmark Test), Citation2018; Sikhwari & Pillay, Citation2012).
The significance of using pre-admission cognitive factors such as Grade 12 Mathematics, Science, and English for admission to South African UoTs, students has been investigated (Foxcroft & Roodt, Citation2013; Opperman & Greyling, Citation2015; Van Wyk et al., Citation2015). However, in isolation, such factors may not be sufficient to ensure increased graduation rates (Duckworth & Seligman, Citation2005; Goff, Citation2011; Yeager & Dweck, Citation2012). Accordingly, some researchers called for the inclusion of non-intellective factors in supporting student success (Duckworth & Seligman, Citation2005; McIlroy et al., Citation2017; Perez et al., Citation2009).
Non-intellective factors refer to behaviors, skills, attitudes, and strategies that form part of the predictive map of academic performance but which are not assessed using traditional cognitive measures (Farrington et al., Citation2012; McIlroy et al., Citation2017). The literature differentiates between five categories of non-intellective factors: academic behaviors, perseverance, mindsets, social strategies, and learning and study strategies (LSS) (Farrington et al., Citation2012; Goff, Citation2011; Van Staden & Ellis, Citation2017). Previous research has indicated that non-intellective factors rival standardized tests and traditional academic success measures as predictors of academic performance (Credé & Kuncel, Citation2008; Duckworth & Seligman, Citation2005). The logical corollary then is that if non-intellective skills, such as LSS, can be developed, students may be better equipped to navigate the challenging higher education landscape (Farrington et al., Citation2012; Hattie & Donoghue, Citation2016; Sikhwari & Pillay, Citation2012). Consequently, the need to consider non-intellective factors such as LSS for tailored interventions to protect the investment in higher education is an idea whose time has come (Moseki & Schulze, Citation2010; Opperman & Mason, Citation2020; Van Staden & Ellis, Citation2017).
This article reports on a study that examined the influence of non-intellective factors, with specific reference to LSS, on the academic success of engineering students within a South African context. We considered timeframe and student type (low-performing, average-performing, or high-performing) as student success indicators.
In the following section, a brief review of the literature on the effects of LSS on academic success is presented. This is followed by a discussion of the methodology that guided the study. Next, the results from the study are presented. The article concludes with a synthesis of the main findings and suggestions for further research.
2. Literature review
This literature review commences with a discussion on the non-intellective factor, namely LSS. The Learning and Study Strategies Inventory (LASSI), a widely used measure to assess LSS, is subsequently discussed. The review is concluded by introducing a novel concept, Credit Accumulation Rate.
2.1. Learning and study strategies
The concept of LSS refers to a collection of skills that assist students in processing and organizing academic or curriculum-related information for effective learning, retention and formal examination (Opperman & Mason, Citation2020). Some research suggests that students’ use and application of LSS play an important role in facilitating learning and positively affect academic performance (Hattie et al., Citation1996; Hattie & Donoghue, Citation2016; Moseki & Schulze, Citation2010). Previous studies have indicated that LSS is most effective when used with a self-regulatory framework (Cazan, Citation2012; Zimmerman, Citation2000). In other words, students who set personally-relevant academic goals, strategically use specific LSS to achieve their goals, and engage in ongoing self-monitoring tend to perform better compared to students who use LSS indiscriminately (Hattie et al., Citation1996; Zimmerman, Citation2002).
A meta-analysis conducted by Credé and Kuncel (Citation2008) showed that factors associated with LSS are comparible to standardized tests and previous grades as predictors of academic resilience and performance. In this regard, Kafka (Citation2016) compiled a comprehensive list of standardized tests that can be used to measure non-intellective constructs that are widely acknowledged to be essential for success. The LASSI, which is included in Kafka’s (Citation2016) list, is a well-known instrument that assesses students’ self-perceived use and application of LSS to the academic context (Weinstein et al., Citation2016). Furthermore, the LASSI is used widely for academic risk assessment and intervention purposes (Dockrat, Citation2016).
2.2. The learning and study strategies inventory
The LASSI is a self-report psychometric instrument designed to provide a quantitative measure of students’ perceived use and application of LSS with academic context (Weinstein et al., Citation2016). Data on the LASSI have been predictive of academic performance among students in both Western and African contexts (Dockrat, Citation2016). The LASSI also offers baseline diagnostic indicators on LSS that could help educators design interventions for students to improve their skills, thereby enhancing academic achievement (Moseki & Schulze, Citation2010).
The LASSI measures and describes ten LSS factors (Weinstein et al., Citation2016). provides a breakdown of the ten LASSI factors and indicates the internal consistencies for the respective scales.
Table 1. The LASSI scales
The ten factors indicated in can be categorized in various ways (Weinstein et al., Citation2016). First, they can be classified as functional skills (Information Processing, Selecting Main Ideas, Test Strategies, Self-Testing and Using Academic Resources) and global skills (Anxiety, Attitude, Concentration, Motivation and Time Management). Furthermore, the LASSI data can be pooled into three interdependent clusters: skill, will, and self-regulation (Weinstein et al., Citation1987).
The skill cluster, which includes the Information Processing, Selecting Main Ideas, and Test Strategies scales, examines students’ LSS related to identifying, acquiring, and constructing meaning for new information. The will cluster (Attitude, Motivation and Anxiety scales) refers to students’ motivation, agency, and discipline needed to complete academic tasks effectively. The third cluster, namely self-regulation, includes the Concentration, Time Management, Self-testing, and the Study Aids/Resources scales. The self-regulation cluster indicates how students manage, monitor, and control their learning processes (Weinstein et al., Citation2016).
As indicated in , the LASSI presents with good to excellent internal consistency scores (Weinstein et al., Citation2016). Other researchers have also studied the LASSI’s psychometric properties (Albaili, Citation1997; Boruchovitch & Dos Santos, Citation2015; Cano, Citation2006; Flowers et al., Citation2012). Although there seem to be acceptable degrees of consistency and reliability, there are exceptions. For example, Marland et al. (Citation2015), who conducted an Australian study using the LASSI as an enduring study skills assessment tool, found a high degree of similarity between students’ scores at two Australian universities, but they noted that these scores differ considerably from those published in the LASSI manual (Weinstein et al., Citation1987), which led them to question the instrument’s validity. The findings of Marland et al. (Citation2015) contrast with those from other international studies, such as a Brazilian study by Boruchovitch and Dos Santos (Citation2015), which provided initial evidence of content and construct validity.
Research by authors such as Jordan (Citation2016), Lawson (Citation2009), and Albaili (Citation1997) may shed some light on the existing discrepancies. Jordan (Citation2016) found that only the first-semester Grade Point Average correlated significantly with LASSI constructs and questioned the long-term correlation between LASSI scores and academic performance. The work of Lawson (Citation2009) also confirmed the usefulness of LASSI as an instrument to predict students at risk during the first semester—this relates to the results obtained by Cano (Citation2006), who reported good psychometric properties for a sample of first-year college students. The analysis conducted by Albaili (Citation1997) on low-, average- and high-achieving students showed that low-achieving students scored significantly lower LASSI scores compared to the average- and high-achieving students. No significant differences were observed between the average- and high-achieving groups on any of the scales (Albaili, Citation1997).
2.3. Learning and study strategies, risk profiling and interventions
From an academic advising perspective, significant value can be gained from using the LASSI as a diagnostic tool to assess potential problem areas related to academic performance (Burkart, Citation2017; Opperman & Mason, Citation2020). In this regard, Dockrat (Citation2016) proposes using risk profiling initiatives among first-year students. Drawing on Seidman’s (Citation2007) work, Dockrat (Citation2016) argues that a risk profiling initiative can provide predictive data regarding problem areas that could impinge on students’ academic performance. Amongst other things, she proposes that a risk profiling battery should include a measure that offers data on students’ use and application of LSS (Dockrat, Citation2016). In addition to a risk profiling initiative, staff working in student advising capacities should consider using risk data to inform the development of LSS-based interventions and support programs (Dill et al., Citation2014; Seidman, Citation2007).
Regarding LSS-based interventions, Millikin (Citation2011) reported on an LSS-based support program that addressed specific barriers among a sample of first-year students. The findings indicated higher persistence and graduation rates for students who participated in the LSS-based intervention (Millikin, Citation2011). Similarly, Burkart (Citation2015) designed a specific course aimed at students placed on academic probation that uses LASSI to promote meta-cognitive learning strategies. In a South African context, Moseki and Schulze (Citation2010) reported statistically significant improvements in a sample of university students’ use and application of LSS and subsequent academic performance following a 12-week intervention program. Data from Mason (Citation2019) also points to significant pre- versus post-intervention scores and positive lived experiences among students following an intervention program that used the LASSI as a baseline assessment.
Thus, the literature indicates the important contribution of LSS to students’ academic performance (Dill et al., Citation2014; Millikin, Citation2011; Moseki & Schulze, Citation2010). However, much of the existing literature that points to the relevance of LSS in academic performance has either focused on case studies comprising small and non-representative samples (Moseki & Schulze, Citation2010; Renzulli, Citation2015) or on the enhancement of LSS in a pre- and post-intervention format (Mason, Citation2019). Hence, there appears to be an absence of literature that links LSS to a clear academic performance indicator. Surprisingly, the direct association between LSS and measures of academic performance is seldom studied, and it therefore remains unclear to what extent LSS plays a role in students’ academic success. Furthermore, we found no literature that discussed the relationship between LSS and the rate at which students obtained academic credits as they progressed in their studies. Against this background, we introduce the Credit Accumulation Rate (CAR).
2.4. Credit accumulation rate
The concept CAR refers to the total number of credits that students achieve as they progress in their academic studies per academic semester. Therefore, CAR can be represented as follows:
According to the NATED151 regulations governing the issuing of a National Diploma (NDip) in the South African higher education system, a student needs to accumulate three credits to graduate (DHET (Department of Higher Education and Training), Citation2004). Each year of academic study is, therefore, equal to one credit. If the NDip is completed in minimum time, i.e., three years (six semesters) or less (in the rare instance where a student is permitted to enroll for additional credits), then the CAR for the student will be
If the NDip is completed in maximum time or more (based on extenuating circumstances), i.e., six years (12 semesters) or more, then the CAR for the student will be
Thus, students with a CAR of 0.25 will complete their qualifications if they are motivated and persistent enough, but they will take twice as long as students with a CAR of 0.5. Furthermore, students with a CAR < 0.25 who do not drop out will not finish their studies in the maximum allowed time and will likely require additional academic support. Within the context of this study, we based the CAR score of students who dropped out on the timeframe (semesters) for which they were enrolled in relation to the credits attained. There is a direct relationship between CAR and the probability of graduating or dropping out. Note that scaling or normalizing the CAR variable may be required for comparison with other education systems that do not use semesters or have different academic credit systems.
3. Goal of the study
The goal of the study was to determine the relationship between timeframe, academic performance, and LSS measured via the LASSI. Furthermore, the research sought to explore which LSS factors contribute to undergraduate engineering students’ academic performance. For this study, we defined a unique variable, CAR, which links academic performance and timeframe.
The study was guided by the following overarching research question: What is the relationship between LSS and students’ academic performance? To address the overarching question, two sub-questions were also investigated: (1) Which LSS factors contribute most to students’ academic performance after 12 semesters (Graduated, Dropped-out, or In-system)? (2) What are the relationships between non-intellective LSS factors measured by the LASSI during the first-year intake and CAR?
4. Research method
4.1. Research design and context
We adopted a correlational research design to investigate the relationships between students’ self-reported use of LSS and academic status after 12 semesters (Graduated, Dropped-out, or In- system), and the self-reported use of LSS and CAR. The study was conducted at a large South African UoT, with approximately 60,000 enrolled students. The student population is diverse regarding sex, race and language, thereby accurately resembling the broader South African demographics (Statistics South Africa, Citation2016). Data for this study were collected from students enrolled in engineering studies due to the authors’ work-related affiliation within the specific faculty.
4.2. Sample
A sample of 1 439 undergraduate engineering students at a South African UoT completed the LASSI questionnaire as part of a first-year risk profiling initiative from 2011 to 2015. Attending to the risk profiling initiative was strongly encouraged but not strictly enforced. Therefore, the sample is smaller than the number of first-year students in engineering enrolled at the specific university within the specified timeframe.
Students in the sample all wrote the National Matriculation Examination at the end of Grade 12 to obtain the National Senior Certificate. International students and other students who had not followed the National Senior Certificate curriculum were not included in the sample. The sampled students were admitted for academic studies based only on their National Senior Certificate results. All sampled students enrolled for a three-year NDip in engineering. The NDip comprises two years (four semesters) of theoretical study and one year (two semesters) of industry placement.
4.3. Data collection: instrument
Participants completed the third edition of the LASSI, which comprises 80 items and offers quantitative values for ten LSS factors (see ). Participants responded to the LASSI items on a five-point Likert scale ranging from 1 = Not at all typical of me, to 5 = Very much typical of me. Examples of items include: “I concentrate fully when studying” and “I translate what I am studying into my own words” (Weinstein et al., Citation2016). The developers reported good to excellent psychometric properties for the LASSI and the various subscales (see ).
4.4. Data collection: procedure
The LASSI was included as part of a risk-profiling battery during the students’ first academic study year. The data were collected by staff working in student advising capacities at the UoT where the study was conducted. All staff who collected and interpreted the data were registered psychologists and had professional training in psychometric testing. Following the risk-profiling assessments, students received group-based verbal feedback and a hardcopy report on their results. Furthermore, recommendations for intervention and support programs were provided. However, students’ follow-through on the recommendations was neither actively monitored nor strictly enforced.
4.5. Data analysis
Participants’ self-reported LASSI scores were paired with academic credit, student status after 12 semesters (Graduated, Dropped-out, or In-system), and time data (needed to calculate the CAR) extracted from the university’s student management information system. The paired data were then anonymized and converted into an Excel binary file format for analyses.
The data were analyzed using MATLAB. The analysis aimed to determine (1) if any of the measurements were significantly different between the Graduated, Dropped-Out, and In-System groups, and (2) if there were significant differences between students with varying values of CAR for each of the ten LASSI scales. In this regard, ANOVA analysis was used. Furthermore, the Wilcoxon-Mann-Whitney test was used to investigate if statistically significant differences existed when pairing two categories together (Field, Citation2013).
4.6. Research ethics
The UoT where data were collected granted permission to conduct the study (Ref. number: REC/2019/11/003). All identifying information (e.g., surnames, names, and student numbers) was treated confidentially and removed before the data analysis. Students did not receive course credit or financial benefits in exchange for participation.
5. Results
The results from the empirical study are discussed in the following sections. First, group trends that emerged following the analysis are presented. The group trends offer essential contextual information that enlightens the section reporting on the LASSI results and students’ academic performance metrics.
5.1. Group trends
to show the group trends for the sample of undergraduate engineering students (n = 1 439) included in this study.
Figure 1. Percentage of students in the Graduated, Dropped-Out, and In-System groups
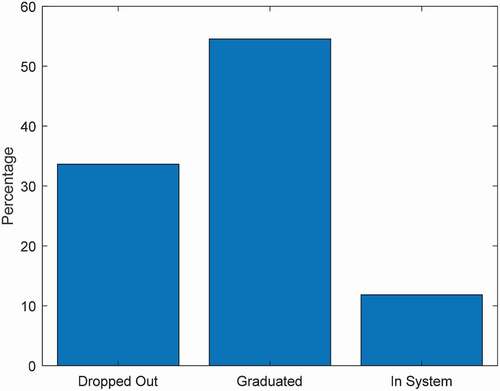
shows that 54.5% of the students graduated during 12 semesters, which is the maximum time to graduate. Furthermore, 33.6% dropped out, and 11.8% were still in the system after 12 semesters. After 12 semesters (11.8%), the students remaining in the system are usually those who successfully appealed academic exclusion based on extenuating circumstances, for example, illness, psychological challenges, financial problems, or having only a few credits left to complete (TUT. (Tshwane University of Technology), Citation2018).
The data revealed that students typically dropped out after 4.3 semesters or graduated after 7.34 semesters. However, because the data distributions are not Gaussian, a more detailed analysis is provided in to .
Figure 2. Probability of completing the NDip in a given number of semesters for the Graduated group
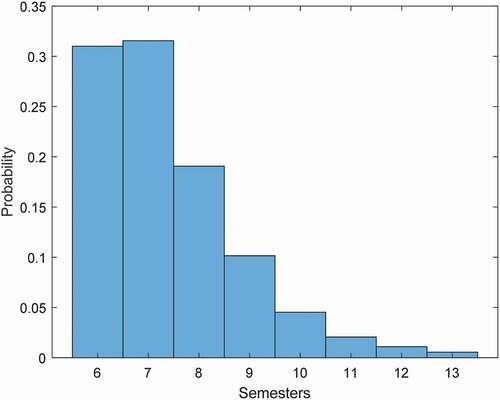
shows that slightly more than 60% of students who completed the NDip did so in less than seven semesters. Somewhat less than 20% achieved the qualification in eight semesters, about 10% completed it in nine semesters, and the remaining students took more than nine semesters to complete their studies.
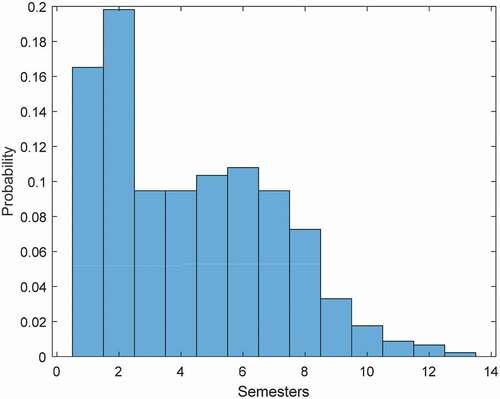
indicates that students’ probability in the Dropped-Out group to leave the system is the highest (more than 26% chance) during the first two semesters. The probability increases again to more than 30% during semesters 5 to 7, but then exponentially decreases after the sixth semester.
Figure 3. Probability of dropping out during a given semester for Dropped-Out group
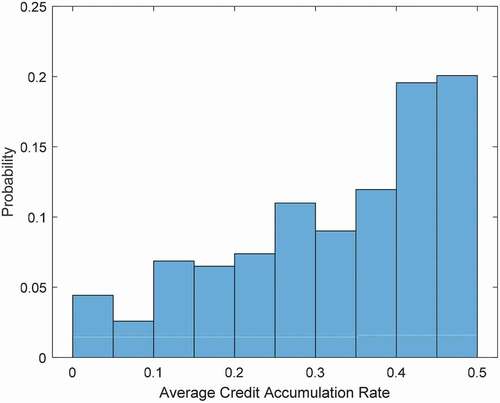
indicated the probability of obtaining specific CAR values for students in the sample. The data show that 41% of the students in the cohort managed to maintain an average CAR of > 0.4, and that slightly less than 55% of students in the sample had a CAR ≥ 0.25 enabling them to complete within twelve semesters or less.
Figure 4. The average credits accumulated per semester for the entire group
5.2. LASSI results
We investigated statistically significant differences between three categorical student categories, namely Graduated, In-System, or Dropped-Out after 12 semesters from the first-time enrolment, for each of the ten LASSI scales. displays the p-values when the LASSI scales of the Graduated sub-group are compared with the combined Dropped-Out and In-System sub-groups for each of the ten LASSI scales.
Table 2. Graduated vs Dropped-Out & In-System
shows that the results are statistically insignificant (p > 0.05). The scenarios depicted in offer a categorical snapshot after 12 semesters, for which LASSI might not be a useful measure. In exploring these scenarios, it became apparent that an alternative approach was needed.
When adding a rate dimension to our analysis, i.e., the number of credits accumulated during a specified period, the results revealed notable trends. For each LASSI scale, we created a series of CAR thresholds, and for each threshold, divided the sample into two groups. For example, shows that for a CAR of 0.1, 95 students sampled presented with a CAR < 0.1 denoted as Below Threshold (BT). Furthermore, 1 251 students had a CAR ≥ 0.1, designated as Above Threshold (AT). Similarly, for a CAR of 0.5, the AT and BT values are 1 084 and 262 respectively, indicating that only 262 students in the sample completed their qualification in the minimum time. We obtained the p-values using the Wilcoxon-Mann-Whitney test since normal distributions could not be assumed (Field, Citation2013).
Table 3. LASSI Scales and CAR thresholds
Some interesting trends, to our knowledge not reported elsewhere in the literature, are shown in :
Eight LASSI dimensions, i.e., Anxiety, Attitude, Concentration, Information Processing, Motivation, Selecting Main Ideas, Test Strategies, and Time Management, have p-values < 0.05 for the 0.5 CAR thresholds. This result indicates statistically significant differences between the self-reported LSS of students who accumulated the maximum credits per semester and those who could not. Strengthening these specific LSS could potentially contribute to enhanced academic performance.
In the CAR 0.5 column, there are eight LASSI scales with p-values < 0.05, but in the CAR 0.2 column, there are only two such scales, namely Attitude and Motivation. Anxiety, Concentration, Information Processing, Selecting Main Ideas, Test Strategies, and Time Management are good indicators of higher CAR values.
6. Discussion and recommendations
In this section, we report on the specific research questions. The first research question was: Which LSS factors contribute most to students’ academic performance? The results indicated eight LASSI factors, namely Anxiety, Attitude, Concentration, Information Processing, Motivation, Selecting Main Ideas, Test Strategies, and Time Management, presented with statistically significant results (p < 0.05) for CAR = 0.5. This result indicates that students who accumulated the required credits for graduation also reported higher scores on the mentioned eight LASSI factors. These eight LASSI factors point to an even blend of both functional (Information Processing, Selecting Main Ideas and Test Strategies) and global skills (Anxiety, Attitude, Concentration, Motivation, and Time Management).
Additionally, the eight LASSI factors encompass factors in the skills cluster (Information Processing, Selecting Main Ideas, and Test Strategies), the will cluster (Anxiety, Attitude, and Motivation), and the self-regulation cluster (Concentration and Time Management) (Weinstein et al., Citation2016). The only two LASSI factors that did not feature prominently among students who completed their studies in the minimum required time were Study Aids and Self-testing. In terms of practical application, the results suggest that the initial risk profiling using the LASSI should continue. Students’ reported scores on the eight mentioned factors should be considered critical indicators of student performance. Therefore, the risk profiling process results should serve as the baseline for early, intensive and ongoing academic support (Dockrat, Citation2016; Seidman, Citation2007).
The second research question was: What are the relationships between non-intellective LSS factors measured by LASSI during the first-year intake, students’ status after 12 semesters (Graduated, Dropped-out, or In-system), and CAR? The results indicated that if only the categories Graduated, Dropped-Out, and In-System are used (snapshot after 12 semesters), the relationship between the non-intellective factors identified during risk profiling is insignificant. This supports the findings of Jordan (Citation2016), Lawson (Citation2009), and Albaili (Citation1997) by indicating that the LASSI scores have the most value during the first year of study, and the long-term correlation between LASSI scores and academic performance is less useful. In this respect, students’ natural development and growth, related explicitly to the use and application of LSS, could explain the diminished levels of relevance that the initial LASSI assessment plays concerning academic performance.
However, the results showed that on the one end of the spectrum where the CAR ≥ 0.3, differences in the AT and BT groups are remarkably dissimilar, but that statistically significant differences either fade or completely disappear as we move towards the other end of the spectrum where CAR < 0.3. Because there is a direct relationship between CAR and Graduation or Drop-Out, the CAR serves as a bridge to link non-intellective factors to Graduation or Drop-Out. It should be evident that the CAR can be used to direct available resources to students needing it most. Therefore, we recommend that students with a CAR < 0.35 from their second year onwards, receive targeted individualized LSS support, among other support. Additionally, we suggest that the risk profiling assessments using LASSI should be integrated with targeted interventions focusing on specific LSS factors (Anxiety, Attitude, Concentration, Information Processing, Motivation, Selecting Main Ideas, Test Strategies, and Time Management) as this could prove to have a positive effect on academic performance.
7. Conclusion and future work
This study investigated the relationship between timeframe, academic performance, and LSS measured via the LASSI. The results confirm that the time spent in the tertiary environment should be considered when using the LASSI as a diagnostic tool. Furthermore, the novel concept, CAR, was introduced.
The CAR serves as a useful variable when analyzing students’ self-reported LASSI responses. We derived a valuable framework for identifying students at risk by investigating the relationships between CAR and LASSI scores.
Based on the study results, four recommendations emerge. First, engagement with engineering students on non-intellective factors, with specific reference to LSS, is strongly advised. Second, risk profiling using the LASSI should continue and be combined with CAR scores to assess risk levels in predicting students’ academic performance. Third, students who present with a CAR of 0.35 or lower from the second academic year should be assisted by developing and applying LSS Fourth, specific LSS that is important for engineering students, bearing in mind the results reported here, would be Anxiety, Attitude, Concentration, Information Processing, Motivation, Selecting Main Ideas, Test Strategies, and Time Management. Persons working in student advising capacities should consider addressing these LSS in support programs.
The findings reported here should be read with some limitations in mind. First, the study was conducted at a single South African UoT. Thus, researchers should be wary in generalizing the findings to other contexts. Second, a correlational research design was adopted in conducting the study. Therefore, researchers should be careful in viewing the relationships between the LASSI, CAR, and students’ academic performance as implying causation. Third, extraneous factors, such as students’ social support networks, socioeconomic status, and psychological hardiness, were not included as variables in the study. Consequently, extraneous factors that could promote or negatively impinge on the use and application of LSS were not investigated. Fourth, data were collected using the self-report LASSI measure that opens the study to subjective bias.
Despite the limitations, we argue that the LASSI provides diagnostic information about students’ self-perception regarding their LSS and could also inform the type of support required to complete their academic studies with the prescribed minimum time. This study showed that non-intellective factors, especially LSS as assessed using the LASSI, play a relevant role in engineering students’ academic success. The study, therefore, paves the way for further research.
Future studies should consider the relationship between other non-intellective factors, for example, psychological hardiness, and other extraneous variables, such as socioeconomic status and social support in relation to academic performance among engineering students. Additionally, in prospective research, extraneous factors that could influence students’ use and application of LSS should be controlled for. Future inquiries should examine how academic advisors could support engineering students and others in dealing with the myriad of academic-related stressors that emerge throughout the dynamic student life cycle. Finally, studies could include objective measures to compliment the subjective components of the LASSI.
This study’s major contribution is the empirical linkage between non-intellective factors, namely LSS assessed via the LASSI, and students’ academic performance as quantified using the CAR indicator. Previous studies had reported correlations between non-intellective factors and academic performance. Such studies had failed to link specific LSS and CAR. This finding could assist academics working in engineering and those in student advising capacities in particular, to prioritize which students should receive additional support to enhance academic success and graduation.
Acknowledgements
This work was made possible in part by the 2018/9 University Capacity Development Grant (UCDG) of the Department of Higher Education and Training (DHET), the Higher Education and Support (HEDS) division at the Tshwane University of Technology. This grant sponsored the Haaga-Helia participation and supported the collection of the required data.
DATA AVAILABILITY STATEMENT
The data that support the findings of this study are available from the corresponding author upon reasonable request.
Additional information
Funding
Notes on contributors
Henry D Mason
Barend van Wyk has a passion for technology and the demystification and communication of complex technological, scientific, educational, and management concepts in a novel and fun way. He is an National Research Foundation-rated researcher who has published more than more than 173 peer-reviewed journal and conference papers, and has successfully supervised/co-supervised more than 44 doctoral and master’s students. Barend’s research interests include artificial and computational intelligence, machine learning, and engineering education.
Henry D Mason (Ph.D.) is a social science researcher at the Tshwane University of Technology (TUT) in Pretoria, South Africa. He is registered as a Psychologist with the Health Professions Council of South Africa and holds a Y-rating from the National Research Foundation in South Africa. Henry has authored 40 articles in scientific journals and read over 100 papers at conferences. Henry’s research interests focus on studying the role and application of positive psychology and non-intellective factors in relation to student success.
References
- Albaili, M. A. (1997). Differences among low-, average- and high-achieving college students on learning and study strategies. Educational Psychology, 17(1–2), 171–16. https://doi.org/https://doi.org/10.1080/0144341970170112
- Bayat, B., & Salehiniya, H. (2019). Assessing academic success rate and related factors among the students. Journal of Education and Health Promotion, 8, 90. https://doi.org/https://doi.org/10.4103/jehp.jehp_244_18
- Boruchovitch, E., & Dos Santos, A. A. A. (2015). Psychometric studies of the learning strategies scale for university students. Paidéia (Ribeirão Preto), 25(60), 19–27. https://doi.org/https://doi.org/10.1590/1982-43272560201504
- Burkart, G. (2015). 16 weeks to college success. Kendall Hunt.
- Burkart, G. (2017). Using the LASSI to engage metacognitive strategies that foster a growth mindset in college students placed on academic probation. Accessed at: https://he.kendallhunt.com/sites/default/files/heupload/Using%20the%20LASSI%20to%20Engage%20Metacognitive%20Strategies%20that%20Foster%20a%20Growth%20Mindset%20in%20College%20Students%20Placed%20on%20Academic%20Probation.pdf
- Cano, F. (2006). An in-depth analysis of the Learning and Study Strategies Inventory (LASSI). Educational and Psychological Measurement, 66(6), 1023–1038. https://doi.org/https://doi.org/10.1177/0013164406288167
- Cazan, A. (2012). Self-regulated learning strategies – Predictors of academic adjustment. Procedia – Social and Behavioral Sciences, 33, 104–108. https://doi.org/https://doi.org/10.1016/j.sbspro.2012.01.092
- CHE (Council on Higher Education). (2013). A proposal for undergraduate curriculum reform in South Africa: The case for a flexible curriculum structure. Council on Higher Education.
- Credé, M., & Kuncel, N. R. (2008). Study habits, skills, and attitudes: The third pillar supporting collegiate academic performance. Perspectives on Psychological Science, 3(6), 425–453. https://doi.org/https://doi.org/10.1111/j.1745-6924.2008.00089.x
- Darling-Hammond, L., Flook, L., Cook-Harvey, C., Barron, B., & Osher, D. (2020). Implications for educational practice of the science of learning and development. Applied Developmental Science, 24(2), 97–140. https://doi.org/https://doi.org/10.1080/10888691.2018.1537791
- DHET (Department of Higher Education and Training). (2004). Formal technikon instructional programmes in the RSA. Report 151 (01/04). https://www.dhet.gov.za/Reports%20Doc%20Library/Formal%20Technikon%20Instructional%20Programmes%20-%20Report%20151%20(0104)%20Diploma%20Programmes.pdf
- DHET (Department of Higher Education and Training). (2019). 2000 to 2016 first time entering undergraduate cohort studies for public higher education. Department of Higher Education and Training.
- Dill, A. L., Justice, C. A., Minchew, S. S., Moran, L. M., Wang, C., & Weed, C. B. (2014). The use of the LASSI (learning and study strategies inventory) to predict and evaluate the study habits and academic performance of students in a learning assistance program. Journal of College Reading and Learning, 45(1), 20–34. https://doi.org/https://doi.org/10.1080/10790195.2014.906263
- Dockrat, S. Y. (2016). Psychometric profiling of students at risk for academic underachievement at a university of technology. Unpublished doctoral thesis University of Pretoria.
- Duckworth, A. L., & Seligman, M. E. P. (2005). Self-discipline outdoes IQ in predicting academic performance of adolescents. Psychological Science, 16(12), 939–944. https://doi.org/https://doi.org/10.1111/j.1467-9280.2005.01641.x
- Farrington, C. A., Roderick, M., Allensworth, E., Nagaoka, J., Keyes, T. S., Johnson, D. W., & Beechum, N. O. (2012). Teaching adolescents to become learners. The role of non-cognitive factors in shaping school performance: A critical literature review. University of Chicago Consortium on Chicago School Research.
- Fass-Holmes, B. (2016). International undergraduates’ retention, graduation, and time to degree. Journal of International Students, 6 (4), 933–955. Retrieved from https://files.eric.ed.gov/fulltext/EJ1125580.pdf. https://doi.org/https://doi.org/10.32674/jis.v6i4.327
- Field, A. (2013). Discovering statistics using IBM SPSS statistics. Sage.
- Flowers, L. A., Bridges, B. K., & Moore, I. I. I. J. L. (2012). Concurrent validity of the learning and study strategies inventory (LASSI): A study of African American precollege students. Journal of Black Studies, 43(2), 146–160. https://doi.org/https://doi.org/10.1177/0021934711410881
- Foxcroft, C., & Roodt, G. (2013). Introduction to psychological assessment in the South African context. Oxford University Press.
- Fry, H., Ketteridge, S., & Marshall, S. (2009). A handbook for teaching and learning in higher education: Enhancing academic practice. Routledge.
- Goff, A. (2011). Stressors, academic performance, and learned resourcefulness in baccalaureate nursing students. International Journal of Nursing Education Scholarship, 8(1). https://doi.org/https://doi.org/10.2202/1548-923X.2114
- Hattie, J., Biggs, J., & Purdie, N. (1996). Effects of learning skills interventions on student learning: A meta-analysis. Review of Educational Research, 66(2), 99–136. https://doi.org/https://doi.org/10.3102/00346543066002099
- Hattie, J. A., & Donoghue, G. M. (2016). Learning strategies: A synthesis and conceptual model. NPJ: Science of Learning, 1(1). https://doi.org/https://doi.org/10.1038/npjscilearn.2016.13
- Jordan, J. D. (2016). Academic performance: A retrospective investigation of study skills and LASSI performance. Unpublished doctoral dissertation, Sam Houston State University. http://hdl.handle.net/20.500.11875/2407
- Kafka, T. (2016). A list of non-cognitive assessment instruments. Retrieved from https://ccrc.tc.columbia.edu/images/a-list-of-non-cognitive-assessment-instruments.pdf
- Lawson, L. A. (2009). The Learning and Study Strategies Inventory as a predictive measure of 1st semester academic performance of at-risk students. Unpublished master’s dissertation, Florida State University. Retrieved from file:///C:/Users/masonh/Downloads/PDF%20datastream.pdf
- Letseka, M., & Cosser, M. (2009). Pathways through higher education to the labour market: student retention, graduation and destination. HSRC client report for the Ford Foundation. Human Sciences Research Council.
- Lewin, T., & Mawoyo, M. (2014). Student access and success: Issues and interventions in South African universities. Inyathelo: The South African Institute for Advancement.
- Mabel, Z., & Britton, T. A. (2018). Leaving late: understanding the extent and predictors of college late departure. Social Science Research, 69, 34–51. https://doi.org/https://doi.org/10.1016/j.ssresearch.2017.10.001
- Marland, J., Dearlove, J., & Carpenter, J. (2015). LASSI: an Australian evaluation of an enduring study skills assessment tool. Journal of Academic Language & Learning, 9 (2), 32–45. http://www.journal.aall.org.au/index.php/jall/article/view/327.
- Mason, H. D. (2017). The efficacy of a strategic learning programme to enyhance first-year students’ academic skills and performance. Journal for New Generation Science, 15 (2), 66–87. Retrieved from https://journals.co.za/doi/pdf/ https://doi.org/10.10520/EJC-f09a1a868.
- Mason, H. D. (2019). Evaluation of a study skills intervention programme: A mixed methods study. Africa Education Review, 16(1), 88–105. https://doi.org/https://doi.org/10.1080/18146627.2016.1241666
- McIlroy, D., Palmer-Conn, S., Lawler, B., Poole, K., & Ursavas, Ö. F. (2017). Secondary level achievement: non-intellective factors implicated in the process and product of performance. Journal of Individual Differences, 38(2), 102–112. https://doi.org/https://doi.org/10.1027/1614-0001/a000227
- Millikin, M. (2011). Promoting student success: evaluation of a freshman orientation course. Innovation and Empowerment: SNU-Tulsa Research Journal, 3(2), 1–14. https://silo.tips/download/running-head-promoting-student-success-evaluation-of-a-freshman-orientation-cour
- Moseki, M. M., & Schulze, S. C. (2010). Promoting self-regulated learning to improve achievement: A case study in higher education. Africa Education Review, 7(2), 356–375. https://doi.org/https://doi.org/10.1080/18146627.2010.515422
- NBT (National Benchmark Test). (2018). National benchmark tests: National report. Centre for Educational Testing for Access and placement. Retrieved from https://nbt.ac.za/sites/default/files/NBTPReport_2018.pdf
- OECD. (2010). Education at a Glance 2010: OECD indicators. https://doi.org/https://doi.org/10.1787/eag-2010-en.
- OECD. (2019). Education at a glance 2019: OECD indicators. https://doi.org/https://doi.org/10.1787/f8d7880d-en.
- Opperman, I., & Greyling, M. (2015). Predicting average marks in tertiary education using cognitive testing and secondary education performance. New Voices in Psychology, 11 (2), 87–106. Retrieved from https://www.researchgate.net/publication/312495558_Predicting_average_marks_in_tertiary_education_using_cognitive_testing_and_secondary_education_performance.
- Opperman, I., & Mason, H. D. (2020). Structure and norms of the learning and study strategy inventory: A comparison of South African and American samples. Journal of Psychology in Africa, 30(3), 187–191. https://doi.org/https://doi.org/10.1080/14330237.2020.1744300
- Perez, W., Espinoza, R., Ramos, K., Coronado, H. M., & Cortes, R. (2009). Academic resilience among undocumented latino students. Hispanic Journal of Behavioral Sciences, 31(2), 149–181. https://doi.org/https://doi.org/10.1177/0739986309333020
- Renzulli, S. J. (2015). Using learning strategies to improve the academic performance of university students on academic probation. NACADA Journal, 35 (1), 29–41. Retrieved from https://files.eric.ed.gov/fulltext/EJ1069272.pdf. https://doi.org/https://doi.org/10.12930/NACADA-13-043
- Schulmann, P., & Choudaha, R. (2014). International student retention and success: A comparative perspective. Retrieved from http://wenr.wes.org/2014/09/
- Scott, I. (2018). Designing the South African higher education system for student success. Journal of Student Affairs in Africa, 6(1), 1–17. https://doi.org/https://doi.org/10.24085/jsaa.v6i1.3062
- Scott, I., Yeld, N., & Hendry, J. (2007). A case for improving teaching and learning in South African higher education. Higher Education Monitor No 6. Retrieved from http://www.che.ac.za/documents/d000155/index.php.
- Scott, I., Yeld, N., & Hendry, J. (2007). A case for improving teaching and learning in South African higher education. Higher Education Monitor No 6. Council on Higher Education. Retrieved from http://www.che.ac.za/documents/d000155/index.php
- Shapiro, D., Dundar, A., Yuan, X., Harrell, A., Wild, J., & Ziskin, M. (2014). Some college, no degree: A national view of students with some college enrollment, but no completion (Signature Report No.7). National Student Clearinghouse Research Center. Retrieved from https://nscresearchcenter.org/wp-content/uploads/NSC_Signature_Report_7.pdf
- Sikhwari, T. D., & Pillay, J. (2012). Investigating the effectiveness of a study skills training programme. South African Journal of Higher Education, 26 (3), 606–622. https://doi.org/https://doi.org/10.20853/26-3-170.
- Statistics South Africa. (2016). Mid-year population estimates, 2016. Pretoria, South Africa: Statistics South Africa. Retrieved from https://www.statssa.gov.za/publications/P0302/P03022016.pdf
- Statistics South Africa. (2019). Education series volume V: Higher education and skills in South Africa, 2017. Retrieved from http://www.statssa.gov.za/publications/Report-92-01-05/Report-92-01-052017.pdf
- TUT. (Tshwane University of Technology). (2018). Student’s rules and regulations. Pretoria, South Africa; Tshwane University of Technology. https://www.tut.ac.za/ProspectusDocuments/2018/Chapter_2_2018.pdf
- Van Den Berg, M., & Hofman, W. (2005). Student success in university education: A multi-measurement study of the impact of student and faculty factors on study progress. Higher Education, 50 (3), 413–446. Retrieved from www.jstor.org/stable/25068105. https://doi.org/https://doi.org/10.1007/s10734-004-6361-1
- Van Staden, L. J., & Ellis, S. (2017). Some variables influencing academic achievement: reading, motivation, learning strategies, learning approaches. Journal of Educational Studies, 16 (2), 113–131. https://hdl.handle.net/10520/EJC-f89606fdd.
- Van Wyk, B. J., & Basson, S. N. (2014). To wil or not to wil. Edulearn14 proceedings, 5246–5249. Barcelona, Spain. Retrieved from https://library.iated.org/view/VANWYK2014TOW
- Van Wyk, B. J., Hofman, W. A. H., & Louw, I. (2015). Impact of mathematics and physics on the success of South African engineering technology students. International Journal of Engineering Education, 31(4), 1158–1166. https://research.rug.nl/en/publications/impact-of-mathematics-and-physics-on-the-success-of-south-african
- Weinstein, C. E., Palmer, D. R., & Acee, T. W. (2016). User’s manual: Learning and Study Strategies (3rd ed.). H&H Publishing Company, Inc.
- Weinstein, C. E., Schulte, A., & Palmer, D. (1987). LASSI: Learning and Study Strategies Inventory. H & H Publishing.
- Wilson-Strydom, M. (2015). University access and success: Capabilities, diversity and social justice. Routledge.
- Yeager, D. S., & Dweck, C. S. (2012). Mindsets that promote resilience: when students believe that personal characteristics can be developed. Educational Psychologist, 47(4), 302314. https://doi.org/https://doi.org/10.1080/00461520.2012.722805
- Zimmerman, B. J. (2000). Attaining self-regulated learning: Asocial-cognitive perspective. In M. Boekaerts, P. Pintrich, & M. Zeidner (Eds.), Handbook of Self-Regulation (pp. 13–39). Academic Press.
- Zimmerman, B. J. (2002). Becoming a self-regulated learner: an overview. Theory into Practice, 41(2), 64–70. https://doi.org/https://doi.org/10.1207/s15430421tip4102_2