
 ?Mathematical formulae have been encoded as MathML and are displayed in this HTML version using MathJax in order to improve their display. Uncheck the box to turn MathJax off. This feature requires Javascript. Click on a formula to zoom.
Abstract
This study adopted an item response theory to evaluate the Grit-S scale and its dimensions (i.e., Consistency of interest [G-CI] and Perseverance of effort [G-PE]) among university students (N = 450) using two unidimensional Graded Response (GR), multidimensional GR, and bifactor GR models. Differential item functioning (DIF) across two countries (Oman and the United States) was investigated. For G_CI, the findings showed acceptable values for item discrimination, trait thresholds, reasonable precision in both samples, and two uniform DIF. The findings of G_PE showed two questionable item-discrimination parameters (Items 7 and 8) in the two samples, two non-uniform (i.e., Items 5 and 8) and two uniform DIF (i.e., Items 6 and 8). Acceptable precision was found only in the U.S. sample. Item 8 was the source of imprecision in the Omani sample. These results indicated that further modification is needed to improve the precision of the scale in the Omani culture.
PUBLIC INTEREST STATEMENT
This study adopted an item response theory to evaluate the psychometric properties of the Grit-S scale and its two dimensions (i.e., Consistency of interest and perseverance of effort) among university students. Furthermore, it investigated any cultural differences in the estimated parameters among Omani and U.S. samples. For consistency of interest, the findings showed acceptable values for item discrimination, trait thresholds, reasonable precision in both samples, and cultural variation in the two items. The findings of perseverance of effort showed two questionable item-discrimination parameters in the two samples, two non-uniform, and two uniform DIF. Acceptable precision was found only in the U.S. sample related to the perseverance of effort dimension. Item 8 was the source of imprecision in the Omani sample. These results indicated that further modification is needed to improve the precision of the scale in the Omani culture.
1. Introduction
Grit is one of the recently developed motivational concepts that partially influence students’ academic and personal outcomes (e.g., Alhadabi & Karpinski, Citation2020; Kwon, Citation2021). Duckworth et al. (Citation2007) define grit as the ability to perform enthusiastically and diligently to accomplish long-term goals and objectives even when faced with obstacles along the way. This construct consists of two dimensions: (1) Consistency of interest (G-CI) and (2) Perseverance of effort (G-PE). G-CI refers to the propensity to embrace a similar array of attentiveness and involvement for a lengthened time. G-PE, on the other hand, pertains to the degree to which a person exerts an enduring effort when difficulties arise (Duckworth & Quinn, Citation2009).
A burgeoning body of psychometric literature reveals four primary themes. First, three grit scales were constructed (i.e., 27-item scale, 12-items Grit-O, and 8-items Grit-S). The shortest grit scale (i.e., Grit-S) was the primary area of interest in the current study. Second, prior psychometric studies have examined the Grit-S scale using Classical Test Theory (CTT), which includes (1) Investigating the scale’s factorial structure, (2) Estimating its Internal Consistency Reliability, (3) Substantiating different types of validity (e.g., construct, consensual, and predictive), and (4) Assessing factorial invariance across groups through multi-group confirmatory factor analysis (CFA) models. CTT, however, has several limitations related to the accuracy of inferences made from the scale data (Crocker & Algina, Citation2008) and the robustness of the scales’ psychometric properties (Bond & Fox, Citation2015). These limitations stem from the following: (1) Testing the whole scale (not the items) by providing one correlation coefficient between each item and the total score (e.g., total item-scale correlation and a person’s total score; Crocker & Algina, Citation2008), (2) The inability to examine the individual item and person misfit, and (3) The generation of statistics that depend on scale length and sample characteristics (Jabrayilov et al., Citation2016).
Third, several cultures adopted the Grit-S, resulting in many versions, including Arabic (Alhadabi et al., Citation2019), Turkish (Akin et al., Citation2011), German (Fleckenstein et al., Citation2014), Japanese (Nishikawa et al., Citation2015), and Filipino (Datu et al., Citation2016). Fourth, cross-cultural differences in the psychometric properties of the Grit-S, however, have been documented across individualistic and collectivistic countries (Alhadabi et al., Citation2019; Datu et al., Citation2016). For instance, Alhadabi et al. (Citation2019) found that G-PE explained a higher variance among Omani/Arabic students, while G-CI accounted for a more substantial variance among U.S. students. Furthermore, evidence of lacking measurement invariance was obtained across the two cultures. These inconsistencies necessitated a further assessment of the Grit-S using a more precise methodological approach such as assessing differential item functioning (DIF).
The shortcomings of the Grit-S scale raise concerns about the soundness of this assessment instrument and highlight the need for a more detailed methodological approach to assessing the scale’s psychometric properties. This quest is substantiated by several empirical studies that discount grit as a concept and question its dimensionality (e.g., Datu et al., Citation2016; Ponnock et al., Citation2020). Item Response Theory (IRT) can achieve this objective by providing more informative parameters (e.g., item-difficulty, person-ability, and item-discrimination parameters) that are not sample-dependent and reflect accurate estimates of misfit items and persons (De Ayala, Citation2009). The selection of an optimal IRT model depends on the items, the response scale, and the number of estimated parameters in the models tested. According to Samejima (Citation2010), the Graded Response (GR) Model is the appropriate two-parameters IRT model for analyzing polytomous items that use a Likert rating scale; therefore the GRM is well-suited for assessing the items in Grit-S. As well, IRT underlines the assumption of unidimensionality for the tested scale, suggesting fitting two GR to G-CI and G-PE, respectively. A multidimensional GR was examined to account for the two-factor solution structure presented by Duckworth and Quinn (Citation2009) and with the factorial structure of previous CTT studies that examined the Grit-S scale. A bifactor GR model also was considered to model two sources of variability in the items’ scores, including the influences of a general factor (i.e., grit) and specific dimensions (i.e., G-CI and G-PE). Models’ comparison was necessitated across the four models (i.e., Unidimensional G-CI, unidimensional G-PE, multidimensional, and the bifactor model).
Therefore, the current study used IRT to evaluate the Grit-S scale and DIF to examine item invariance among university students in two individualistic and collectivistic countries (i.e., Oman and the U.S.). The following section reviews the literature on grit, the dimensionality of grit across cultures, and the use of IRT in the development of psychological tests.
2. Literature review
2.1. Grit
Motivation has long been touted as a fundamental component of personal, academic, and professional success and harvesting the desired accomplishments. This concept might be substantially critical among university students. However, any person who has tried to achieve a specific goal during the university stage knows that academic life is not totally rosy, precisely when difficult setbacks occur and appealing alternatives compete. For example, how many students choose to change their major or even drop school because the grades were bad, the learning material was hard, the learning experience was discouraging, or the instructor did not teach as expected? What about how many students spend countless times using social media apps (e.g., Snapchat, Instagram, Tiktok, etc.) or glued their eyes to the screen watching Netflix instead of working on their assignments and preparing for exams?
The psychological literature, unfortunately, offers no single reason why some students persevere while others languish and fail to reach their goals. Some researchers attribute success in achieving goals to different types of motivational concepts and regulatory processes (e.g., a want-to versus the have-to approach of motivation, grit, a growth mindset versus a fixed mindset, self-control; Duckworth et al., Citation2007; Dweck, Citation2007; Ryan & Deci, Citation2017; Werner & Milyavskaya, Citation2018). In particular, grit details two components (i.e., G-PE and G-CI) that provide adequate explanations for students’ behavior in the academic context. When students are confronted with difficulties, their mindset matters. Students who try to find solutions to the difficulties they face and persevere in their efforts to succeed have a healthier attitude and are more likely to reach their goals than students who approach difficulties with a flight mindset that prompts them to escape and avoid dealing with the problem (Stichter, Citation2020). Comparatively, when students are faced with other competing and captivating activities, a continuous interest for an extended period would reduce the response to distraction and aggrandize the state of flow that students live when they pursue their goals (Ullén et al., Citation2016).
Avoiding the oversimplification trap, the contribution of the grit concept to students’ academic success among university students is supported by a burgeoning body of psychological literature. Prior studies have shown that grit has direct and indirect associations with several outcomes regarding the educational context. For instance, grit correlated with indicators of academic success, including first-year GPA (Whipple & Dimitrova, Citation2020), freshman retention (Arouty, Citation2015), and graduation rate (Eskreis-Winkler et al., Citation2014). Credé et al. (Citation2017) in their recent meta-analysis study (N = 73 studies) revealed that grit correlated with undergraduate GPA, retention, intent to persist in college, college satisfaction, and self-efficacy. Simultaneously, grit has positive associations with intermediate cognitive practices such as achievement goal orientations (Alhadabi et al., Citation2019) and academic engagement (Datu et al., Citation2016). A recent study showed dimensions of grit (i.e., G_CI and G_EP) also had indirect effects on university students’ academic achievement through a series of mediators, including self-efficacy and achievement orientation goals (Alhadabi et al., Citation2019).
Another large portion of the literature also has revealed that grit was predictive of several behavioral and personal outcomes. For example, grit was positively associated with higher levels of well-being (Datu et al., Citation2016; Kwon, Citation2021), resilience, effective coping mechanisms (Fillmore, Citation2015), and life satisfaction (Li et al., Citation2018). In another example, grit constructively correlated with a healthier lifestyle, as indicated by an increase in a constructive coping mechanism (Zhang et al., Citation2021), lower odds of alcohol consumption and marijuana use, and less involvement in delinquent behavior (Guerrero et al., Citation2016). At the interpersonal level, grit was significantly associated with more appropriate parenting styles, particularly in areas such as autonomy, acceptance, and parental involvement (Howard et al., Citation2019), and a higher level of perceived popularity and friendships among peers (Lan, Citation2020). For instance, Lan (Citation2020) found a considerable latent heterogeneity in the two dimensions of grit in terms of their relationship with students’ popularity as perceived by peers. The finding of the latent profile analysis showed five main profiles, which are: Profile 1 (i.e., extremely low consistency and perseverance), Profile 2 (i.e., low consistency and low to moderate perseverance), Profile 3 (i.e., extremely low consistency and high perseverance), Profile 4 (i.e., medium consistency and perseverance), and Profile 5 (i.e., high consistency and high perseverance). The finding further revealed that students in the Profile 5 were rated as more popular than their peers in other profiles, especially students in Profile 2 (i.e., low consistency and low to moderate perseverance).
2.2. Grit dimensionality across cultures
Several studies have questioned the soundness of grit as a concept, its dimensionality, and its stability across cultures (Alhadabi et al., Citation2019; Credé et al., Citation2017; Datu et al., Citation2016). The literature provides inconsistent conclusions about the hierarchical second-order factorial structure of grit. Some studies showed that the grit scale maintained its two-factor solution, which loaded onto grit, as a higher second-order latent factor (Akin et al., Citation2011; Fleckenstein et al., Citation2014; Nishikawa et al., Citation2015). In contrast, a more recent meta-analysis of 78 studies showed that the higher second-order factorial structure of grit was not established (Credé et al., Citation2017). This study, along with other prior research, confirmed that G_EP had more substantial validity evidence compared with G_CI (Datu et al., Citation2016), particularly across different cultures. That is, G_EP dimension explained more variance in collectivist communities than did G_CI (Alhadabi et al., Citation2019; Datu et al., Citation2016). Correspondingly, G_EP was more salient in predicting academic engagement and subjective well-being in collectivist cultures (e.g., Oman) relative to G_CI. Contrarily, G_CI explained more variance in individualistic samples (e.g., U.S.; Alhadabi et al., Citation2019). Additionally, results of multi-group CFA indicated all levels of measurement invariance were not obtained, which supports the need for examining DIF across different demographic groups.
These findings underline that only one dimension (i.e., individualism versus collectivism) of Hofstede’s (Citation2001) theoretical framework seems more influential on grit dimensionality. Individualistic students as is the case in the U.S. tend to glorify the self, adore self-sufficiency, precede the benefit of the self above anything else, focus on uniqueness, and achieve their dreams. This can be attributed to individualistic cultures’ tendency to award personal accomplishments that enable the person to stand out. For instance, American students show continuous interest and huge persistence over a long period to be great actors or successful sports players. On the other hand, students from collectivistic cultures as is the case with Omani students tend to focus on achieving the goals of the group (e.g., family, friends, school, or the nation), adhering to social norms, showing commitment, caring about others, and creating a sense of harmony. The relationship with others is highly valued (Hofstede, Citation2001). Given that, students in such cultures may delay the achievement of personal goals, in an attempt to serve the benefit of the group. For instance, the convenience of the family is a priority in Oman, thus, the oldest child in the family might delay the achievement of personal goals until the family status improves. Balancing between the group and personal purists requires perseverance of effort.
Five studies were conducted, assessing grit scales among individualistic cultures, mainly U.S. samples (Gonzalez et al., Citation2020; Midkiff et al., Citation2016; Morell et al., Citation2020; Muenks et al., Citation2017; Ponnock et al., Citation2020). Two of these studies used CTT to examine the factorial structure of grit among adolescents (Ponnock et al., Citation2020) and among a diverse sample of respondents to Amazon’s Mechanical Turk, a crowdsourcing website that businesses can use to hire remote workers to perform specific on-demand tasks (Gonzalez et al., Citation2020). These two samples, however, vary significantly from the university students that comprise the sample used in the current study. The other three studies adopted IRT when examining the grit scale using different samples, which were: (1) American high school, American college, and Korean college students (Morell et al., Citation2020), (2) American high school and college students (Muenks et al., Citation2017), and (3) First-generation college students (Midkiff et al., Citation2016). Overall, these studies criticized Grit-S scale dimensionality and showed that the estimated factorial structure of the grit scale was inconsistent with the factorial structure of the original Grit-S scale and thus advocated for a more stable single-factor solution (Gonzalez et al., Citation2020; Morell et al., Citation2020; Muenks et al., Citation2017). Midkiff et al. (Citation2016) examined a nine-item scale, which differs from the eight-item Grit-S scale examined in the current study. In contrast, little is known about the use of IRT to assess the grit scale’s factorial structure when used with collectivist samples such as the Omani university students in the current study. A limited number of studies have used IRT to assess the grit scale when examining individualistic and collectivistic cultures (e.g., Morell et al., Citation2010).
As mentioned earlier, culture plays an essential role in substantiating the Grit-S factorial structure. Such a role can be understood in the light of student characteristics in the individualistic and collectivist contexts (Ting-Toomey & Chung, Citation2012). Meaning, students in the individualistic culture predominately emphasize the need of the individual over the group. Students, therefore, focus intently on personal independence, a self-first mentality, assertiveness, and achieving personal goals, implying those learners may exhibit a greater consistency of interest in achieving specific goals quicker. Leaners in a collectivistic culture, on the other hand, focus on accomplishing the group’s goals rather than their own over individual goals. Such students are attentive to others’ needs, demonstrate selflessness, seek interpersonal harmony, and pursue personal goals and family/group mutually as circumstances allow. When a conflict occurs between an individual’s needs and the needs of others (e.g., especially the significant other in the inner circle like family members and peers), students in a collectivistic culture may show a lower level of consistency of interest in their own goals as they attempt to create a state of equilibrium between their personal goals and the goals of others. Nonetheless, students in a collectivist culture are likely to show incredible perseverance of effort to accomplish their dreams regardless of the difficulties (e.g., delays in their achieving goals and family pressure) they face (Alhadabi et al., Citation2019; Datu et al., Citation2016).
2.3. IRT in psychological scale construction
IRT is a precise methodology that has been universally adopted to develop standardized tests in the educational and health fields, yet much less in psychology (Zanon et al., Citation2016). Although the narrow use of IRT during psychological test development, IRT outdo the drawbacks of CTT because of three reasons. First, IRT allows researchers to explore each item in greater detail by providing three parameters (Bond & Fox, Citation2015), which are item difficulty parameter, person performance (i.e., on an aptitude test) or ability (i.e., on an attitude measure), and item discrimination parameter. Second, the scale statistics generated by IRT are invariant across persons and items. Third, the association between trait/ability and item performance in IRT can be estimated by several logistic functions that differ in the number of parameters (i.e., a one-parameter [1-PL], two-parameter [2-PL], or three-parameter [3-PL]; see, EquationEquation 1)(1)
(1) .
De Ayala (Citation2009) represents three main parameters: (1) Item discrimination, which is represented by ai, reflects the steepness of the item characteristic curve and the ability to differentiate among persons placed at various positions of the latent trait, (2) Item difficulty/tem threshold, which is represented by bi, indicates the likelihood of selecting an item that demonstrates the latent trait, and (3) Pseudo guessing parameter, which is represented by ci. The other characters in the above-mentioned equation are: e = 2.718 and D= 1.7 (i.e., an exponential constant and a scaling factor, respectively; Han, Citation2013).
Consistently, IRT provides numerous models from which the researchers can choose (e.g., the Generalized Partial Credit Model, Partial Credit Model, Graded Response Model, the Rating Scale Model; De Ayala, Citation2009; Bond & Fox, Citation2015; Linacre, Citation2002). The choice of the best model is determined by the type of the items, the number of estimated parameters, and the response scale. For instance, with Rasch analysis, which estimates one parameter (i.e., 1-PL), the rating scale model is suitable for analyzing polytomous data (e.g., the Likert scale), in which the even category weight and response structure are assigned to all items (Bond & Fox, Citation2015). Interested readers are referred to several statistical textbooks (De Ayala, Citation2009; Reckase, Citation2009; Reise & Revicki, Citation2015) for a detailed description.
Despite these appealing advantages of IRT over CTT, it is important to note that IRT is not linear and that it makes two assumptions: local independence and unidimensionality (Cai et al., Citation2011; Linacre, Citation2002). The first assumption, local independence, assumes that items are not correlated to each other. Chen and Thissen (Citation1997) proposed a measure of local independence, x2LD, in which the x2LD values for each pair of items should be less than 10 to provide evidence of local independence.
For the second assumption, unidimensionality is tested by three techniques: (1) Confirmatory factor analysis, (2) Rasch Principal Components Analysis (PCA), if a minor unaccountable variance is found in the first contrast (i.e., < 2.00) when performing 1-PL/Rasch analysis, and (3) Parallel analysis (De Ayala, Citation2009; Linacre, Citation2002; Zanon et al., Citation2016). If the assumption of unidimensionality has been met, one IRT model can be fit. Otherwise, different suggestions have been provided. In handling dimensionality, Reise (Citation2012) and Toland et al. (Citation2017) articulate the necessity of analyzing the fit of different models that can be applied to CTT and IRT frameworks, which include:
Fitting one unidimensional model where all items are loaded in one general factor (e.g., grit; see, Figure - Model A).
Figure 1. Modeling dimensionality.
Fitting more than one unidimensional model to each dimension (e.g., G_EP and G_CI), assuming no correlation between the dimensions (see, Figure -Model B).
Fitting a multidimensional IRT (MIRT) where dimensions are correlated (see, Figure -Model C).
Fitting a higher-order model where the dimensions (e.g., G_EP and G_CI) are correlated and loaded in a higher-order factor (e.g., grit; see, Figure - Model D). In this model, the items are allowed to load in the dimensions only.
Fitting a bifactor model where items are allowed to load in a general factor, also known as the primary trait (e.g., grit), and in specific latent dimensions/traits/groups (e.g., G_EP and G_CI; see, Figure - Model E). The specific traits are not correlated. In other words, the bifactor model assesses two sources of variance: variance associated with the general factor and specific dimensions.
A common practice that is highly recommended in the literature is fitting unidimensional IRT to each dimension, as visualized in Model B (De Ayala, Citation2009). Yet, a growing body of literature, yet rarely used in applied research, advocates for fitting the bifactor IRT, as visualized in Model E for several reasons (Canivez, Citation2016; Reise, Citation2012; Toland et al., Citation2017). The bifactor model facilitates modeling the direct influences of the general factor and specific sub-traits on items better than the second-order and unidimensional models. Furthermore, the bifactor IRT offers more precise items’ and persons’ parameters. It investigates the variability associated with the general factor and variability associated with specific dimensions. The current study adopted four models, including (1) Two unidimensional GR models for G_CI and G_PE (Model B), (2) One multidimensional GR model (Model C), and (3) One Bifactor GR model (Model E). Doing so, however, necessitates comparisons among the above-mentioned models.
2.4. The unidimensional graded response (Uni-GR) model
When estimating the 2-PL model, the Uni-GR is the appropriate model for analyzing polytomous items that use the Likert rating scale (Samejima, Citation2010), as clarified in EquationEquation 2(2)
(2) . In this model, two parameters are estimated (item difficulty and item discrimination). Item difficulty/category threshold (bi) indicates the easiness of endorsing an item that reflects the latent trait. With the Likert scale, bi represents the point at which the individual with a certain level of measured trait has an equal probability (50:50) of endorsing an item across adjacent response categories (e.g., Agree vs. Strongly Agree). For a five-point scale, only four threshold parameters are estimated (k-1, where k is the number of categories). Item discrimination (ai) reflects the item’s ability to differentiate among persons located at different points of ability and is graphically presented as the steepness of the item characteristic curve. The pseudo-guessing parameter (ci in EquationEquation 1)
(1)
(1) is eliminated. Also, the constant D is not estimated when conducting IRT using IRTPRO software (Cai et al., Citation2011). Two unidimensional graded response models are suitable for modeling the G_CI and G_PE individually, as presented in EquationEquation 2
(2)
(2) , considering the ordered categorical five-point Likert scale.
2.5. The multidimensional graded response (Multi-GR) model
The unidimensional model is extended to the Multi-GR model that assesses multiple correlated dimensions and ordered categorical item responses. Toland et al. (Citation2017) underline the need for transformation of the IRT parameterization of discrimination and category threshold, presented in EquationEquation (2)(2)
(2) , into the slope (ɑj) and category-intercept (cj(k)) parameterization that is adopted within the factor analysis framework. This step is attributed to the fact that the IRT parameterization is not directly generalized to the multidimensional IRT models (Cai et al., Citation2011). As a result, the Multi-GR model is presented as follows:
P is the probability of responding to k category given a person’s location on the M latent dimensions, ( …
) are item slope parameters,
is the category k’s item intercept, and (
…
) is a vector of person i location in the M continuous latent dimensions. These values are assumed to follow a normal distribution with a mean of zero and a variance of one.
2.6. The bifactor graded response (Bifac-GR) model
Toland et al. (Citation2017) express the Bifac-GR model as a special case of Multi-GR, where the item response is a function of a general factor (G) and specific dimensions (SS), resulting in EquationEquation (4)(4)
(4) . P is the probability of responding to k category given a person’s location on the general factor (G) and specific dimensions (S),
is the category k’s item intercept, (
) are conditional item slope parameters on the general factor (G) and specific dimensions (S), and (
) are a person i locations on G and S. In the Bifac-GR, the G and S are uncorrelated (i.e., orthogonal). In the case of the Grit-S scale, each individual will have three trait scores: one general factor (grit) and two specific dimensions (G_CI and G_PE).
2.7. Study AIM
The above-mentioned findings highlight that CTT assessment of the Grit-S psychometric properties has several defects. These defects can be avoided when using IRT which provides more accurate parameters. As far as the author knows, the assessment of the Grit-S scale in the Arabic context using IRT has not been established. Most importantly, culture plays a role in identifying the IRT parameters of the Grit-S scale. Therefore, the purpose of the current study was to assess and evaluate the Grit-S scale among university students using four GR models. The study also sought to investigate item invariance and DIF across the two cultures (Omani and U.S. university students). The following research questions were addressed:
(RQ1) What are the psychometric properties and the GR parameters for the G-CI dimension?
(RQ2) What are the psychometric properties and the GR parameters for the G-PE dimension?
(RQ3) Is there evidence of DIF across the two cultures?
Furthermore, the current study investigated three research hypotheses. First, the G-CI dimension has good psychometric properties and GR parameters among Omani and U.S. samples. Second, the G-PE dimension has good psychometric properties and GR parameters among Omani and U.S. samples. Third, DIF variations are expected between the two cultures.
3. Method
3.1. Participants
After approval of the study was received from the institutional review board, an online survey was distributed by email and social media to invite university students in Oman and U.S. to participate in the study. In particular, recruitment emails and posts were sent to departments and colleges at one, large, public, research university in Oman and one, large, public, research Midwestern university in the U.S. These institutions are 4-year degree-granting institutions that offer graduate programs. A total of 450 students—250 from Oman and 199 from the U.S. agreed to do so. The sample consisted of 122 (27.10%) males and 330 (73.00%) females. The mean age was 23.41 years (SD = 7.26). The majority of the students (n = 362, 80.00%) were undergraduates and 88 (19.50%) were graduate students.
3.2. Measures
A survey was delivered online and only to those students who had agreed to participate in the study. The delivery/recruitment consisted of emails and social media posts (i.e., Facebook, Twitter) posts, including a greeting, an overview of the study topic, the purpose of the research, and a private web link. Upon opening the link, participants were prompted to read an informed consent document and then click “Next” to acknowledge that they consent to participate in the study, assume no risks, and they may end their participation in the study at any time. Next, the participants completed the survey online, which required no identifiable information and used a non-traceable link. All data were secured on a password-protected computer which only the researchers on the IRB form can access. The study adopts the descriptive cross-sectional design (Gay et al., Citation2012).
The first part of the survey collected demographic information, including age, major, nationality, and level of study (i.e., undergraduate student or graduate student). The second part of the survey, the Grit-S scale, is an eight-item scale that assesses a range of grit attributes that pertained to the two dimensions (i.e., G-CI and G-PE; Duckworth & Quinn, Citation2009). Examples of the G-CI items include the following: “New ideas and projects sometimes distract from previous ones” and “I often set a goal but choose to pursue a different one”. The G-CI items are reversely coded 4 items (i.e., Items 1–4). Whereas the G-PE items are positively coded 4 items (i.e., Items 5–8 items; e.g., “I am diligent.”). For the Omani sample, the Arabic version of Grit-S was administered (Alhadabi et al., Citation2019). Prior studies substantiated the two-factor solution and showed that Cronbach’s coefficients were good in the Omani and U.S. university students (Cronbach’s α = .79 and .76, respectively; Alhadabi et al., Citation2019).
3.3. Data analysis
Demographic descriptive statistics were examined using SPSS for Windows Version 24.0. Data were screened for missing data, normality, and outliers before the primary analyses were conducted. Two assumptions—unidimensionality and local independence—were reviewed (Cai et al., Citation2011). For the dimensionality assumption, preliminary exploratory and confirmatory factor analyses substantiated the two-factor solution of the Grit-S scale for the Omani sample and the American samples (Alhadabi et al., Citation2019). Grit-S has polytomous items that use a Likert rating scale, implying the appropriateness of fitting GRM (Samejima, Citation2010). Thus, two Uni-GR, the Multi-GR, and the Bifac-GR models were fitted to assess the items’ characteristics using IRTPRO 4.2 (Cai et al., Citation2017). Local independence was assessed using the χ2LD index. Values greater than 10 would be cause for concern and indication of local dependence (Chen & Thissen, Citation1997).
For the GR models, two parameters were estimated: Item-discrimination (ai) and item-thresholds (bi). The one item-discrimination parameter was estimated for each item in the scale, while the item-threshold parameters were estimated for each of the four transition points between the five response categories for each dimension, yielding a total of four threshold estimates. The overall fit of the GRMs can be determined by the presence of a non-significant M2 statistic and a low root-mean-square-error of approximation (RMSEA < .05). To select the best model among the two competing models (i.e., two Uni-GR, the Multi-GR, and the Bifac-GR), several fit criteria were examined, including (1) Lower values of Akaike Information Criterion (AIC), (2) Lower values of Bayesian Information Criterion (BIC), and (2) Lower value of RMSEA (Immekus et al., Citation2019).
However, IRT’s essence is assessing individual items’ fit and not the overall scale fit (Toland, Citation2014). Next, the individual items were assessed using three indices: (1) S-X2 fit index, (2) Item discrimination, and (3) Item difficulty/ability, as assessed by four thresholds. A generalized S-χ2 fit index was used to evaluate each item’s fit for polytomous data. Items with values > .01 were considered to have a good fit (Orlando & Thissen, Citation2003; Toland, Citation2014). Baker (Citation2001) provides criteria for gauging item discrimination, as follows: ai < .20 reflects very low discrimination, .21 < ai < .40 suggests low discrimination, .41 < ai < .80 reflects moderate discrimination, .81 < ai < 1 suggests high discrimination, and ai > 1.00 reflects very high discrimination. In general, a range of ai from .50 to 3.0 is considered good (De Ayala, Citation2009). For item difficulty, a range for bi from −2.00 to 2.00 is considered optimal (Baker, Citation2001). Items with item difficulty values beyond the range of −3.00 to 3.00 are questionable (Toland, Citation2014). The current study addressed the limitation of the small sample size, particularly the American sample (n = 199), by reporting the supplemented Expectation-Maximization standard error (S-EM). The use of the S-EM in this instance is supported by Paek and Cai (Citation2014). The researchers conducted a simulation study examining the performance of three types of standard error (i.e., empirical cross-product method [Xpd], S-EM, and Fisher information approach [FIS]). They found that the S-EM is the most accurate estimator of standard error with small sample sizes and long tests.
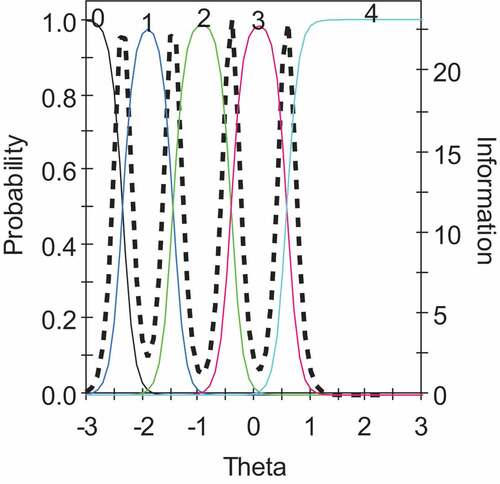
In addition, the total test information function (TIF) was used to provide a visual representation of the scale’s precision by identifying two sources of details (i.e., the test information and error; De Ayala, Citation2009). Ideally, the test information should be higher than the error at moderate levels and lower than the error at the extreme points on the trait continuum. The item response function (IRF) and trace lines were used to visualize each item’s parameters. The optimal visual is a monotonic increase in the probability along the trait continuum for the IRF and smooth-rolling hills for the trace lines. Both of these, together, indicate that each increasing response category is more likely to be selected across the latent trait continuum.
Furthermore, DIF was used to compare the two cultures (i.e., Omani and American students). The DIF flags the items that behave differently across groups in terms of item discrimination and ability threshold estimates (De Ayala, Citation2009). A two-step approach, as described by Woods (Citation2009) was followed to estimate DIF to reduce imprecision in parameter estimates and reduce the likelihood of an inflated Type I error. In Step 1, DIF was tested by applying the modified Wald test and considering all items as anchors (Cai et al., Citation2011). In Step 2, a set of items with the smallest values for likelihood ratio divided by the degree of freedom were selected to be designated as anchors (Woods, Citation2009). Then, each item was tested for DIF by comparing the items with designated items. The result was three χ2 distributions: (1) Omnibus test or Total χ2; (2) A non-uniform DIF(χ2a), which reflects DIF in discrimination estimates; and (3) the uniform DIF, χ2b, which reflects the DIF in threshold estimates. Critical p-values (i.e., p < .01) hint at the presence of DIF (Chiesi et al., Citation2020).
4. Results
This section presents the findings of four parts, which include (1) The assessment of the GRM assumptions, (2) The comparison of the fit of the two Uni-GR, the Multi-GR, and the Bifac-GR models, (3) The Uni-GR parameters for G_CI dimension, (4) The Uni-GR parameters for G_PE dimension, and (5) The DIF estimates by nationality for the two dimensions. Table shows the fit of the four models. Table displays the individual items fit, item discrimination, and threshold parameters for the G_CI and G_PE. The items and test precision estimates are presented in Table and Figure . Lastly, Table reviews DIF estimates. Suboptimal indicators were flagged in bold.
Figure 2. Total Test Information Function for consistency of interest (top two plots) and perseverance of effort (down two plots) among the Omani and U.S. samples.
Table 1. The Fit of the two uni-dimensional, multi-dimensional, and bifactor GR models of Grit-S Scale
Table 2. Descriptive Statistics and Graded Response Model Parameter estimates for the Grit-S Scale Items
Table 3. Graded response model item information function and test information function
Table 4. DIF Statistics based on Nationality (Omani and American Students)
4.1. Assessment of the GRM assumptions
Local independence assumption was investigated. The G_CI, χ2LD values were acceptable in the Omani sample (i.e., between .09 and 6.6) and in the U.S. sample (i.e., between −.08 and 2.5). These values were below the cutoff of 10, implying no concern about local dependence (Chen & Thissen, Citation1997). Likewise, the local independence was deemed tenable for G_PE because the χ2LD values were less than 10 in the Omani sample (i.e., between −0.50 and 2.00) and in the U.S. sample (i.e., between −0.40 and 8.80).
4.2. IRT Models fit comparison: unidimensional, multidimensional, bifactor models
The two Uni-GR models (i.e., G_CI and G_PE) had a good model fit, as indicated by a nonsignificant M2 and an acceptable RMSEA (i.e., < .05; see, Table ). The Multi-GR and Bifac-GR models had a significant M2, indicating a poor fit for this model; however, the RMSEA met the optimal standard (i.e., < .05). The two Uni-GR models also had lower values of AIC and BIC compared with the Multi-GR and Bifac-GR models. These findings indicate that the unidimensional models had a better model fit than the Multi-GR and Bifac-GR models (Immekus et al., Citation2019). Therefore, the findings for the unidimensional models are presented next.
4.4. The GRM findings of G_CI dimension
After reviewing the individual item fit (see, Table .A), the S-χ2 fit index showed that all items—except Item 3—had an acceptable fit in the two samples. For Item 3, the fit for the U.S. sample was marginal. The item-discrimination parameters for all items—except for Item 3—were within the acceptable range. For Item 3, the item-discrimination parameter (ai = 3.17) was marginally higher than the cutoff of three in the Omani sample.
All of the item-difficulty thresholds (i.e., b1,b2,b3,b4) were within the optimal range in the Omani sample (i.e., −2.88 to 2.88) and the U.S. (−2.98 to 1.82) sample (see, Table .A). The majority of first and second thresholds were less than two, implying that items were most useful in distinguishing students with a moderate level of G_CI. However, Items 1 and 2 in the Omani sample and Item 1 in the U.S. sample were more useful in identifying students with extreme levels of G_CI (i.e., b1 > 2.00).
The item information estimates across the trait continuum showed that the highest amount of information and the lowest standard error was obtained for the G_CI that ranges from −1.60 to 1.60 (see, Table .A). The TIF reflected an acceptable precision in the two samples (see graphs A and B in Figure ). The maximum amounts of information at the trait level were 6.25 and 6.74 in the Omani sample and .80 and −.80 in the U.S. sample. These findings mean that the students in the U.S. more easily endorsed G-CI than the students in the Omani sample.
4.5. The GRM findings of G_PE dimension
The S-χ2 fit index demonstrated that items had an optimal fit in both samples (see, Table .B). Among specific items, Items 5 and 6 were within the good range of discrimination parameters in both samples, while the discrimination for Items 7 and 8 was considerably beyond the cutoff of three for the Omani sample (ai7 = 4.09 and ai8 = 9.66) and the U.S. sample (ai7 = 4.05 and ai8 = 3.28). These results made it necessary to examine additional parameters for Items 7 and Item 8.
The threshold parameters (i.e., b1,b2,b3,b4) were acceptable in the U.S. sample (i.e., −2.93 to 2.79); however, two thresholds for Items 5 and 6 were high in the Omani sample (see, Table .B). The majority of the first and second thresholds were higher than the two in the Omani sample, implying that items were most useful in distinguishing students with extreme values of G_PE. In the U.S. sample, the thresholds for three items (i.e., Items 5, 7, and 8) were less than or nearly two, suggesting that these items were beneficial in discerning students with a moderate level of G_PE.
Item information estimates showed a clear difference between the Omani sample and the U.S. sample (see, Table .B). The largest amount of information was obtained at different ranges of G_PE in the Omani sample (i.e., −2.40 to .80) and the U.S. samples (i.e., 2.00 to .80). Intolerably, the TIF exhibits a turbulent amount of information across the trait continuum, implying that the G_PE items had low precision in the Omani sample (see graph C in Figure ). The standard error was considerably higher than the test information at θ of −.80 and 0.00. Item 8 was the source of imprecision because the smooth-rolling hills were not seen (see, Figure ). For the U.S. sample, the TIF reflected an appropriate precision (see graph D in Figure ). The maximum amounts of information were 28.86 in the Omani sample and 8.16 in the U.S. sample at different trait levels (i.e., −0.40 and .40). These findings mean that the students in the Omani sample easily endorsed G_PE compared with the students in the U.S. sample.
Figure 3. Item 8 Information Function (IIF) for the perseverance of effort in the Omani sample.
4.6. DIF estimates by nationality for Grit-S scale G-CI and GPE dimensions
For G_CI, none of the items showed a non-uniform DIF (i.e., p-values ranged between .02 to .49); however, Items 1 and 2 exhibited uniform DIF, reflecting DIF in the threshold estimates between the two samples. For G_PE, Items 5 and 8 showed non-uniform DIF, suggesting DIF in the discrimination parameter. Also, Items 6 and 8 exhibited uniform DIF, indicating DIF in the threshold estimates between the two samples (see, Table ).
5. Discussion
The complement between the students’ cognitive and noncognitive qualities ensures better academic and personal outcomes in the higher education context. One of the noncognitive characteristics that recently has received considerable attention is grit, which can be measured by the Grit-S scale. The majority of prior psychometric studies adopted CTT, suggesting some potential issues about the factorial structure and item invariance across cultures. Therefore, the current study used the IRT approach to provide a precise diagnosis of scale psychometric properties, answering three research questions. Questions 1 and 2 focused on the psychometric properties and the GR parameters for G-CI and G-PE dimensions. They were answered by fitting the two Uni-GR, the Multi-GR, and the Bifac-GR models. The third question examined the differences between the two cultures by estimating the DIF estimates.
The findings showed no concern about local dependence or the redundancy of items in the two samples for G_CI and G_PE, meeting the criteria stated by Cai et al. (Citation2011) and Linacre (Citation2002). For the G_CI dimension, the Uni-GR findings revealed acceptable values of item discrimination and trait thresholds. Also, the IIF and the TIF reflect reasonable precision in estimating G_CI in the two samples. Overall, G_CI was easily endorsed by the U.S. students relative to the Omani students, which explains the higher variance obtained from the U.S. sample when conducting exploratory factor analysis (Alhadabi et al., Citation2019).
For G_PE, the Uni-GR findings showed two questionable item-discrimination parameters (i.e., Items 7 and 8) in the two samples. The IIF and TIF reflected reasonable precision in estimating G_PE in the U.S. sample only. The precision of G_PE was implausible in the Omani sample because the standard error was higher than the total information at two points (i.e., −0.80 and 0.00) in the moderate level of the G_PE continuum. A review of the IIF showed that Item 8 was the source of this higher level of standard error, suggesting the need to modify Item 8 in the Omani context. Overall, G_PE was easily endorsed by the Omani students relative to the U.S. students, thereby aligning with prior research that found G-PE explained a higher variance among collectivistic cultures compared with individualistic cultures (Datu et al., Citation2016).
Lastly, the G_CI findings demonstrated only uniform DIF (i.e., in the threshold estimates) between the Omani and U.S. samples, particularly with Items 1 and 2. The G_PE results showed non-uniform DIF (i.e., in the discrimination parameters of Items 5 and 8) and uniform DIF (i.e., in the threshold estimates of Items 6 and 8) between the two samples. The finding of a prior study that examined a longer version of the grit scale (i.e., 12 items) flagged one item (i.e., I have overcome setbacks to conquer an important challenge) because it had a uniform DIF between first-generation college students and non-first-generation students (Midkiff et al., Citation2016).
6. Implications and limitations
The current study resulted in empirical findings. It filled the gap in the literature by analyzing the Grit-S scale’s psychometric properties using IRT among university students across two cultures (i.e., individualistic and collectivist communities). The results of this study provided a precise diagnosis of the items’ discrimination parameters, response categories thresholds, and DIF by nationality. This diagnosis highlights the need to refine the G-PE dimension of the Grit-S scale for use in the higher education context. No refinements were needed for the G_CI dimension. The G_PE dimension had an improper diagnosis, which occurred with Item 8 (i.e., I am diligent), as indicated by four alarming indicators: (1) Unacceptable discrimination parameters in the two samples, (2) Questionable IIT, (3) The uniform DIF, and (4) The non-uniform DIF. Given these deficiencies, further modification and refinement, especially in the Omani context are needed.
This study, however, also has several methodological caveats. First, the study examined whether the measurement properties of the Grit-S hold across nationality only by obtaining DIF estimates, which simply gauge whether the scale measures its dimensions in the same way across different cultures. In addition, the study sample consisted of traditional college students from two public universities in two countries (i.e., Oman and the U.S.). Therefore, the following recommendations are offered: (1) Modify Item 8 in the G_PE dimension and reexamine the scale’s psychometric properties to make the scale more robust; (2) Examine DIF across other demographic groups (e.g., age, gender, and ethnicity); and (3) Collect other samples that include public and private universities and different age groups.
In conclusion, the perseverance of effort dimension of the Grit-S scale needs to be modified and refined, especially in the Omani context. One item in particular (Item 8) does not function well in the G-PE subscale both overall and when disaggregated by group (Omani and U.S.), implying making a certain modification. That step should be followed by a re-examination of the entire scale in its modified form. In all other respects, the Grit-S scale is a valid assessment tool for measuring student persistence and interest in individualistic and collectivistic cultures.
Ethics approval
This study was approved by Institutional Review Board (no. IRB number: 16-748).
Disclosure statement
No potential conflict of interest was reported by the author(s).
Additional information
Funding
References
- Akin, A., Abaci, R., Arici, N., Uysal, R., & Uysal, C. (2011). Revised grit scale: The validity and reliability study. Paper presented at the National Symposium, September 8-10, Burdur, Turkey.
- Alhadabi, A., Aldhafri, S., Alkharusi, H., Al-Harthy, I., AlBarashdi, H., & Alrajhi, M. (2019). Psychometric assessment and cross-cultural adaptation of the Grit-S scale among Omani and American universities’ students. European Journal of Educational Research, 8(4), 1175–21. https://doi.org/10.12973/eu-jer.8.4.1175
- Alhadabi, A., & Karpinski, A. (2020). Grit, self-efficacy, achievement orientation goals, and academic performance in university students. International Journal of Adolescence and Youth, 25(1), 519–535. https://doi.org/10.1080/02673843.2019.1679202
- Arouty, D. (2015). Does character matter? The role of grit and resilience in predicting academic success ( Doctoral dissertation). Available from ProQuest Dissertations and Theses database (UMI No. 3734780).
- Baker, F. (2001). The basics of item response theory (2nd) ed.). Eric Clearing House on Assessment and Evaluation.
- Bond, T., & Fox, C. (2015). Applying the Rasch model: Fundamental measurement in the human sciences (3rd) ed.). Routledge.
- Cai, L., Thissen, D., & du Toit, S. (2011). IRTPRO user’s guide. Scientific Software International.
- Cai, L., Thissen, D., & du Toit, S. (2017). IRTPRO 4.2 for Windows [Computer software]. Skokie, IL: Scientific Software International, Inc.
- Canivez, G. L. (2016). Bifactor modeling in construct validation of multifactored tests: Implications for understanding multidimensional constructs and test interpretation. In K. Schweizer & C. DiStefano (Eds.), Principles and methods of test construction: Standards and recent advancements. (pp. 247–271) Hogrefe Publishers.
- Chen, W., & Thissen, D. (1997). Local dependence indexes for item pairs using item response theory. Journal Of Educational And Behavioral Statistics, 22(3), 265–289. https://doi.org/10.3102/10769986022003265
- Chiesi, F., Lau, C., Marunic, G., Sanchez-Ruiz, M., Plouffe, R., Topa, G., Yan, G., & Saklofske, D. (2020). Emotional intelligence in young women from five cultures: A TEIQue-SF invariance study using the omnicultural composite approach inside the IRT framework. Personality and Individual Differences, 164(1), 1–6. https://doi.org/10.1016/j.paid.2020.110128
- Credé, M., Tynan, M. C., & Harms, P. D. (2017). Much ado about grit: A meta-analytic synthesis of the grit literature. Journal of Personality and Social Psychology, 113(3), 492–511. https://doi.org/10.1037/pspp0000102
- Crocker, L., & Algina, J. (2008). Introduction to classical & modern test theory (2nd) ed.). Cengage Learning.
- Datu, J., Valdez, J., & King, R. (2016). Perseverance counts but consistency does not! Validating the short grit scale in a collectivist setting. Current Psychology, 35(1), 121–130. https://doi.org/10.1007/s12144-015-9374-2
- De Ayala, R. J. (2009). The theory and practice of item response theory. The Guilford Press.
- Duckworth, A., Peterson, C., Matthews, M., & Kelly, D. (2007). Grit: Perseverance and passion for long-term goals. Journal of Personality and Social Psychology, 92(6), 1087–1101. https://doi.org/10.1037/0022-3514.92.6.1087
- Duckworth, A., & Quinn, P. (2009). Development and validation of the short grit scale (Grit-S). Journal of Personality Assessment, 91(2), 166–174. https://doi.org/10.1080/00223890802634290
- Dweck, C. (2008). Mindset: The new psychology of success. Random House.
- Eskreis-Winkler, L., Shulman, E., Beal, S., & Duckworth, A. (2014). The grit effect: Predicting retention in the military, the workplace, school and marriage. Frontiers in Personality Science and Individual Differences, 5(36), 1–12. https://doi.org/10.3389/fpsyg.2014.00036
- Fillmore, E. (2015). Grit and beliefs about intelligence: The relationship and role these factors play in the self-regulatory process involved in medical students learning across anatomy ( Doctoral dissertation). Available from ProQuest Dissertations and Theses database (UMI No. 3703778).
- Fleckenstein, J., Schmidt, F., & Moller, J. (2014). Who’s got grit? Perseverance and consistency of interest in preservice teacher: A German adaptation of the 12-item grit scale. Psychologie in Erziehung Und Unterricht, 61(4), 281–286. https://doi.org/10.2378/peu2014.art22d
- Gay, L., Mills, G., & Airasian, P. (2012). Educational research: Competencies for analysis and application (10th) ed.). Pearson Education, Inc.
- Gonzalez, O., Canning, J., Smyth, H., & MacKinnon, D. (2020). A psychometric evaluation of the short grit scale: A closer look at its factor structure and scale functioning. European Journal of Psychological Assessment, 36(4), 646–657. https://doi.org/10.1027/1015-5759/a000535
- Guerrero, L., Chung, P., Dosanjh, K., Wong, M., & Wong, M. D. (2016). Grit: A potential protective factor against substance use and other risk behaviors among Latino adolescents and self-control as predictors of first-year student success. Academic Pediatrics, 16(3), 275–281. https://doi.org/10.1016/j.acap.2015.12.016
- Han, X. (May, 2013). Item response models used within WinGen. https://www.umass.edu/remp/software/simcata/wingen/modelsF.html
- Hofstede, G. (2001). Culture’s consequences: Comparing values, behaviors, institutions and organizations across nations. Sage.
- Howard, J., Nicholson, B., & Chesnut, S. (2019). Relationships between positive parenting, overparenting, grit, and academic success. Journal of College Student Development, 60(2), 189–202. https://doi.org/10.1353/csd.2019.0018
- Immekus, J., Snyder, K., & Ralston, P. (2019). Multidimensional item response theory for factor structure assessment in educational psychology research. Frontiers in Education, 4(45), 1–15. https://doi.org/10.3389/feduc.2019.00045
- Jabrayilov, R., Emons, W., & Sijtsma, K. (2016). Comparison of classical test theory and item response theory in individual change assessment. Applied Psychological Measurement, 40(8), 559–572. https://doi.org/10.1177/0146621616664046
- Kwon, H. (2021). Are gritty people happier than others?: Evidence from the United States and South Korea. Journal of Happiness Studies, 22(7), 2937–2959. https://doi.org/10.1007/s10902-020-00343-4
- Lan, X. (2020). Grit and peer relationships in early adolescence: A person-centered approach. Journal of Social and Personal Relationships, 37(7), 2250–2269. https://doi.org/10.1177/0265407520921557
- Li, J., Fang, M., Wang, W., Sun, G., & Cheng, Z. (2018). The influence of grit on life satisfaction: Self-esteem as a mediator. Psychologica Belgica, 58(1), 51–66. https://doi.org/10.5334/pb.400
- Linacre, J. (2002). Understanding Rasch measurement: Optimizing rating scale category effectiveness. Journal of Applied Measurement, 3(1), 85–106.
- Midkiff, B., Demetriou, C., Panter, A., & Langer, M. (2016). Measuring grit among first-generation college students: A psychometric analysis. Springer Proceedings in Mathematics and Statistics, 196, 407–420. https://doi.org/10.1007/978-3-319-56294-0_35
- Morell, M., Yang, J., Gladstone, J., Faust, L., Ponnock, A., Lim, H., & Wigfield, A. (2020). Grit: The long and short of it. Journal of Educational Psychology. https://doi.org/10.1037/edu0000594
- Muenks, K., Wigfield, A., Yang, J., & O’Neal, C. (2017). How true is grit? Assessing its relations to high school and college students’ personality characteristics, self-regulation, engagement, and achievement. Journal of Educational Psychology, 109(5), 599–620. https://doi.org/10.1037/edu0000153
- Nishikawa, K., Okugami, S., & Amemiya, T. (2015). Development of the Japanese short grit scale (Grit-S). The Japanese Journal of Personality Assessment, 24(2), 167–169. https://doi.org/10.2132/personality.24.167
- Orlando, M., & Thissen, D. (2003). Further investigation of the performance of S - X2: An item fit index for use with dichotomous item response theory models. Applied Psychological Measurement, 27(4), 289–298. https://doi.org/10.1177/0146621603027004004
- Paek, I., & Cai, L. (2014). A Comparison of item parameter standard error estimation procedures for unidimensional and multidimensional item response theory modeling. Educational and Psychological Measurement, 74(1), 58–76. https://doi.org/10.1177/0013164413500277
- Ponnock, A., Muenks, K., Morell, M., Seung Yang, J., Gladstone, J. R., & Wigfield, A. (2020). Grit and conscientiousness: Another jangle fallacy. Journal of Research in Personality, 89, 1–5. https://doi.org/10.1016/j.jrp.2020.104021
- Reckase, M. (2009). Multidimensional Item Response Theory. Springer.
- Reise, S. (2012). The rediscovery of bifactor measurement models. Multivariate Behavioral Research, 47(5), 667–696. https://doi.org/10.1080/00273171.2012.715555
- Reise, S., & Revicki, D. (2015). Handbook of item response theory modeling: Applications to typical performance assessment. Routledge.
- Ryan, R. M., & Deci, E. L. (2017). Self‐determination theory: Basic psychological needs in motivation, development, and wellness. Guilford Publications.
- Samejima, F. (2010). The general graded response model. In M. L. Nering & R. Ostini (Eds.), Handbook of polytomous item response theory models (pp. 77–107). Routledge/Taylor & Francis Group.
- Stichter, M. (2020). Learning from failure: Shame and emotion regulation in virtue as skill. Ethical Theory & Moral Practice, 23(2), 341–354. https://doi.org/10.1007/s10677-020-10079-y
- Ting-Toomey, S., & Chung, L. (2012). Understanding intercultural communication. Oxford University Press.
- Toland, M. (2014). Practical guide to conducting an Item Response Theory analysis. Journal of Early Adolescence, 34(1), 120–151. https://doi.org/10.1177/0272431613511332
- Toland, M., Sulis, I., Giambona, F., Porcu, M., & Campbell, J. (2017). Introduction to bifactor polytomous item response theory analysis. Journal of School Psychology, 60, 41–63. https://doi.org/10.1016/j.jsp.2016.11.001
- Ullén, F., Harmat, L., Theorell, T., & Madison, G. (2016). Flow and individual differences—A phenotypic analysis of data from more than 10,000 twin individuals. In L. Harmat, F. Ø. Andersen, F. Ullén, J. Wright, & G. Sadlo (Eds.), Flow experience: Empirical research and applications (pp. 267–288). Springer International Publishing AG.
- Werner, K., & Milyavskaya, M. (2018). Motivation and self‐regulation: The role of want‐to motivation in the processes underlying self‐regulation and self‐control. Social and Personality Psychology Compass, 13(1), 1–14. https://doi.org/10.31234/osf.io/yq2j7
- Whipple, S., & Dimitrova, G. (2020). Grit, fit, gender, and academic achievement among first‐year college students. Psychology in the Schools, 58(2), 332–350. https://doi.org/10.1002/pits.22449
- Woods, C. (2009). Empirical selection of anchors for tests of differential item functioning. Applied Psychological Measurement, 33(1), 42–57. https://doi.org/10.1177/0146621607314044
- Zanon, C., Hutz, C., Yoo, H., & Hambleton, R. (2016). An application of item response theory to psychological test development. Psicologia: Reflexão e Crítica, 29(1), 1–10. https://doi.org/10.1186/s41155-016-0040-x
- Zhang, J., Liu, L., & Wang, W. (2021). The moderating role of grit in the relationship between perfectionism and depression among Chinese college students. Frontiers in Psychology, 12, 729089. https://doi.org/10.3389/fpsyg.2021.729089