
 ?Mathematical formulae have been encoded as MathML and are displayed in this HTML version using MathJax in order to improve their display. Uncheck the box to turn MathJax off. This feature requires Javascript. Click on a formula to zoom.
Abstract
This study explores the priority ranking and importance of indicators for effective inclusive education (IEIE) based on the perspectives of school stakeholders regarding the inclusion of children with locomotor disabilities (CwLDs) versus those with physical disabilities (CwPDs) in mainstream primary schools in Delhi. A paper-based survey collected ratings using a Likert scale. The data underwent reliability testing with Cronbach’s alpha coefficient, indicating good reliability. Then, analyzed using three Multi-Criteria Decision Making (MCDM) methods (TOPSIS, GRA, and RIDIT) to assess potential variations in indicator rankings. Further, Spearman’s rank correlation coefficients demonstrated a positive relationship within each inclusion case of CwLDs and CwPDs, but a contrasting relationship when ranking compared against each other (i.e., CwLDs versus CwPDs) among all three methods. Results highlight stakeholders’ emphasis on qualitative aspects over financial and administrative support, with certain indicators (e.g. student-teacher ratio, trained/untrained educators, awareness about UDL) deemed more significant for CwPDs due to their greater needs. The findings advocate for enhancing inclusive education facilities and raising awareness among primary school stakeholders to foster greater inclusion of children with disabilities. This study contributes valuable insights into the complex dynamics of inclusive education prioritization and underscores the importance of addressing diverse needs of inclusive learning environments.
Impact Statement
This study assesses the importance of various indicators of inclusive education in primary schools, focusing on the inclusion of children with disabilities (CwLDs and CwPDs) from the perspectives of all school stakeholders (teachers, principals, special educators, staff, parents, and students) in Delhi. By prioritizing these indicators, the study aims to help government officials and school administrators make informed decisions to enhance accessibility and inclusion in schools. This research compares the priority rankings of inclusive education indicators for children with locomotor disabilities versus physical disabilities, providing valuable insights for policymaking, strategic planning, and budgetary allocations to foster inclusive schools across India.
Reviewing Editor:
Introduction
India, as the world’s largest democracy, grapples with numerous challenges in providing education to over 200 million children aged 6 to 13 (Social & Rural Research Institute, Citation2014). Dropout rates, as per the Citation2018 Ministry of Human Resource and Development report, are 4.13% in primary, 4.03% in upper primary, and a significant 17.06% in secondary education. Shockingly, just 9% of CwDs complete secondary school (Sarkar, Citation2020). While policies like Sarva Shiksha Abhiyan- (SSA), (Sarva Citation2001), Right of Children to Free and Compulsory Education (RTE) Act Citation2009, The Rights of Persons with Disabilities Act (RPWD) Citation2016, and National Education Plan (NEP) 2020 aim to promote inclusive education, they fall short of complete inclusivity, often discriminating against those with disabilities. Poverty, accessibility, and the availability of inclusive schools are major causes of school dropout (Mathew, Citation2017). Inclusive education is vital for integrating people with disabilities into society, particularly at the primary level. As per the Census of India, Citation2011, particularly in Delhi, 32.2% of CwDs and youth aged 5–19 never attended any educational institution. The rates are lower for visual and hearing impairment (16.7% and 17.0% respectively), physical disabilities (25.4%), similar for speech impairment (30.5%), and higher for intellectual impairment (51.2%), and mental illness (56.2%).
In 2018–19, the number of students in MCD schools was 758,000. This figure dropped to 744,000 in 2019–20 and further to 734,000 in 2020–21, causing concern about declining enrollment in primary schools. However, by 2021–22, enrollment increased significantly to 854,000 students, and further to 864,000 in 2022–23, marking a rise of over 17% to 875,000 students in nursery to grade V. Despite this growth, challenges remain as the teacher-student ratio has also increased and requires attention. As of October 2023, the student count was 780,000, with officials noting that around 80,000 students were removed from the list after being identified as dormant for a long period (Chettri & Ghosh, Citation2022; Sharma, Citation2024). In numerous schools, the existing infrastructure is insufficient, leading to overcrowded classrooms and cleanliness concerns. Renovation, CCTVs, computer amenities, and security personnel are needed. Also, the school count decreased to 1535 from 1660 in 2018, with 960 schools having nursery classes. In primary schools, there are 939 teachers for nursery and KG, consisting of 769 regular and 170 contractual teachers. For classes first to fifth, there are 17,374 teachers, consisting of 14,994 regular and 2380 contractual teachers. The total number of permanent principals is 1478, while there are 57 on contractual terms (Chettri & Ghosh, Citation2022).
The effectiveness of inclusive education for children with disabilities (CwDs) depends not only on factors like school size, location, and facilities but also on indicators of effective inclusive education (IEIE) in the school environment. Various researchers have highlighted the importance of IEIE in integrating CwDs into mainstream schools. These indicators have been the subject of studies such as ‘measuring concerns about integrating education in India’ (Sharma & Desai, Citation2002), ‘measuring indicators of inclusive education’ (Loreman et al.,Citation2014), ‘the concerns about inclusive education scale’ (Lozano et al., Citation2022), ‘evaluating inclusive educational practices for students with severe disabilities (Cushing et al., Citation2009), ‘development of a set of indicators-for inclusive education in Europe’ (Kyriazopoulou & Weber, Citation2009), enabling inclusive education in Hong Kong (Forlin & Rose, Citation2010), ‘a process for developing and validating disability-inclusive indicators’ (Sharma et al., Citation2018), ‘school and classroom indicators of inclusive education’ (Lancaster, Citation2014), academic teaching and learning are key criteria for inclusive education (Mutisya, Citation2011), ‘effects of background variables of early childhood teachers on their concerns about inclusion’ (Park et al., Citation2018). Crucial elements for inclusive schools include adequate funding, comprehensive teacher training, public awareness, and a positive attitude (Aziz, Citation2018). Belappurkar et al. (Citation2013) stress understanding of laws and policies about CwD inclusion, harmonized guidelines 2021 (universal accessibility standards for India) highlighted the importance of accessible built environment. Previous researches mainly focused on the perspective and concerns of teachers’ (Sharma & Desai, Citation2002, Lozano et al., Citation2022), and neglecting the aspects related to building accessibility. This study aims to bridge this gap by assessing the importance of various indicators of inclusive education in primary schools, particularly concerning the inclusion of children with disabilities (CwLDs and CwPDs), while considering perspectives from all school stakeholders (including; teachers, principals, special educators, staff, parents, and students) of Delhi’s primary schools. In countries like India, where financial and resource constraints are prevalent (Aziz, Citation2018; Mathew, Citation2017; Sanjeev & Kumar, Citation2007), prioritizing essential inclusive education resources becomes imperative for effectively narrowing the gap. The prioritized list of domains and indicators would aid government officials and school administrators in making more informed decisions and implementing more impactful measures to enhance accessibility and inclusion for individuals with disabilities in their schools. These prioritized criteria also hold significance for policymaking, strategic planning, and budgetary allocations aimed at fostering the development and management of inclusive schools across India. Therefore, the study’s objective also includes ranking the set of IEIE based on their perceived importance by all stakeholders in the primary schools of Delhi. Also this study compares the priority ranking of indicators of effective inclusive education (IEIE) on the perspective of inclusion of children with locomotor disabilities (CwLDs) versus the inclusion of children with physical disabilities (CwPDs), in mainstream primary schools of Delhi and its significance based on school stakeholder’s opinion. Here in this study, children with disability is defined as per the Rights of Persons with Disabilities (RPWD) Act, 2016 India, where CwLDs is one case and second case is CwPDs (CwPDs comprises individual with; locomotor disability, Visual impairment, Hearing Impairment, and speech and language disability).
Various studies have utilized statistical/Multi-Criteria Decision-Making (MCDM) methods to analyze rating data, including ‘application of RIDIT method to Likert scale surveys’ (Pradhan, Citation2009, Şener & Taner, 2020), ‘analytic hierarchy process (AHP)’ (Saaty, Citation2006; Wong & Li, Citation2008), ‘consumer satisfaction index (CSI)’ (Eboli & Mazzulla, Citation2009), ‘impact scoring’ (Transportation Research Board (TRB), Citation1999), ‘RIDIT analysis’ (Bikash & Pravat Citation2010; Biswal et al., Citation2011; Chang & Chang, Citation2005; Panda Citation2012; Wu, Citation2007), ‘technique for order preference by similarity to ideal solution (TOPSIS)’ (Dodangeh et al., Citation2009; Lotfi et al., Citation2011; Salehi & Moghaddam, Citation2008), (Wang et al., Citation2022), ‘Fuzzy TOPSIS Method Applied for Ranking of Teacher’ (Hota et al., Citation2014), PLOS model (Nag & Goswami, Citation2019), ‘priority on qualitative attributes of transfer facility’ (Sadhukhan et al., Citation2015), and ‘gray relation analysis (GRA)’ (Huang & Liao, Citation2003; Kuo et al., Citation2008; Slavek & Jović, Citation2012; Wu, Citation2007). However, the impact of analysis methods on inclusive education ranking hasn’t been fully explored. Additionally, the assessment of importance of IEIE with respect to inclusion of children with disability (CwLDs and CwPDs) through MCDM methods was also not explored yet and is a novel aspect in the research community. So, this study also intends to assess stakeholder rating data using three MCDM methods [Technique for Order Preference by Similarity to Ideal Solution (TOPSIS), Relative to an Identified Distribution Integral Transformation (RIDIT), and Grey Relational Analysis (GRA)] to compare derived rankings of IEIE from these techniques on opinion on inclusion of CwLDs versus the inclusion of CwPDs in mainstream primary school.
Methodology
Identifying the variables (i.e. indicators identification)
Researchers worldwide have emphasized the significance of various IEIE. These indicators comes under following domains: ‘Academic Teaching and Learning’ [including: class- size, teaching strategies, and curriculum (Aziz, Citation2018; Mutisya, Citation2011; Scruggs & Mastropieri, Citation1996)], ‘Availability of Appropriate Support’ (from school & Government authorities) [including; administrative support, disability scenario among students (Gupta, Citation2016), financial support (Aziz, Citation2018), policies, student-teacher ratio (Belappurkar et al., Citation2013)], ‘Availability of Appropriate Facilities’ (services and resources) [including; availability of therapeutic care center, paraprofessional staff (Mutisya, Citation2011), resources to implement accessible features, Special training (UN CRPD, Citation2006) and vocational training (Lozano et al., Citation2022)], ‘Teacher’s (Education and Training)’ [including; their educational qualification, teaching experience, Trained/Untrained with respect to children with special needs (CWSN), Proficiency in operating special devices & equipment, and awareness about universal design of learning (Bhatnagar & Das, Citation2013; Scruggs & Mastropieri, Citation1996)], ‘Teachers Attitude’ [including; teacher’s attitude (negative/positive) and awareness & sensitization w.r.t. disability (Forlin & Chambers, Citation2011; Hemmings & Woodcock, Citation2011; Mutisya, Citation2011)], ‘Socio-Cultural aspects’ [including; parents/community involvement (Randiki, Citation2002) and acceptability & mutual respect b/w students with or without disability and teachers (Mutisya, Citation2011)], and aspects related to ‘Infrastructure & Accessible Built Environment’ [including; accessibility to site entry and school premises, accessibility to vertical and horizontal movement, accessibility to wash and other facilities, accessibility to exit way-finding and communication, accessibility to academic spaces, accessibility to extra-curricular activities and accessibility to digital infrastructure (Belappurkar et al., Citation2013; Ministry of Housing and Urban Affairs [MoHUA], Citation2021; Rights of Persons with Disabilities Act [RPwD] Citation2016; UNESCO, Citation2004 and Mutisya, Citation2011)]. In the early interactions with school stakeholders in Delhi, it was evident that these indicators were relevant for the successful inclusion of both CwLDs and CwPDs in mainstream regular primary schools. As a result, they were included in the list of indicators for this study. Furthermore, additional indicators related to inclusive education were identified from the literature and discussed with experts through an expert opinion survey. After conducting an initial pilot survey, the list of IEIE was adjusted by incorporating expert opinions and utilizing Fuzzy Delphi Analysis. The final survey indicators are presented in . Emphasizing the significance of ensuring access to the built environment and infrastructure is vital for establishing an inclusive educational environment without barriers in Indian schools.
Table 1. Indicators of effective inclusive education (IEIE) for an inclusive school.
Questionnaire Development process
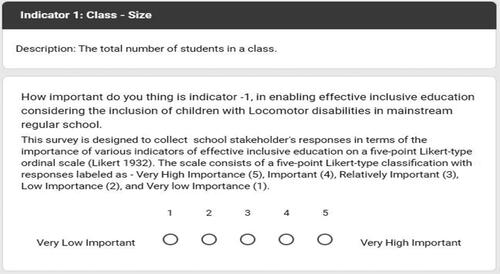
To identify the significance of each indicator of effective inclusive education (IEIE) selected from Fuzzy Delphi analysis and literature studies (see ) with respect to the inclusion of children with disabilities (CwLDs and CwPDs) in the mainstream schools, a paper-based survey questionnaire was created to gather input from the key stakeholders of primary school in Delhi. The questionnaire was designed to collect their responses in terms of the importance of various IEIE (total 33) on a five-point Likert-type ordinal scale (Likert, Citation1932) ranging from Very High Importance (5) to Very Low Importance (1). An excerpt of the survey questionnaire is shown in .
Figure 1. Excerpt of the survey questionnaire.
Data collection and database Development
In March-May 2022, face-to-face interviews and paper-based survey were conducted with stakeholders from 51 primary schools in Delhi to identify a suitable model for inclusive education considering the perspective of inclusion of both CwLDs and CwPDs simultaneously in mainstream regular schools. The study focuses on Tier 1 cities and above in India, with Delhi serving as the selected case study area (Tier 1 cities within India represent crucial urban hubs that propel both economic and social progress, each sustaining a population exceeding one lakh. These urban centers, such as Delhi, Mumbai, and Bangalore, exhibit strong infrastructure, elevated standards of living, and considerable prospects for business endeavors). Data was gathered from primary schools of Delhi, which has 12 zones, and the “central” zone was chosen randomly through a lottery system so that an unbiased selection of zones could be made. This study is purely academic, conducted in pursuit of a Ph.D. degree. The study’s population comprises various school’s stakeholders (including all; teachers, principals, special educators, staff, and students with or without disabilities) from nursery to fifth grade in the selected primary schools. The participants were thoroughly briefed on the survey’s objectives. Furthermore, participants were explicitly informed during the survey process that the completion of the questionnaire would signify their informed consent. This survey involves a concise structured questionnaire. They are asked to rate the importance of specific indicator on a 1-5 Likert scale, with 1 indicating very low importance and 5 signifying very high importance considering the inclusion of both the categories of children with disability (CwLDs and CwPDs) simultaneously. Additionally, to comprehend the priority based comparison of IEIE between inclusion of CwLDs and CwPDs in regular primary school, on the basis of school stakeholders’ perspectives and also to assess the school infrastructure’s accessibility (with respect to children with disabilities) using photo documentation and measurements. This study, deals with a finite population, and the population size is known (N = 19848), also, this formula is suitable for survey research therefore, the Yamane’s (Citation1967) formula is employed to determine the sample size. Formula:
where, n = Sample size, N = Population Size, and e = Margin of error
In Delhi’s primary Schools, there are 939 teachers for nursery and KG, with 769 being regular and 170 contractual teachers. For classes first to fifth, there are 17,374 teachers, consisting of 14,994 regular and 2380 contractual teachers. The total permanent principals number 1478, while there are 57 on contractual terms (Chettri & Ghosh, Citation2022). Here, Total no of Teachers & Principals (i.e. Population Size-N):
So,
A sample size of 393 school stakeholders is statistically acceptable given the total number of different stakeholders currently working in primary schools in Delhi. Here, out of 492 individuals targeted in the survey across 51 primary schools (including 421 regular teachers, 20 special educators, and 51 principals), 481 participants (97.7%) actively took part in the survey. Data from participants were digitized and coded. Most respondents rated all-IEIE, but some only rated a few. Some responses were incomplete, so during data processing, some observations were removed, resulting in 481 complete responses in the final database. (Chettri & Ghosh, Citation2022).
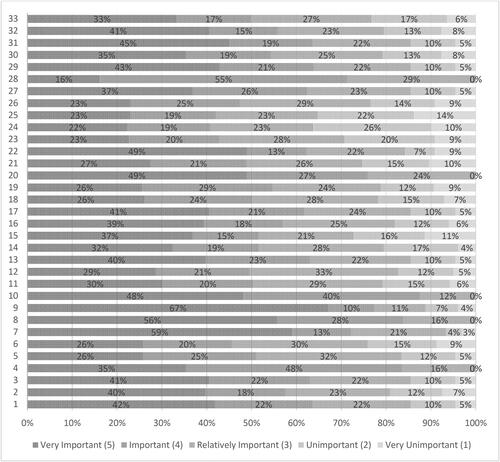
and clearly shows varying participant ratings on the importance of IEIE, generally ranging from 1 to 5 (very unimportant to very important) for both the cases respectively. Notably, in case of considering the inclusion of CwLDs, the indicators 8, 9,10, 18, and 19 (Enrollment of CWSN, Differently-abled status, Type of disability, Severity of disability, Teacher’s Educational Qualification, and Teaching Experience) received ratings from 3 to 5 (i.e. relatively important to very important), with none of the respondents rating them as very unimportant (1) or unimportant (2). But for considering the inclusion of CwPDs, the indicators 4, 8, 10, 20, and 28 (Student-Teachers Ratio, Differently-abled status, Severity of disability, Trained/Untrained w.r.t. CWSN, and Accessibility to vertical and horizontal movement) received ratings from 3 to 5 (i.e. relatively important to very important), with none of the respondents rated them as very unimportant (1) or unimportant (2).
Figure 2. Summarizes the responses from school stakeholders regarding the importance of various IEIE in Primary Schools with respect to the inclusion of CwLDs.
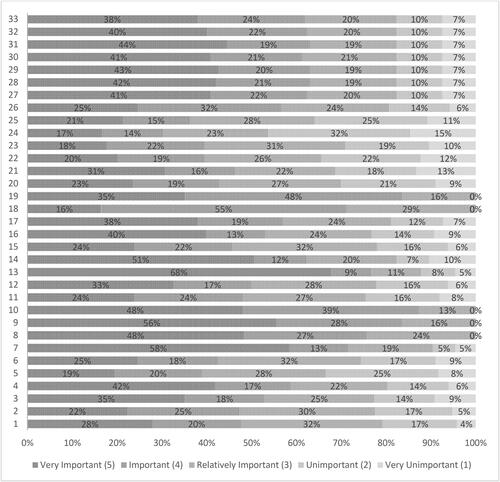
Figure 3. Summarizes the responses from school stakeholders regarding the importance of various IEIE in Primary Schools with respect to the inclusion of CwPDs.Note: here for both cases (CwLDs and CwPDs) in , legends; 1- Class-Size, 2- Teaching Strategies, 3- curriculum, 4- Student-Teachers Ratio, 5- Administrative support, 6- Participation of CWSN in co-curricular activities, 7- Enrollment of CWSN, 8- Are you differently-abled, 9- Type of disability- you belong, 10- Severity of disability, 11- financial support, 12- Policies, 13- Availability of therapeutic care center, 14- Availability of paraprofessional staff, 15- Availability of resources, 16- Special training for regular teachers & staff, 17- Vocational training courses, 18- Teacher’s educational qualification, 19- Teaching experience, 20- Trained/Untrained w.r.t. CWSN, 21- Proficient or not w.r.t. operating special devices, 22- Awareness about UDL, 23- Teacher’s Attitude, 24- Awareness & sensitization w.r.t. disability, 25- Parents/Community involvement, 26- Acceptability & mutual respect, 27- Accessibility to site entry and school premises, 28- Accessibility to vertical and horizontal movement, 29- Accessibility to wash and other facilities, 30- Accessibility to exit, way-finding and communication, 31- Accessibility to academic spaces, 32- Accessibility to extra-curricular activities, 33- Accessibility to digital infrastructure.
Assessment of response reliability of the data
To assess response reliability, a statistical test was conducted using Cronbach’s alpha coefficient on the IEIE importance with respect to the data collected for both cases of inclusion (CwLDs and CwPDs). Cronbach’s alpha, denoted by the Greek letter α, examines the internal consistency or reliability of summated rating scales (Cronbach, Citation1951). It is the most widely used estimate for item consistency within a scale (Cronbach, Citation1951; Cronbach & Shavelson, Citation2004), measuring how responses to survey questions correlate. A Cronbach’s alpha coefficient of 0.905 (in case of CwLDs, falling within the excellent category (α ≥ 0.90), see ) and 0.895 (in case of CwPDs, falling within the excellent category (α ≥ 0.80), see ) surpassing the 0.70 cut-off, it ensures the reliability and validity of the survey data and suggests that the questionnaire effectively measures these indicators, revealing significant differences in ratings from school stakeholders for both the cases.
Table 2. Cronbach’s Alpha Coefficient Test (to assess response reliability of data in case of CwLDs inclusion perspective).
Table 3. Cronbach’s Alpha Coefficient Test (to assess response reliability of data in case of CwPDs inclusion perspective).
Data analysis
As the primary objective of this study is to comprehend the priority based comparison of IEIE between inclusion of CwLDs and CwPDs in regular primary school, on the basis of school stakeholders’ perspectives. So it is crucial to apply methods suitable for managing comprehensive rating data. While a basic user ranking based on mean score is common for user perception, it’s unsuitable for Likert-type data due to mean limitations as a measure of central tendency. Therefore, the study recommends employing Multi-Criteria Decision-Making (MCDM) techniques designed to handle such data for a more accurate analysis. Also, Multi-Criteria Decision-Making (MCDM) methods are gaining prominence as effective tools for analyzing complex real-world issues, enabling the evaluation of different options based on diverse criteria to determine the most appropriate choice (Chung & Ng, Citation2016). These approaches encompass tasks such as identifying the most favorable alternative, ranking options to identify key factors, evaluating deviations from ideal solutions, establishing connections among choices, and determining the importance of criteria to achieve optimal outcomes. MCDM techniques not only pinpoint optimal solutions but also draw attention to less significant ones, assisting decision-makers in making informed choices. This study aimed to assess potential variations in the rankings of indicators derived from these methods. The reasons for selecting these methods can be explained as follows. First, these are among the most widely used MCDM techniques (Şahin, Citation2021). Second, they belong to different MCDM family groups and follow different procedures. Third, each method is likely to produce a different result. Therefore, it is more reasonable to use multiple techniques and evaluate the results compared to the use of one method. In this context, Ozernoy (Citation1992) claimed that there was no perfect MCDM method to produce intended results for all problems. Ishizaka and Siraj (Citation2018), proposed the use of multiple MCDM methods to improve the accuracy of the results for a specific problem (Haddad & Sanders, Citation2018; Mosadeghi et al., Citation2013; Şahin, Citation2021). To minimize the uncertainties resulting from MCDM methods multiple MCDM methods are included in the proposed methodology. So, data were subsequently assessed through three recognized MCDM methods: TOPSIS, RIDIT, and GRA. A concise introduction to these MCDM methods (TOPSIS, RIDIT, and GRA) employed in this study for rating data analysis is presented, followed by a depiction of data collection, database formation, analysis, and findings using the Delhi case study.
Theoretical background
While the theoretical basis of TOPSIS, RIDIT analysis, and GRA has been documented, a succinct overview of these methods within the scope of this study is provided below.
RIDIT analysis
Bross (Citation1958) initially proposed the RIDIT analysis. The RIDIT analysis is a transformation that shortens relative to an identified distribution plus the productive suffix. RIDIT analysis is distribution-independent, making no assumptions about the population’s distribution (Bross, Citation1958; Fleiss et al., Citation2013). RIDIT proves valuable for statistically analyzing items rated on a three-or-more-point scale (Beder & Heim, Citation1990). In essence, it involves a probability transformation rooted in empirical distributions, used as a reference class (Bross, Citation1958). RIDIT analysis commences by selecting a population as a standard or reference class (Fleiss et al., Citation1979). A RIDIT spans from 0.000 to 1.000, encompassing its limits. In RIDIT analysis, the calculation focuses on the average RIDIT value per class, not the proportion of respondents for each dependent variable response.
The data collected from various stakeholders of selected Delhi primary schools for both perspective (considering the inclusion of CwLDs versus inclusion of CwPDs) were subjected to RIDIT analysis. The results of this analysis are presented in (for data related to the inclusion of CwLDs and for data related to the inclusion of CwPDs). The statistical significance of the RIDIT analysis was assessed based on the Kruskal-Wallis (W) value. The Kruskal-Wallis test yielded a high W value of 1367.84 (in case of CwLDs) and 1031.061 (in case of CwPDs), indicating significant differences in responses regarding the importance of 33 IEIE (which comes under seven domains) among respondents, compared to the critical chi-squared value with 32 degrees of freedom at a 0.05 significance level.
Table 4. Effective Inclusive Education Indicator’s Priority List Using RIDIT Analysis for both the cases of inclusion (CwLDs and CwPDs) in Mainstream Primary School.
GRA analysis
In Likert scale analysis, sample size may impact result reliability and precision. Gray system theory by J. L. Deng (Citation1989) addresses decision-making in uncertainty and with limited data (small sample size). Gray relational analysis (GRA) within gray system theory examines discrete data series, being distribution-free. The GRA process suitable for Likert-scale data analysis (Wu, Citation2007). Wu (Citation2007) outlines a systematic approach for Grey Relational Analysis (GRA), recognized for its efficacy in handling incomplete, poor, and uncertain input data (Kuo et al., Citation2008). Likert-scale datasets often encounter uncertainty due to variations in sample size and unreliability in capturing perception data (Sadhukhan et al., Citation2015). The procedure involves creating reference and comparison data series, computing Δi, and determining global maximum (Δmax) and minimum (Δmin) values. By converting data points into grey relational coefficients, GRA calculates the grey relational grade for each difference data series. A high grade indicates consensus among respondents regarding a specific item. GRA has found successful application in various studies addressing Multiple Criteria Decision Making (MCDM) problems (Chan & Tong, Citation2007; Kung & Wen, Citation2007). The ranking outcomes for IEIE derived from GRA are outlined in .
Table 5. Effective Inclusive Education Indicator’s Priority List Using Grey Relation Analysis (GRA) for both the cases of inclusion (CwLDs and CwPDs) in Mainstream Primary School.
TOPSIS analysis
TOPSIS (technique for order preference by similarity to ideal solution) is a suitable method for multi-attribute decision-making (Hwanget al., Citation1981). TOPSIS selects the best alternative closest to the positive ideal solution and farthest from the negative ideal solution (Ertuğrul & Karakaşoğlu, Citation2009). Typically, the positive ideal solution comprises the best possible values from the criteria, whereas the negative ideal solution encompasses the worst possible values from the criteria (Wang & Elhag, Citation2006). Closeness to these performance extremes is assessed using n-dimensional Euclidean measurement (like the square root of the sum of squared distances along each axis in the attribute space), while attributes are weighted as desired (Olson, Citation2004).
In the TOPSIS analysis, 33 IEIE were considered as options and integrated into the model. Importance levels (ranging from 1 to 5) were used as selection criteria, with equal weighting to indicate equal preference probability. In the TOPSIS analysis, the goal was to maximize levels 3–5 while treating them as positive and minimize levels 1 and 2 by treating them as negative in the positive ideal solution. Conversely, the negative ideal solution aimed to minimize levels 3–5 as negatives and maximize levels 1 and 2 as positives. TOPSIS scores () were computed for both the cases for each IEIE using both positive (
) and negative (
) ideal solutions. These (
) values for both cases and the ranking results for IEIE from TOPSIS for both cases (CwLDs and CwPDs) are presented in .
Table 6. Effective Inclusive Education Indicator’s Priority List using TOPSIS Method for both the cases of inclusion (CwLDs and CwPDs).
Results
RIDIT Analysis
The ranking results for IEIE from RIDIT analysis for both cases (CwLDs and CwPDs) are presented in .
GRA analysis
The ranking results for IEIE from GRA analysis for both cases (CwLDs and CwPDs) are presented in .
TOPSIS analysis
The ranking results for IEIE from GRA analysis for both cases (CwLDs and CwPDs) are presented in .
Indicator’s rank comparison for both the cases of inclusion (CwLDs and CwPDs)
In this study, all three methods (TOPSIS, RIDIT, and GRA) were generally consistently highlighted the greater importance of indicators related to students, and accessibility compared to others for both the cases of inclusion. Also in all three methods, stakeholders had prioritized the indicators (Class Size, Teaching Strategies, Student-Teachers Ratio, Curriculum, Trained/Untrained w.r.t. CWSN, Awareness about Universal Design of Learning) in case of inclusion of CwPDs than the rest of indicators, contrary to the stakeholder opinion on CwLDs inclusion. It’s important to note that while these methods are established in the literature, their unique approaches may make it challenging to directly compare indicator weights or scores. Thus, we compare indicator rankings from TOPSIS, RIDIT, and GRA for both the cases of inclusion (CwLDs & CwPDs) in . Generally, reveals consistent indicators rankings among each case (considering either in case of inclusion of CwLDs or in case of inclusion of CwPDs) across all three methods in terms of importance and priority; but when compared against each other (inclusion of CwLDs versus inclusion of CwPDs), reveals that indicators ranking slightly differ from each other and not consistent.
Table 7. Comparative Ranking of IEIE Using TOPSIS, RIDIT, and GRA for both the cases of inclusion (CwLDs and CwPDs).
To assess the correlation of rankings from various methods, Spearman’s rank order correlation coefficients were computed (Kothari, Citation2004). These coefficients were statistically significant at the 99% confidence level, indicating a positive rank order relationship among all the three methods (considering individual case of CwLDs and CwPDs ranking separately), but when it was compared against each other (i.e. ranking for CwLDs versus ranking for CwPDs), results were not significant and not showing positive rank order relationship (see ).
Table 8. Spearman’s rank order correlation coefficient between RIDIT, GRA and TOPSIS for both cases of inclusion (CwLDs and CwPDs).
Discussion
The results of this study provide valuable insights into the priority ranking of effective inclusive education indicators (IEIE) for the inclusion of children with locomotor disabilities (CwLDs) and children with physical disabilities (CwPDs) in primary schools in Delhi, India. By employing Multi-Criteria Decision Making (MCDM) methods- RIDIT, Gray Relation Analysis (GRA), and Technique for Order Preference by Similarity to Ideal Solution (TOPSIS), this study identified the most significant indicators of effective inclusive education (IEIE) for both the cases and compared their relative importance across these two groups.
RIDIT analysis
According to the RIDIT analysis, in case of inclusion of CwLDs, , shows that certain factors, such as type of disability, severity of disability, availability of therapeutic care center, enrollment of CWSN, disability status, teaching experience, presence of paraprofessional staff, access to academic spaces, access to WASH and other facilities, access to vertical and horizontal movement, and access to entry to school premises, are the most important IEIE based on mean RIDIT score (ρi). In contrast to the inclusion of CwLDs, here in case of inclusion of CwPDs (see ), indicators related to student’s characteristics (i.e. type of disability, severity of disability, enrollment of CWSN, disability status_) are still most important, but indicators (i.e. student-teacher ratio, trained/untrained educators w.r.t. CWSN, awareness about UDL, class size, and curriculum] carries greater significance compared to indicators like [teacher’s experiences, availability of paraprofessional staff, accessibility to vertical and horizontal movement and accessibility to site entry and school premises), which were considered most important in case of inclusion of CwLDs analysis. This may be because of the reason that inclusion of CwPDs in mainstream regular schools consider various type of children with disability as per RPWD ACT Citation2016 (Rights of Persons with Disabilities Act [RPwD] Citation2016) India (i.e. locomotor disability, Visual impairment, Hearing Impairment, and speech and language disability), which required greater attention and care compared to the inclusion of only CwLDs. Similarly, Indicators related to accessible school infrastructure (i.e. accessibility to extra-curricular activities, navigation and communication, digital infrastructure) along with other indicators [like; vocational training availability, special training for teachers, and teaching strategies for CWSN] are considered of medium importance IEIE for both cases (inclusion of CwLDs and CwPDs). Few indicators which come under medium importance IEIE (i.e. teachers’ experience, teachers’ educational qualification, policies w.r.t. CWSN and acceptability and mutual respect between student) are given more importance in case of considering inclusion of CwLDs then the CwPDs. Results from RIDIT Analysis (see ), for both the cases (CwLDs and CwPDs), indicate that indicators, (i.e. inadequate financial support, proficiency in using special devices for CWSN, CWSN participation in co-curricular activities, teacher’s attitude, administrative support, parental/community involvement, and disability awareness), are considered less important IEIE compared to rest indicators. This, indicate the lack of stakeholder’s interest in including (CwLDs and CwPDs) in mainstream schools. Indicators like - awareness about UDL and status of trained/untrained teacher w.r.t. CWSN are given very low importance in case of CwLDs but it is in high priority in case of inclusion of CwPDs; One possible explanation is that CwLDs require less specialized support to be included in mainstream education, unlike CwPDs who often need more specific accommodations for effective inclusion.
Gray Relation analysis (GRA)
In addition to RIDIT, gray relation analysis (GRA) also was used to analyze the rating data. The ranking results for IEIE from GRA for both cases (CwLDs and CwPDs) are presented in . The results from GRA are generally consistent with the results from RIDIT analysis for all IEIE for both the cases of inclusion (CwLDs and CwPDs). Here, just like in RIDIT, student characteristics (i.e. type of disability, severity of disability, enrollment of CWSN, disability status) and accessibility (i.e. Accessibility to Academic Spaces, Accessibility to Wash and Other Facilities) were considered most important than other indicators and indicators (i.e. Parents/Community Involvement, Teacher’s Attitude (Negative/Positive, and Awareness & Sensitization w.r.t. disability) are considered low important indicator for both cases of inclusion. Also, just like RIDIT analysis, in case of inclusion of CwPDs, stakeholders have prioritized the indicators (Class Size, Teaching Strategies, Student-Teachers Ratio, Curriculum, Trained/Untrained w.r.t. CWSN, Awareness about Universal Design of Learning) than the rest of indicators, contrary to the stakeholder opinion on CwLDs inclusion. The rankings of indicators obtained from GRA and RIDIT analyses align with each other.
TOPSIS analysis
In the TOPSIS analysis (see ), Here, just like in RIDIT and GRA, student characteristics (i.e. type of disability, severity of disability, enrollment of CWSN, disability status) was most important for both the cases but indicators related to infrastructural and accessible built environment was considered more important in case of CwLDs than in case of CwPDs. Other indicators (i.e. Teaching strategies, Inadequate financial support, administrative support, Parents/Community Involvement, Teacher’s Attitude (Negative/Positive, and Awareness & Sensitization w.r.t. disability) were considered low important indicator for both cases of inclusion. This finding contradicts the common belief that teaching strategies, financial and administrative support, teacher training, community involvement, and awareness are highly important factors for inclusive education in emerging countries like India. It’s worth mentioning that very few primary schools of Delhi have only one special educator per school to support CWSN, and the enrollment of these students is relatively low in existing schools. This likely indicates a lack of interest among stakeholders (teachers, principals, special educators, etc.) in actively promoting the inclusion of CwLDs and CwPDs in these schools, as these indicators require their direct participation and effort; This could explain why stakeholders do not prioritize these indicators as highly important compared to the previously discussed indicators. The rankings of indicators obtained from TOPSIS analysis slightly differ from GRA and RIDIT analyses (see ).
Comparison and insights
The comparison of rankings between CwLDs and CwPDs inclusion perspectives revealed noteworthy differences in stakeholder priorities. While certain indicators such as type and severity of disability, enrollment of children with special needs (CWSN), and accessibility to academic spaces were consistently significant for both cases, indicators like student-teacher ratio, teacher training, and awareness about Universal Design of Learning (UDL) carried greater importance in the inclusion of CwPDs compared to CwLDs (see ). This disparity may be attributed to the diverse needs and requirements of children with different types of disabilities, as outlined in the RPWD Act Citation2016 (Rights of Persons with Disabilities Act [RPwD] Citation2016) India. Previous research mainly focused on the perspectives and concerns of teachers (Lozano et al., Citation2022; Sharma & Desai, Citation2002), often neglecting aspects related to building accessibility. However, this study aims to bridge this gap by assessing the importance of various inclusive education indicators in primary schools, particularly concerning the inclusion of children with disabilities (CwLDs and CwPDs), while considering perspectives from all school stakeholders, including teachers, principals, special educators, staff, parents, and students of Delhi’s primary schools. Additionally, it highlights the importance of an accessible built environment (see ).
Implications for inclusive education
The findings suggest that while certain foundational elements of inclusive education are universally recognized, the specific needs of different disability groups require differentiated approaches. The higher importance placed on teacher training, class size, and UDL awareness for CwPDs indicates a need for more comprehensive professional development and resource allocation to support these students effectively. For CwLDs, the emphasis on accessibility and therapeutic support points to the need for better physical infrastructure and specialized care within schools.
Stakeholder engagement
A notable finding across all methods was the relatively low importance attributed to financial support, administrative backing, and community involvement. This indicates a possible lack of stakeholder engagement or awareness about the critical role these factors play in fostering an inclusive environment. There is a pressing need to enhance stakeholder awareness and involvement to address these gaps effectively.
Conclusions
This study presents valuable insights on ranking comparison between two cases (i.e. inclusion of CwLDs versus inclusion of CwPDs, in primary schools in Delhi, India.) on the basis of significance of IEIE through RIDIT, GRA and TOPSIS analysis. This study shows that, school stakeholders prioritize qualitative indicators (students, teachers, resources, and accessibility) over financial and administrative support for both the cases of inclusion of CwLDs and CwPDs. Typically, emerging countries like India tend to focus solely on the financial and administrative aspects of inclusive education, often overlooking the qualitative dimension concerning the inclusion of CwPDs. The results support the importance of enhancing accessibility around schools and emphasizing qualitative aspects. The rankings of IEIE obtained from comparing priority ranking of both CwLDs and CwPDs through TOPSIS, RIDIT, and GRA methods are generally consistent and not significantly different in case of their ranking comparison for either of the case of inclusion (i.e. CwLDs or CwPDs), but when comparison of priority ranking done against each other of both cases(i.e. inclusion of CwLDs versus inclusion of CwPDs) through TOPSIS, RIDIT, and GRA methods, the results were generally not consistent and significantly different. As comparison of results shows that, in all three methods, that certain indicators, (such as type of disability, severity of disability, enrollment of CWSN, disability status, access to academic spaces, access to WASH and other facilities, teacher’s attitude (negative/positive), parent’s/community involvement, awareness & sensitization w.r.t. disability) were carries generally similar significance for both cases of inclusion perspective (CwLDs and CwPDs), But indicators (like student-teacher ratio, trained/untrained educators w.r.t. CWSN, awareness about UDL, class size, teaching strategies, curriculum, availability of vocational training courses and facilities in school) were carries greater significance in case of inclusion of CwPDs compared to CwLDs. This may be because of the reason that inclusion of CwPDs in mainstream regular schools consider various type of children with disability (i.e. locomotor disability, visual impairment, hearing impairment, and speech and language disability as per RPWD ACT Citation2016 (Rights of Persons with Disabilities Act [RPwD] Citation2016) India), which required greater attention and care compared to the inclusion of only CwLDs. This also justify the need for enhancing the awareness of school stakeholder towards the need and requirement of both (CwLDs and CwPDs) in case of inclusion in regular school.
Limitation & future research scope
This study underscores the significance of IEIE and suggests the necessity for further research. Specifically, there is a need to develop an assessment tool to evaluate the current status of these indicators in regular schools, with the aim of improving the enrollment of children with disabilities. This research serves as a valuable foundation for choosing IEIE for the inclusion of children with disabilities (CwLDs and CwPDs) in regular schools. The research is limited to primary schools in Delhi, which may not be representative of other regions or educational levels in India. Although the sample size is statistically significant, a broader and more diverse sample from multiple cities and educational levels could provide a more comprehensive understanding. The reliance on self-reported data may introduce biases. Future research could incorporate observational studies and interviews for triangulation. The data collection occurred over a specific period, and educational dynamics may change over time. Longitudinal studies could provide insights into the evolution of inclusive education practices. So by acknowledging and addressing these limitations, future research can build on the findings of this study to enhance the understanding and implementation of inclusive education.
oaed_a_2380143_sm3334.docx
Download MS Word (11.7 KB)Disclosure statement
No potential conflict of interest was reported by the author(s)
Additional information
Notes on contributors

Umesh Kumar
Umesh Kumar is a Research Scholar in the Department of Architecture and Regional Planning at the Indian Institute of Technology Kharagpur in West Bengal, India. He obtained his bachelor’s degree in architecture from the Faculty of Architecture, UPTU, Lucknow, Uttar Pradesh, and his master’s degree in architecture from Kurukshetra University, Haryana. With academic training and work expertise in architecture, he focuses on addressing challenges related to inclusive education. His research interests include inclusive education, universal design, and architecture. Umesh Kumar serves as the corresponding author, and he can be reached at [email protected], [email protected]

Haimanti Banerji
Haimanti Banerji is a Professor in the Architecture and Regional Planning Department at IIT Kharagpur, India. With over 18 years of academic experience, she has contributed significantly to projects like BASIIC and co-authored the “Universal Design India Principles” (UDIP NID, 2011). Her research interests encompass universal design, behavioral architecture, and urban design.
References
- Aziz, E. (2018). A reflection on the status of inclusive classrooms in MCD schools of south Delhi. Researchers’ Guild, 1(1), 4. https://doi.org/10.15503/rg.v1i1.459
- Beder, J. H., & Heim, R. C. (1990). On the use of RIDIT analysis. Psychometrika, 55(4), 603–616. https://doi.org/10.1007/BF02294610
- Belappurkar, A. M., Phatak, S., & Uplane, M. (2013). Comparing inclusive practices in urban and rural schools in Pune. Scholarly Research Journal for Interdisciplinary Studies., Vol. - I, Issue-IV(PP 813–821). https://www.srjis.com/issues_data/4
- Bhatnagar, N., & Das, A. (2013). Nearly two decades after the implementation of persons with disabilities act: Concerns of Indian teachers to implement inclusive education. International Journal of Special Education, 28(2), 104–113. http://files.eric.ed.gov/fulltext/EJ1023312.pdf
- Bikash, R. D., & Pravat, S. K., S. (2010). Factors influencing purchase of NANO the innovative car from India-an empirical study. Asian Journal of Business Management, 2(3), 48–56. https://www.airitilibrary.com/Article/Detail/20418752-201009-201508130014-201508130014-48-56
- Biswal, S. K., Sreekumar., & Panda, A. K. (2011). Analysing the factors influencing store image from customer’s perspective-An empirical study in India. Asian Journal of Business Management, 2(3), 144–154. https://idosi.org/ajbms/2(3)11/6.pdf
- Bross, I. D. J. (1958). How to use RIDIT analysis. Biometrics, 14(1), 18. https://doi.org/10.2307/2527727
- Census of India. (2011). Provisional population totals. Government of India. https://censusindia.gov.in/nada/index.php/home
- Chan, J. W., & Tong, T. K. (2007). Multi-criteria material selections and end-of-life product strategy: Grey relational analysis approach. Materials & Design, 28(5), 1539–1546. https://doi.org/10.1016/j.matdes.2006.02.016
- Chang, H. L., & Chang, H. W. (2005). Comparison between the differences of recreational cyclists in national scenic bikeway and local bike lane. Journal of the Eastern Asia Society for Transportation Studies, 6, 2178–2193. https://doi.org/10.11175/easts.6.2178
- Chettri, S., & Ghosh, S. (2022). Delhi: Enrolment rises, but MCD schools cannot keep facilities up to speed. The Times of India. https://timesofindia.indiatimes.com/city/delhi/enrolment-rises-but-mcd-schools-cannot-keep-facilities-up-to-speed/articleshow/95541356.cms
- Chung, T. M., & Ng, R. T. H. (2016). The application of analytic hierarchy process in daylighting performance assessment. Indoor and Built Environment, 25(1), 50–68. https://doi.org/10.1177/1420326X14525061
- Cronbach, L. J. (1951). Coefficient alpha and the internal structure of tests. Psychometrika, 16(3), 297–334. https://doi.org/10.1007/BF02310555
- Cronbach, L. J., & Shavelson, R. J. (2004). My current thoughts on coefficient alpha and successor procedures. Educational and Psychological Measurement, 64(3), 391–418. https://doi.org/10.1177/0013164404266386
- Cushing, L. S., Carter, E. W., Clark, N., Wallis, T., & Kennedy, C. H. (2009). Evaluating inclusive educational practices for students with severe disabilities using the program quality measurement tool. The Journal of Special Education, 42(4), 195–208. https://doi.org/10.1177/0022466907313352
- Deng, J. L. (1989). Introduction to grey system theory. The Journal of Grey System, 1(1), 1–24. https://uranos.ch/research/references/Julong_1989/10.1.1.678.3477.pdf
- Dodangeh, J., Mojahed, M., & Yusuff, R. B. M. (2009 Best project selection by using of group TOPSIS method [Paper presentation]. International Association of Computer Science and Information Technology- Spring Conference, Singapore, April 17–20. IEEE Computer Society Press, Piscataway, NJ, 50–53. https://doi.org/10.1109/IACSIT-SC.2009.119
- Eboli, L., & Mazzulla, G. (2009). A new customer satisfaction index for evaluating transit service quality. Journal of Public Transportation, 12(3), 21–37. https://doi.org/10.5038/2375-0901.12.3.2
- Ertuğrul, İ., & Karakaşoğlu, N. (2009). Performance evaluation of Turkish cement firms with fuzzy analytic hierarchy process and TOPSIS methods. Expert Systems with Applications, 36(1), 702–715. https://doi.org/10.1016/j.eswa.2007.10.014
- Fleiss, J. L., Chilton, N. W., & Wallenstein, S. (1979). RIDIT analysis in dental clinical studies. Journal of Dental Research, 58(11), 2080–2084. https://doi.org/10.1177/00220345790580110701
- Fleiss, J. L., Levin, B., & Paik, M. C. (2013). Statistical methods for rates and proportions. John Wiley & Sons.
- Forlin, C., & Chambers, D. (2011). Teacher preparation for inclusive education: increasing knowledge but raising concerns. Asia-Pacific Journal of Teacher Education, 39(1), 17–32. https://doi.org/10.1080/1359866X.2010.540850
- Forlin, C., & Rose, R. (2010). Authentic school partnerships for enabling inclusive education in Hong Kong. Journal of Research in Special Educational Needs, 10(1), 13–22. https://doi.org/10.1111/j.1471-3802.2009.01139.x
- Gupta, V. (2016). Educational planning: Dropout of CWSN and SLD children in India. IAFOR Journal of the Social Sciences, 2(2), 61–70. https://doi.org/10.22492/ijss.2.2.05
- Haddad, M., & Sanders, D. (2018). Selection of discrete multiple criteria decision making methods in the presence of risk and uncertainty. Operations Research Perspectives, 5, 357–370. https://doi.org/10.1016/j.orp.2018.10.003
- Hemmings, B., & Woodcock, S. (2011). Preservice Teachers’ views of inclusive education: A content analysis. Australasian Journal of Special Education, 35(2), 103–116. https://doi.org/10.1375/ajse.35.2.103
- Hota, H. S., Sharma, L. K., & Pavani, S. (2014). Fuzzy TOPSIS method applied for ranking of teacher in higher education. In: Mohapatra, D.P., Patnaik, S. (Eds.,) Intelligent Computing, Networking, and Iinformatics: Proceedings of the International Conference on Advanced Computing, Networking, and Informatics, India., June 2013, vol 243. (pp. 1225–1232). Springer India. https://doi.org/10.1007/978-81-322-1665-0_127
- Huang, J. T., & Liao, Y. S. (2003). Optimization of machining parameters of wire-EDM based on grey relational and statistical analyses. International Journal of Production Research, 41(8), 1707–1720. https://doi.org/10.1080/1352816031000074973
- Hwang, C. L., Yoon, K., Hwang, C. L., & Yoon, K. (1981). Methods for multiple attribute decision making. Multiple Attribute Decision Making: Methods and Applications a State-of-the-Art Survey. Lecture Notes in Economics and Mathematical Systems (vol. 186, pp. 58–191). Springer, Berlin, Heidelberg. https://doi.org/10.1007/978-3-642-48318-9_3
- Ishizaka, A., & Siraj, S. (2018). Are multi-criteria decision-making tools useful? An experimental comparative study of three methods. European Journal of Operational Research, 264(2), 462–471. https://doi.org/10.1016/j.ejor.2017.05.041
- Kothari, C. (2004). Research methodology: Methods and techniques. https://ndl.ethernet.edu.et/bitstream/123456789/88770/1/2004%20Kothari_%20Research%20Methodology%20Methods%20and%20Techniques.pdf
- Kuo, Y., Yang, T., & Huang, G. (2008). The use of grey relational analysis in solving multiple attribute decision-making problems. Computers & Industrial Engineering, 55(1), 80–93. https://doi.org/10.1016/j.cie.2007.12.002
- Kung, C. Y., & Wen, K. L. (2007). Applying grey relational analysis and grey decision-making to evaluate the relationship between company attributes and its financial performance-A case study of venture capital enterprises in Taiwan. Decision Support Systems, 43(3), 842–852. https://doi.org/10.1016/j.dss.2006.12.012
- Kyriazopoulou, M., & Weber, H. (2009). Development of a set of indicators-for inclusive education in Europe. Odense: European Agency for Development in Special Needs Education. https://www.european-agency.org/resources/publications/development-set-indicators-inclusive-education-europe
- Lancaster, J. (2014). School and classroom indicators of inclusive education. Measuring Inclusive Education (International Perspectives on Inclusive Education, Vol. 3)., pp. 227–245. Emerald Group Publishing Limited. https://doi.org/10.1108/s1479-363620140000003027
- Likert, R. (1932). A technique for the measurement of attitudes. Archives of Psychology, 22 140, 55. https://psycnet.apa.org/record/1933-01885-001
- Loreman, T., Forlin, C., & Sharma, U. (2014). Measuring indicators of inclusive education: A systematic review of the literature. Measuring Inclusive Education (International Perspectives on Inclusive Education, Vol. 3), pp. 165–187. Emerald Group Publishing Limited. https://doi.org/10.1108/s1479-363620140000003024
- Lotfi, F. H., Fallahnejad, R., & Navidi, N. (2011). Ranking efficient units in DEA by using TOPSIS method. Applied Mathematical Sciences, 5(17), 805–815. https://www.m-hikari.com/ams/ams-2011/ams-17-20-2011/lotfiAMS17-20-2011-1.pdf
- Lozano, C. S., Wüthrich, S., Büchi, J. S., & Sharma, U. (2022). The concerns about inclusive education scale: Dimensionality, factor structure, and development of a short-form version (CIES-SF). International Journal of Educational Research, 111, 101913. https://doi.org/10.1016/j.ijer.2021.101913
- Mathew, J. (2017). A report on reasons-for-school-dropouts-survey. https://mes.ac.in/wp-content/uploads/2017/10/Reasons-for-School-Dropouts-Survey-Report-by-Jomon.pdf
- Ministry of Education [MoE]. (2020). National education policy 2020. Government of India. https://www.education.gov.in/sites/upload_files/mhrd/files/NEP_Final_English_0.pdf
- Ministry of Housing and Urban Affairs [MoHUA]. (2021). Harmonised guidelines & standards for universal accessibility in India. Government of India. https://cpwd.gov.in/Publication/HarmonisedGuidelinesUA2021.pdf
- Ministry of Human Resource Development. (2018). Educational statistics at a glance. Government of India. https://www.education.gov.in/sites/upload_files/mhrd/files/statistics-new/ESAG-2018.pdf
- Mutisya, C. M. S. (2011). Factors influencing inclusion of learners with special needs in regular primary school in Rachuonyo district, Kenya. https://ir-library.ku.ac.ke/handle/123456789/903
- Mosadeghi, R., Warnken, J., Tomlinson, R., & Mirfenderesk, H. (2013). Uncertainty analysis in the application of multi-criteria decision-making methods in Australian strategic environmental decisions. Journal of Environmental Planning and Management, 56(8), 1097–1124. https://doi.org/10.1080/09640568.2012.717886
- Nag, D., & Goswami, A. K. (2019). Identification of measures of effectiveness (MOEs) for developing pedestrian level of service (PLOS). International Review for Spatial Planning and Sustainable Development, 7(4), 56–82. https://doi.org/10.14246/irspsd.7.4_56
- Olson, D. L. (2004). Comparison of weights in TOPSIS models. Mathematical and Computer Modelling, 40(7-8), 721–727. https://doi.org/10.1016/j.mcm.2004.10.003
- Ozernoy, V. M. (1992). Choosing the best multiple criterlv decision-making method. Information Systems and Operational Research, 30(2), 159–171. https://doi.org/10.1080/03155986.1992.11732192
- Panda, R. K., S. (2012). Prioritizing issues in agribusiness using RIDIT analysis: An Indian perspective. World Journal of Agricultural Sciences, 8(1), 80–88. http://www.idosi.org/wjas/wjas8(1)/13.pdf
- Park, M. H., Dimitrov, D. M., & Park, D. Y. (2018). Effects of background variables of early childhood teachers on their concerns about inclusion: The mediation role of confidence in teaching. Journal of Research in Childhood Education, 32(2), 165–180. https://doi.org/10.1080/02568543.2017.1417926
- Pradhan, B. K. (2009). Service quality indicators in education setting: application of RIDIT method to Likert scale surveys (Doctoral dissertation). https://core.ac.uk/download/pdf/53187305.pdf
- Randiki, F. (2002). Historical development of special needs education. KISE.
- Right to Education Act. (2009). No. 35 of 2009. Government of India. https://www.education.gov.in/sites/upload_files/mhrd/files/upload_document/RTE_Section_wise_rationale_rev_0.pdf
- Rights of Persons with Disabilities Act [RPwD]. (2016). No. 49 of 2016. Government of India. https://lddashboard.legislative.gov.in/sites/default/files/A2016-49_1.pdf
- Saaty, T. L. (2006). Rank from comparisons and from ratings in the analytic hierarchy/network processes. European Journal of Operational Research, 168(2), 557–570. https://doi.org/10.1016/j.ejor.2004.04.032
- Sadhukhan, S., Banerjee, U. K., & Maitra, B. (2015). Commuters’ perception towards transfer facility attributes in and around metro stations: experience in Kolkata. Journal of Urban Planning and Development, 141(4), 04014038. https://doi.org/10.1061/(asce)up.1943-5444.0000243
- Şahin, M. (2021). A comprehensive analysis of weighting and multi criteria methods in the context of sustainable energy. International Journal of Environmental Science and Technology: IJEST, 18(6), 1591–1616. https://doi.org/10.1007/s13762-020-02922-7
- Salehi, M., & Moghaddam, R. T. (2008). Project selection by using a fuzzy TOPSIS technique. International Journal of Industrial and Manufacturing Engineering, 2(4), 80–85.
- Sanjeev, K., & Kumar, K. (2007). Inclusive education in India. Electronic Journal for Inclusive Education, 2(2), Art. 7. https://ssrn.com/abstract=3499954
- Sarkar, T. (2020, August 26). Examining disability inclusion in India’s new national education policy. The Education and Development Forum (UKFIET). https://www.ukfiet.org/2020/examining-disability-inclusion-in-indias-new-national-education-policy/
- Sarva, S. A. (2001). Framework for implementation based on the right of children to free and compulsory education act, 2009. Ministry of human resource development, government of India. https://www.education.gov.in/sites/upload_files/mhrd/files/upload_document/SSA-Frame-work.pdf
- Scruggs, T. E., & Mastropieri, M. A. (1996). Teacher perceptions of mainstreaming/inclusion, 1958-1995: A research synthesis. Exceptional Children, 63(1), 59–74. https://doi.org/10.1177/001440299606300106
- Şener, S., & Tunç, T. (2020). A view on teacher training programs in Turkey. Black Sea Journal of Public and Social Science, 3(2), 43–52. https://dergipark.org.tr/en/pub/bssocialscience/issue/52086/658587
- Sharma, U., & Desai, I. (2002). Measuring concerns about integrated education in India. Asia-Pacific Journal on Disability, 5(1), 2–14. https://www.dinf.ne.jp/doc/english/asia/resource/z00ap/vol5no1/measure.html
- Sharma, U., Jitoko, F., Macanawai, S. S., & Forlin, C. (2018). How do we measure implementation of inclusive education in the Pacific Islands? A process for developing and validating disability-inclusive indicators. International Journal of Disability, Development and Education, 65(6), 1–17. https://doi.org/10.1080/1034912X.2018.1430751
- Sharma, V. (2024). MCD issues fresh admission norms to up student count. The Times of India. https://timesofindia.indiatimes.com/city/delhi/mcd-issues-fresh-admission-norms-to-up-student-count/articleshow/109357916.cms
- Slavek, N., & Jović, A. (2012). Application of grey system theory to software projects ranking. Automatika, 53(3), 284–293. https://doi.org/10.7305/automatika.53-3.80
- Social & Rural Research Institute. (2014). National sample survey of estimation of out-of-school children in the age 6-13 in India. Ministry of Education India, https://www.education.gov.in/sites/upload_files/mhrd/files/upload_document/National-Survey-Estimation-School-Children-Draft-Report.pdf
- Transportation Research Board (TRB). (1999). A handbook for measuring customer satisfaction and service quality. TCRP Rep. 47, Washington, DC. https://www.trb.org/publications/tcrp/tcrp_rpt_47-a.pdf
- UNESCO. (2004). Education for all: the quality imperative; EFA global monitoring report, 2005. https://doi.org/10.54676/CLEA4672
- United Nations. (2006). Convention on the rights of persons with disabilities. article 24: Education. https://www.un.org/development/desa/disabilities/convention-on-the-rights-of-persons-with-disabilities/article-24-education.html
- Wang, T.-C., Thu Nguyen, T. T., & Phan, B. N. (2022). Analysing higher education performance by entropy - TOPSIS method: A case study in Viet Nam private universities. Measurement and Control, 55(5-6), 385–410. https://doi.org/10.1177/00202940221089504
- Wang, Y. M., & Elhag, T. (2006). Fuzzy TOPSIS method based on alpha level sets with an application to bridge risk assessment. Expert Systems with Applications, 31(2), 309–319. https://doi.org/10.1016/j.eswa.2005.09.040
- Wong, J. K. W., & Li, H. (2008). Application of the analytic hierarchy process (AHP) in multi-criteria analysis of the selection of intelligent building systems. Building and Environment, 43(1), 108–125. https://doi.org/10.1016/j.buildenv.2006.11.019
- Wu, C. H. (2007). On the application of grey relational analysis and RIDIT analysis to Likert scale surveys. International Mathematical Forum, 2(14), 675–687.https://m-hikari.com/imf-password2007/13-16-2007/chienhowuIMF13-16-2007.pdf https://doi.org/10.12988/imf.2007.07059
- Yamane, T. (1967). Statistics, An introductory analysis., 2nd Ed. Harper and Row. p. 886.