
 ?Mathematical formulae have been encoded as MathML and are displayed in this HTML version using MathJax in order to improve their display. Uncheck the box to turn MathJax off. This feature requires Javascript. Click on a formula to zoom.
Abstract
This study focuses on the challenges posed by climate change in the pursuit of some of the broad aspirations of African Union Agenda 2063. This study assessed the impact of climate change on the movement towards sustainability by rural African societies using a case of rural districts in Zimbabwe. The study sought a rural African perception of climate change, trajectory of major climate indicators, common adaptation strategies and an assessment of climate change implications on sustainability in Africa and Agenda 2063. This study employed a combination of qualitative and quantitative research approaches. Results showed the absence and limited access to the other capital assets obscuring visibility of Agenda 2063 Aspiration 1 in the horizon.
PUBLIC INTEREST STATEMENT
This paper considers vulnerability of predominantly rural communities to climate change in Zimbabwe. The study was conducted in the mostly rural districts of BuLilima, Gokwe south and Lupane. The paper shows how sensitivity to climate stresses differs in varying communities. The study also identified the major negative climate change elements that communities are exposed to together with their adaptive capacity. Finally, the paper gives calculations of an overall vulnerability index that could be used in tracking inclusive vulnerability to climate change in Zimbabwean communities. Such an index may be critical as a baseline that could be used to evaluate climate change management interventions over time. Using the index would simplify public explanations on the success of various interventions related to communities in question.
1. Introduction
This paper discusses the challenges posed by climate change in the pursuit of some of the broad aspirations of African Union (AU) Agenda 2063. This study exposes the hindrance instigated by climate change in pursuit of the broad AU Agenda 2063 Aspiration 1 and its sub-aspirations listed below.
African people have a high standard of living and quality of life and well-being;
Well-educated citizens and skills revolution underpinned by science, technology and innovation for a knowledge society;
Citizens are healthy, well nourished and have long life spans;
Cities and other settlements are modernised, and people have access to all the basic necessities of life;
Economies are structurally transformed to create shared growth and decent jobs for all;
Modern agriculture for increased production, productivity and value addition contribute to farmer and national prosperity;
The continent while attaining prosperity maintains healthy ecosystems and preserves the African and global environment.
The study uses a case of predominantly rural Zimbabwean districts given the dominance of rural settlements in Africa (United Nations, Department of Economic and Social Affairs, Population Division, Citation2014). AU Agenda 2063 is introduced as an endogenous, shared strategic framework for inclusive growth and sustainable development for Africa’s transformation (African Union Commission, Citation2014). This noble agenda is strongly rooted in the Pan African vision of an integrated, prosperous and peaceful Africa, driven by its own citizens and representing a dynamic force in the global arena (African Union Commission, Citation2014). Agenda 2063 is further supported by an implementation mechanism summarised in seven1 future aspirations (African Union Commission, Citation2014). The paper proceeds by conceptualising climate change and vulnerability in accordance with literature followed by a brief summary of the methods used to give the study findings and conclusions.
2. Conceptualising the vulnerability of Africans to climate change
Climate change continues to be a big challenge in developing sustainable livelihoods and it is likely to present more developmental challenges years to come (Inter-governmental Panel for Climate Change (IPCC), Citation2014). Also, climate change and sustainability have become transnational and corporate economic concerns. In explaining the causes of climate change, this study is guided by the (IPCC, Citation2014) perspective that states the following:
Anthropogenic greenhouse gas emissions have increased since the pre-industrial era, driven largely by economic and population growth, and are now higher than ever. This has led to atmospheric concentrations of carbon dioxide, methane and nitrous oxide that are unprecedented in at least the last 800,000 years. Their effects, together with those of other anthropogenic drivers, have been detected throughout the climate system and are extremely likely to have been the dominant cause of the observed warming since the mid-20th century. (IPCC, Citation2014, p. 1)
Climate change may trigger occurrences such as agricultural droughts, flooding and damaging violent hailstorms that lead to socio-economic crises in rural communities. As such, it is of crucial importance for the socio-economic resilience of rural communities to develop mechanisms that anticipate and minimise the impacts of climate-induced disasters that potentially lead to crises (de Sausmarez, Citation2007). Literature has shown that poor rural communities in most of Africa are vulnerable to such crises (Gandure, Citation2005). The concept of vulnerability was originally applied in geography and risk-hazard studies (Turner et al., Citation2003), but its use has been extended to fields such as ecology, health, food systems and climate change studies (Adger, Citation2006). The IPCC (Citation2007) defined climate change vulnerability as follows:
The degree to which a system is susceptible to, or unable to cope with, adverse effects of climate change, including climate variability and extremes. Vulnerability is a function of the character, magnitude, and rate of climate variation to which a system is exposed, its sensitivity, and its adaptive capacity.
The (IPCC, Citation2007) definition above conceptualises climate change vulnerability as being composed of three factors: sensitivity, exposure and adaptive capacity. Jun, Chung, Kim and Kim (Citation2013) reasoned that when analysing socio-ecological system, specific villages, exposure variables generally quantified the biophysical factors such as inter alia changes in temperature and precipitation. Second, sensitivity indicates or quantifies the extent to which a system can be impacted by stressors or shocks because of its tenuous socio-economic or biophysical characteristics. Sensitivity is, thus, indicative of reaction of a system to stresses or shocks on a shorter time scale. Finally, adaptive capacity generally considers the socio-economic characteristics that enable a system to adjust or cope with changes (Vincent et al., Citation2013).
This paper emanates from a study that was conducted in BuLilima, Gokwe south and Lupane rural districts as part of the Supporting Enhanced Climate Action for Low Carbon and Climate Resilient Development Pathway (SECA) project. This study like many other studies before it (Antwi-Agyei, Dougill, & Stringer, Citation2015; Kelkar, Balachandra, & Gurtoo, Citation2011; Kim & Chung, Citation2013; Malakar & Mishra, Citation2016; Yoo, Hwang, & Choi, Citation2011) conceptualises the adaptation to climate change as a non-independent component that is intricately linked to climate change vulnerability in general. Nhemachena and Hassan (Citation2007) explained adaptation as occurring either at micro or macro level. On the one hand, the macro level focuses on the national/regional scale, specifically on national strategic decisions on climate variations that are usually long term. On the other hand, the micro level focuses on the individual farmer level where the farmer makes tactical decisions in response to weather variations. Ricardian modelling (e.g. Seo & Mendelsohn, Citation2008) has shown that micro adaptation is highly influenced by household asset composition which Vincent et al. (Citation2013) explained as household sensitivity. As such, the study is framed in accordance with the broad concepts of climate change exposure, sensitivity and adaptive capacity. The vulnerability to climate change compromises living standards reduces the chances of seeing a prosperous Africa based on inclusive growth and sustainable development and ultimately the noble visions of AU Agenda 2063.
3. Study area and methods
Rural communities in Zimbabwe continue to suffer from climate change/variability-related impacts and risks such as prolonged dry spells, droughts, water stress, floods, agricultural losses, increased human–wildlife conflict and damage to socio-economic infrastructure (Dodman & Mitlin, Citation2015; Gandure, Citation2005). The country’s natural ecosystems on which communities depend continue to be threatened by over-exploitation and inappropriate management (Dube et al., Citation2016). In addition, the National Climate Change Response Strategy cites weak technical capacity, limited knowledge and inadequate financing as factors reducing the effectiveness of resource users and government’s efforts towards climate proofing development programs, at the local, district and national levels. As noted before, this study was conducted in the rural districts of BuLilima, Gokwe south and Lupane. The districts were purposively sampled based on secondary data (United Nations Development Programme (UNDP), Citation2016). Two wardsFootnote2 in BuLilima, three in Gokwe south and three in Lupane were sampled purposively based on the multi-hazard index presented in the 2015 vulnerability maps of Zimbabwe. Table shows the top seven wards with the highest cumulative multi-hazards indices in the study districts in accordance with the general multi-hazard maps. Fittingly, the wards selected were BuLilima (wards 17 and 15), Gokwe south (wards 2–4) and Lupane (wards 7, 11 and 13) (see Figure , study wards pointed using green arrows).
Table 1. Wards with the highest multi-hazard indices
Figure 1. Maps showing the study area locations in Zimbabwe
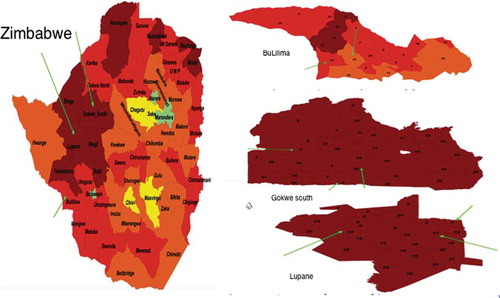
Table also shows the number of households in each ward (household sampling frame) in accordance with the Zimbabwe census of 2012 (Zimbabwe National Statistics Agency (ZIMSTATS), Citation2012). Given that the household was the survey study unit, a representative sample [confidence interval (95%), response distribution (50%) and margin of error (10%)] was extracted in each study ward. The ward sample of households was fairly extracted from three randomly selected villages using stratified random sampling with the villages representing the specific strata. The households in the village were randomly sampled and the completion of the survey was indicative of a valid unit of analysis. In cases where a household pulled out of the survey, a replacement was sort from the same village to ensure the sample quota of the village was fulfilled.
Regarding the qualitative components of the study, Lincoln and Guba (Citation2005) argued that qualitative research did not seek to generalise to the broader population but rather allow for a deeper understanding of particular issues of interest. As such, for the qualitative component of this study, representative samples were not sought but rather at least 12 participants (who did not take part in the survey) in 1 randomly selected village were purposively sampled (according to gender and age) for participation in a focus group discussion (FGDs). Three FGDs were held in each of the study wards bringing the total number of FGDs to 22 (363 participants in total). Key informants were purposively sampled based on their positions of influence and the information they hold within the ward, village or district (64 key informants in total) (see Tables –A in Annex 1 for KII and FGD participants lists).
The survey was conducted amongst households sampled in accordance with the previously discussed methods. The study intended to utilise 502 [BuLilima (125), Gokwe south (193) and Lupane (184)] households for the survey but ultimately managed to collect quantitative data from 514 [(BuLilima (129), Gokwe south (182) and Lupane (203)] households. The population represented in the households was a total of 2,125 individuals [BuLilima (655), Gokwe south (924) and Lupane (546)]. Qualitative data were sourced from key informants and group discussion participants as explained in the methods section. In this regard, 363 individuals [BuLilima (72), Gokwe south (125) and Lupane (166)] responded to the study either as key informants or group discussion participants.
Data were collected using document analysis (selected documents and other relevant literature) followed by a household survey, then FGDs with villagers and finally key informant interviews (KIIs) with influential individuals holding relevant positions of authority in targeted organisations (e.g. village heads, councillors, meteorological office representatives, local authorities, local non-governmental organisations [NGOs]). Tools that were used to collect data were structured questionnaires, group discussion guides, KII guides and relevant databases. Qualitative data collected were recorded verbatim, transcribed and coded in accordance with recurrent themes and subthemes. The emerging themes were used to triangulate quantitative information collected from the survey.
3.1. Vulnerability assessment
In this study, vulnerability is contemplated from the perspective of climate change and its effects on the socio-economic environment of rural communities in Africa. It has been noted that some vulnerability assessments in the past (e.g. Ribot, Citation1995) were quite narrow in focus (e.g. isolated impacts on the natural and biophysical elements in a system), but more recent advances recognised the need to consider the combined socio-economic effects (Luers, Lobell, Sklar, Addams, & Matson, Citation2003; Malakar & Mishra, Citation2016). According to Malakar and Mishra (Citation2016), socio-economic vulnerability assessment involves assessing the vulnerability of a region to a hazard based on the region’s social and economic status. In line with previous similar studies (e.g. Polsky, Neff, & Yarnal, Citation2007), this study assumed an inverse relationship between household socio-economic status and vulnerability to disasters.
As such, a composite index of socio-economic vulnerability has been constructed using a broad set of socio-economic indicators that are relevant across a range of climate change hazards synonymous with most of rural Africa. This index can be used as a simple tracking tool for socio-economic vulnerability throughout the life of the SECA project. Malakar and Mishra (Citation2016) explained that to an extent, setting the criterion and, subsequently, the selection of indicators for the index in question can be deemed subjective. Nonetheless, the methods of selecting variables vary in literature. For instance, some studies have selected indicators directly from the literature (Hahn, Riederer, & Foster, Citation2009), some have followed the literature review with statistical data reduction techniques (Cutter et al., Citation2003) and some studies have also used Delphi technique (i.e. taking experts’ judgement by questionnaire survey) to select indicators (Jun et al., Citation2013; Kim & Chung, Citation2013). Sometimes, the selection might also depend on the availability of data (Malakar & Mishra, Citation2016).
In this study, the indicators have been chosen following literature that analysed disaggregated climate change vulnerability from a socio-economic perspective and across different spatial locations (Malakar & Mishra, Citation2016; Prashar, Shaw, & Takeuchi, Citation2012; Kelkar et al., Citation2011; Cutter et al. 2003). Guided by the literature, the indicators selected are such that they can capture the socio-economic capability of a district/village to face a natural hazard. Kelkar et al. (Citation2011) segregated their indicators into elements of natural, built, infra-structural, social, human, governance, financial and technological. Similarly, Prashar et al. (Citation2012) segregated indicators into five categories, namely physical, social, economic, institutional and natural. As shown in Table , this study segregates indicators in accordance with natural, financial, social, human, produced, institutional and infrastructural factors. Rather than clubbing the whole lot of socio-economic variables under adaptive capacity or sensitivity, this approach broadens the dimensions of socio-economic vulnerability allowing for a more detailed and nuanced picture of reality.
Table 2. Indicators used to derive the climate change socio-economic vulnerability index
3.2. Calculating the socio-economic climate change vulnerability index
The calculation of the index in this study follows the approach taken by Hahn et al. (Citation2009) while calculating the livelihood vulnerability index. The values for a particular indicator for the 24 villages of 8 wards in the 3 districts are brought into relative terms by applying the same approach as that of the human development index given by Anand and Sen (Citation1994), which is the ratio of the difference of the value for that village and the minimum, and the range of maximum and minimum value as depicted in EquationEquation (1)(1)
(1) . This facilitates the next step of aggregation of indicators on different scales.
where Sv is the value of the specific indicator for village v, and Smin and Smax are the minimum and maximum values, respectively, of the indicator among all the villages. The index value of each sub-component indicator for each village is calculated in the above manner. These sub-component indices are then combined to get the five different indices, namely infrastructure, natural, human, social, produced, financial and institutional. The values of these five indices represent the vulnerability of the villages studied from the perspective of these five aspects. Accordingly, a higher value of the index implies greater socio-economic vulnerability to climate change.
Following Malakar and Mishra (Citation2016), this study used the arithmetic mean to aggregate the indices at an equal weighting given the availability of a manageable number of variables in each major sub-component. The equal weighting was also preferred given the intricate relationship that exists amongst the household capital assets (Bebbington, Citation1999; Scoones, Citation1998) that have mostly been used to construct the index. Furthermore, it was assumed that, irrespective of the site, the contributing indicators would be the same and each indicator (or each major component) would contribute to the vulnerability of the place to the same extent in each village. This approach avoided subjectivity by evading any dispute in provision of differential weights in accordance with characteristics of the regions and also allowed for easy comparison. Hence, equal weightage was given to each indicator and a simple average was taken to compute the major component.
Some of the sub-components considered contribute to the increase of vulnerability, whereas some contribute to its decrease. Thus, the approach towards calculating the contribution of each of these sub-components is different. In case of infrastructure, natural, social, financial and institutional indices, all the sub-components contribute to the decrease of vulnerability. Hence, values of the respective sub-component indices are simply added, averaged and subtracted from unity to get the overall respective index (EquationEquation (2)(2)
(2) ).
where Mv is the major component index for village v, and n are the sub-components and the number of sub-components considered in the major component, respectively.
In case of the human factor, all but one specific component add to vulnerability, while in the case of the produced factor, all but one specific component reduce vulnerability. In such cases, the vulnerability index is calculated by subtracting the values that reduce vulnerability from unity (1), summing the resulting figures with the indices contributing increasing vulnerability before averaging to obtain the vulnerability index in terms of the human and produced factors (EquationEquation (3)(3)
(3) ).
(3)
where nn represents the factors that contribute negatively or decrease vulnerability and np represents the factors that contribute positively or increase vulnerability.
Therefore, the greater the index, the higher is the socio-economic vulnerability of the village in question. Given the previously explained equal weightings regardless of spatial distribution and in a quest to root out possible bias, the overall socio-economic vulnerability index () of each ward is given in the following equation:
Where W represents the ward, represents the weight of each of the contributing indices and
represents the contributing indices.
The climate change vulnerability assessment methodology explained thus far will assist stakeholders in the identification of key vulnerability components (sensitivity, exposure and adaptation measures) and make systematic comparisons of vulnerability across different situations, villages and districts. To further visualise climate change vulnerability, this study followed Polsky et al. (Citation2007) who developed the vulnerability-scoping diagram as a tool for visualisation and comparison between different vulnerability assessments. The diagram is composed of three layers: the innermost layer relates to the dimensions of vulnerability, namely exposure, sensitivity and adaptive capacity. The next layer specifies the components of each vulnerability dimensions, i.e. the “specific characteristics” that typify the dimensions. Finally, the outermost layer shows the indicators that are used to measure the components.
4. Results and discussion
Due to data limitations on temperatures for the specific districts, the study made use of national average temperatures of Zimbabwe adapted from the World Bank (Citation2017) that showed an average rise in national temperatures by approximately 1°C. The general rise in average national temperatures is consistent with global trends (IPCC, Citation2014). Secondary meteorological rainfall data indicate that while monthly rainfall amounts during the rainy seasons had largely remained the same, rainfall has become hugely variable in time. Thus, throughout this study, the perceptions of the respondents regarding temperature and rainfall changes were sought in order to confirm if general trends are applicable to the district, ward and village setting. The sections that follow consider climate change vulnerability in accordance with primary data on exposure, sensitivity, adaptive capacity and components of the vulnerability index discussed in Section 3.
4.1. Vulnerability to climate change in the districts: exposure
FGD participants and specific key informants concurred with secondary data noting that rainfall had become unevenly distributed in space and time in the last 10 years so much that it had become a rare occurrence to have rains going for more than 3 days in the rainy season (November–April) (see Box ). The villagers also complained of the recurrence of extreme temperatures stating that summers had become extremely hot while winters had become less cold. These two general notions from primary qualitative data point to a convergence of local perceptions and global statistical perspectives of the earth getting warmer and extreme weather conditions (flash floods, droughts, heat waves etc.) becoming common (IPCC, Citation2014). This congruence was further demonstrated when the villagers and key informants were asked to highlight the main climate change exposure-related challenges. In response, the villagers and key informants listed unpredictable rainy seasons, violent storms, veld fires, recurrent droughts and increase in summer temperatures.
Box 1. Exposure perspectives in the districts
Climate change exposure was revealed to severely affect capital assets of the villagers resulting in associated challenges such as inter alia water scarcity, crop failure; loss of grazing rangelands and other ecosystem goods and services (EGS); loss of livestock, food insecurity, siltation (mostly due to deforestation); and humans and wildlife competing for the same natural capital. Flooding was said to result in the loss of physical assets (livestock, produced crops, household consumer durables, etc.), human capital and its accumulation (as people lost their lives and failed to go to school) and loss of natural capital through leaching of sandy soils. Extreme temperatures were said to cause as heat-related diseases by the FGD participants. Furthermore, the qualitative data showed that the associated climate change exposure challenges came with gender disaggregation because chores were gender specific and those undertaken by women (e.g. fetching water, wild foods [e.g. disappearing Mopani worms], firewood, etc.) had become arduous as women had to travel longer distances and endure extreme temperatures, to complete these tasks.
Despite the noted negative effects of exposure, key informants noted a reluctance to change the old village regime of operation in terms of inter-alia household agriculture, chores and governance. For instance, regarding agriculture, district key informants explained that households generally prepared land, sourced inputs and planted according to the historical agricultural calendar that did not factor in changing climatic conditions.
4.2. Household sensitivity
The most common livelihood strategies in the districts are agricultural in nature with a particular focus on rain fed crop production, irrigation supported horticulture and rearing of small and large livestock. Non-agricultural livelihood strategies in the three districts revolved around small-scale entrepreneurial activities mostly in the handy crafts.
From a human capital dimension, primary and secondary qualifications are most common in the districts though schools are not easily accessible due to distance from some homesteads. Unemployment is very high leading to significant out migration of able-bodied people to neighbouring districts and countries. The significant migration of men has resulted in a skewed population as the population of women has become much higher than that of men particularly in BuLilima that borders Botswana. Health facilities are also few and thinly spread making them inaccessible for many villagers. Women in particular bear the burden of looking after the sick that fail to get modern medical attention.
Respondents in the FGDs and KIIs revealed that regarding financial capital, mobile cash transfer platforms were the most common finance handling systems while access to credit is very limited, and when present, it was rooted in social capital as it is provided by neighbours, relatives and internal savings and lending groups (ISALs). Bank accounts and other forms of formal financial markets were almost non-existent in the rural areas.
Concerning natural capital, communal land was considered scarce in the districts due to natural human population increase while most grazing land has been decimated due to the previously discussed climate exposure issues. Regarding water, respondents explained that most water sources tended to dry up soon after the rainy season. As such, water in all the three districts was considered scarce and mostly drawn from boreholes and wells. Villagers complained that national and local institutions restricted access to forests, thereby increasing vulnerability to negative aspects of climate change.
Local social capital was also shown to allow for voluntary activities (e.g. road works; repair of schools, clinics, local dams and communal field work) to occur and it strengthened climate change resilience and adaptation. Nonetheless, negative social capital rooted in national politics and dependency on hand-outs was noted to be compromising the core function of volunteerism.
From an institutional dimension, local agricultural extension services (AGRITEX), the Environmental Management Agency (EMA), the Rural District Councils (RDCs), representatives of government ministries, civil society organisations and NGOs were the common formal institutions in the districts dealing with climate change effects. Despite the noted institutional presence, the districts conceded to lacking capacity in climate change-related disaster risk reduction (DRR) issues as most of the technocrats had not been trained in dealing with them. The RDC also confessed to lacking knowledge in streamlining gender-sensitive climate change-related interventions and resources for effective climate change interventions, hence the reliance on NGOs for climate change DRR activities.
From an infrastructural dimension, villagers and key informants within the districts argued that it was critical to improve (repair and construct) district infrastructure, particularly clinics, dams, bridges, road networks and schools; improve household and district water harvesting technologies; improve access to financial capital (affordable loans from mainstream financial markets); provide input support schemes suited for the district climatic conditions and build district and village capacity in issues of climate change management. Key informants noted that there was need to support awareness campaigns for environment stewardship (e.g. tree planting, anti-stream bank cultivation campaigns), rehabilitation of water infrastructure and facilitation of market linkages.
4.3. Adaptive capacity
FGD participants and district key informants listed traditional coping strategies in the districts as production of drought resistant crops (particularly small grains) and small livestock particularly goats and chickens. Other adaptation strategies observed were the adoption of climate smart agricultural methods (e.g. conservation agriculture, prioritising irrigation based garden crop production); ISALs as sources of scarce financial capital in times of climate-related changes; remittances, temporary jobs within the communities and in foreign lands (e.g. Botswana in the case of BuLilima); purchasing of stock feed; water harvesting; selling livestock in times of climate-related changes (i.e. conversion of wealth to cash); increased reliance on AGRITEX workers for agricultural season preparations; relocating livestock to far away grazing lots during times of drought and reliance on food aid from the government and NGOs. Unlike Gokwe south, BuLilima and Lupane are not endowed with known easy to reach mineral deposits that can provide safety nets in times of hardship from an artisanal and small-scale mining perspective. As such, BuLilima and Lupane count on natural capital that provides EGS that boosts resilience to negative effects of climate change. The access to this natural capital has however previously been shown to be limited by formal institutions such as the Forestry Commission.
From an institutional dimension, climate change adaptation was pushed by RDCs as they promoted feed lots and cattle fattening for livestock production, minimum tillage in crop production, agroforestry and consolidated gardens that reduced forest destruction, land decongestion, fire guard construction, gulley reclamation, and water harvesting and sustainable wetland utilisation. Other government-related institutions such as AGRITEX and EMA also provided information on climate and weather, supported and encouraged climate smart agriculture and advise on post-harvest management. Nonetheless, community members and key informants considered the responsible institutions ill prepared and more reactive than pro-active when it came to climate-related challenges. Thus, communities requested increased government and NGO support in capacity building related to climate change management.
Key informants explained that challenges limiting the effectiveness of adaptation efforts at institutional level included limited capacity within spear tip organisations such as the EMA, AGRITEX, district authorities and resident’s committees (see Box ). Despite the presence of DRR plans in the districts, the climate change-related issues were still not well understood, thereby making it difficult to streamline important issues such as vulnerability into district climate change management.
Box 2. Institutional limitations
Villagers and key informants through the survey, KIIs and FGDs argued that common coping strategies could be enhanced through sensitisation of communities about climate change in order to allow for community ownership of adaptation programmes. It was suggested that the sensitisation process should include an awareness campaign on climatic changes, the relevant indicators and have a deliberate focus on the youth whose participation was considered very important as they are the drivers of the innovative change required to tackle the climate mitigation and adaptation challenges as they are willing to experiment with new ideas. Resources and processes suggested to support the process of sensitisation were revamped and better equipped secondary schools to improve the quality of human capital produced; livestock restocking to guard against drought induced crop failure; irrigation equipment; staggered planting; improved access to water (boreholes, dams, household water-harvesting technologies); access to financial capital (loans favourable interest rates); improved (weather suited) farming inputs (tractors, hybrid seed, etc.) and equipment that is readily available in the locale; training in agribusiness; dam construction, electrification of schools and households; increased cellular network coverage; and climate proofing the community and household infrastructure (particularly private houses, roads and bridges).
4.4. Climate change vulnerability indices
The predominately qualitative findings discussed thus far have explained the vulnerability of the populations in the districts from an exposure, sensitivity and adaptive capacity perspective. The study went further to consider the quantitative dimensions of climate change vulnerability within the districts. In this regard, quantitative findings revealed that from a socio-economic perspective, BuLilima, Gokwe South and Lupane are predominantly vulnerable to droughts and to a lesser extent flooding. Tables – present socio-economic vulnerability to climate change as an index (Socio Economic Climate Change Vulnerability Index [SECCVI]) within the three districts.
Table 3. BuLilima SECCVI
Table 4. Gokwe south SECCVI
Table 5. Lupane SECCVI
According to Tables –, BuLilima has an overall SECCVI of 0.389, Gokwe south 0.453 and Lupane 0.423. In all the rural districts, the study found that produced and natural assets were the most vulnerable given their reliance on weather-related elements. Villagers in Gokwe south are the most vulnerable to climate change-related challenges within all sub-components of the SECCVI considered. Vulnerability in the various subsections is directly related to the challenges expressed in the qualitative perspectives of the villagers and key informants. As such, implementation of some of the suggestions highlighted in the quantitative findings would likely reduce overall vulnerability in these predominantly rural communities.
4.5. Relevance of climate change to Agenda 2063 aspirations
The study now considers the implications of the vulnerability situation in the typical rural communities discussed above to the overall achievement of the aspirations of AU Agenda 2063.
The dominance of rural settlements in Africa means that any forms of development should have a deliberate focus on improving living standards within the rural areas. High living standards aspired for by AU Agenda 2063 imply high levels on wealth and income within the areas considered rural today. In the face of climate change, such an aspiration is highly difficult to achieve as common household assets (produced and natural) were shown to be most vulnerable to the negative effects of climate change. Furthermore, supporting assets that limit climate change vulnerability (financial, institutional and infrastructural) were also shown to be weak and in need of revitalisation and in some cases recreation. Thus, to contribute towards the realisation of AU Agenda 2063, prioritisation of projects that enhance the resilience of produced and natural capital while building access to financial capital, improving infrastructure and strengthening institutions is critical.
The results have shown that negative effects of climate change also affect the accumulation and quality of human capital with disproportionate negative effects on females in comparison to males. The major negative effects included the destruction of critical infrastructure that supports human capital development and the limiting of human capital capability through food insecurity and weather-related health challenges. In this regard, the aspiration of healthy well-nourished well-educated citizens and a skills revolution underpinned by science, technology and innovation for a knowledge society will become a fleeting illusion if the human capital effects of climate change are not attended to through mechanisms highlighted in the depicted Zimbabwean.
Similarly, the negative effects of climate change on the production of household flow assets such as crops and small livestock have been highlighted in this study. As such, the failure to climate proof agricultural systems using relevant technologies (e.g. those discussed in the findings) will limit the abilities of rural Africa in achieving this specific sub-aspiration. The climate proofing of agriculture would allow for the realisation of a modern agricultural system with higher production, productivity and value addition that contributes to the rural farmer becoming a small-scale entrepreneur and to national prosperity in general.
The institutional and infrastructural challenges observed in the case of rural Zimbabwe were shown to execrate vulnerability to climate change and inhibit the realisation of AU Agenda 2063 as they restrict access to the very natural capital needed by communities to improve socio-economic well-being and reduce vulnerability. Therefore, given the high populations rural Africa, failure to attend to the infrastructural and institutional challenges will undoubtedly make economic growth and the modernisation an arduous task.
Finally, from a natural capital dimension, the Zimbabwean case has shown that climate change has a primary and secondary negative effect on EGS. The primary negative effect is driven by exposure-related issues that see the destruction of natural assets while the secondary negative effect is driven by human responses to climate disasters that include deforestation and overharvesting of EGS when other livelihood strategies fail. As such, if the AU wishes to see the continent grow economically while attaining prosperity, maintain healthy ecosystems, preserving the African and global environment, more effort is required in climate proofing livelihood strategies and environmental protection.
5. Conclusions
This study described the major climate change related challenges that are likely to hinder the realisation of Aspiration 1 of AU Agenda 2063. These challenges have been described from a human, natural, physical, social, financial, institutional and infrastructural dimension. Results showed that climate change effects predominantly affect natural and physical produced assets. Furthermore, the absence and limited access to the other capital assets also limit the visibility of AU Agenda 2063 Aspiration 1 in the horizon.
Acknowledgements
This study was made possible by the support of the United Nations Development Programme (UNDP) (Through the Supporting Enhanced Climate Action for Low Carbon and Climate Resilient Development Pathway (SECA) Project); the Zimbabwe Ministry of Environment, Water and Climate and the Ali-Douglas Development Consultancy.
Data Availability Statement
Raw data were generated at The Institute of Development Studies of the National University of Science and Technology and the Ministry of Environment Water and Climate. Derived data supporting the findings of this study are available from the corresponding author (Nqobizitha Dube) on request.
Additional information
Funding
Notes on contributors

Nqobizitha Dube
Dr Nqobizitha Dube is an economist with an interest in environmental governance, livelihoods and sustainable development. He holds a PhD in Economics from Rhodes University, South Africa. Dr Dube is currently coordinating the graduate school of business PhD programmes and lectures at the Institute of Development Studies of the National University of Science and Technology (IDS-NUST) in Bulawayo.
Notes
1. A prosperous Africa based on inclusive growth and sustainable development: (a) An integrated continent, politically united, based on the ideals of Pan Africanism. (b) An Africa of good governance, respect for human rights, justice and the rule of law. (c) A peaceful and secure Africa. (d) An Africa with a strong cultural Identity, values and ethics. (e) An Africa whose development is people-driven, especially relying on the potential offered by its women and youth; and Africa as a strong, resilient and influential global player and partner.
2. Zimbabwe is divided into provinces, districts, wards and finally villages.
References
- Adger, W. N. (2006). Vulnerability. Global Environmental Change, 16(3), 268–281. doi:10.1016/j.gloenvcha.2006.02.006
- African Union Commission. (2014). AGENDA 2063 the Africa we want. A Shared Strategic Framework for Inclusive Growth and Sustainable Development &A Global Strategy to Optimize the Use of Africa’s Resources for the Benefit of all Africans. Addis Ababa, Ethiopia.
- Anand, S., & Sen, A. (1994). Human development index: Methodology and measurement (No. HDOCPA-1994-02). Human Development Report Office (HDRO). United Nations Development Programme (UNDP). doi:10.3168/jds.S0022-0302(94)77044-2
- Andale, T. (2013). The ten percent condition. Online. Retrieved November 12 2016, from http://www.statisticshowto.com/10-condition/.
- Antwi-Agyei, P., Dougill, A. J., & Stringer, L. C. (2015). Barriers to climate change adaptation: Evidence from northeast Ghana in the context of a systematic literature review. Climate and Development, 7(4), 297–309. doi:10.1080/17565529.2014.951013
- Bebbington., A. (1999). Capitals and capabilities: A framework for analysing peasant viability, rural livelihoods and poverty. World Development, 27(12), 2021–2044. doi:10.1016/S0305-750X(99)00104-7
- Cutter, S. L., Boruff, B. J., & Shirley, W. L. (2003). Social vulnerability to environmental hazards. Social Science Quarterly, 84(2), 242–261.
- de Sausmarez, N. (2007). Crisis management, tourism and sustainability: The role of indicators. Journal of Sustainable Tourism, 15(6), 700–715. doi:10.2167/jost653.0
- Dodman, D., & Mitlin, D. (2015). The national and local politics of climate change adaptation in Zimbabwe. Climate and Development, 7(3), 223–234. doi:10.1080/17565529.2014.934777
- Dube, N., Moyo, F., Sithole, M., Ncube, G., Nkala, P., Tshuma, N., … Mabhena, C. (2016). Institutional exclusion and the tragedy of the commons: Artisanal mining in Matabeleland South Province. Zimbabwe: The Extractive Industries and Society.
- Gandure, S. 2005. Coping with and adapting to drought in Zimbabwe. ( Unpublished PhD Thesis), University of Witwatersrand, Johannesburg.
- Hahn, M. B., Riederer, A. M., & Foster, S. O. (2009). The livelihood vulnerability index: A pragmatic approach to assessing risks from climate variability and change – A case study in Mozambique. Global Environmental Change, 19(1), 74–88. doi:10.1016/j.gloenvcha.2008.11.002
- Inter-governmental Panel for Climate Change (IPCC). (2007). Climate change 2007: Synthesis report. Geneva: Intergovernmental Panel on Climate Change.
- Inter-governmental Panel for Climate Change (IPCC). (2014). Climate change 2014: Impacts, adaptation, and vulnerability. Part A: Global and sectoral aspects. In C. B. Field, V. R. Barros, D. J. Dokken, K. J. Mach, M. D. Mastrandrea, T. E. Bilir, & L. L. White (Eds.), Contribution of working group II to the fifth assessment report of the intergovernmental panel on climate change (pp. 113). Cambridge and New York, NY: Cambridge University Press.
- Jun, K. S., Chung, E. S., Kim, Y. G., & Kim, Y. (2013). A fuzzy multi-criteria approach to flood risk vulnerability in South Korea by considering climate change impacts. Expert Systems with Applications, 40(4), 1003–1013. doi:10.1016/j.eswa.2012.08.013
- Kelkar, U., Balachandra, P., & Gurtoo, A., 2011. Assessing Indian cities for vulnerability to climate change. Proceedings of international conference on Environmental Science and Development (ICESD), Mumbai. Asia-Pacific Chemical, Biological, and Environmental Engineering Society (APCBEES) and IEEE.
- Kim, Y., & Chung, E. S. (2013). Fuzzy VIKOR approach for assessing the vulnerability of the water supply to climate change and variability in South Korea. Applied Mathematical Modelling, 37(22), 9419–9430. doi:10.1016/j.apm.2013.04.040
- Lincoln, Y., & Guba, E. (2005). Paradigmatic controversies, contradictions and emerging confluences. In N. Denzin & Y. Lincoln (Eds.), The handbook of qualitative research (pp. 91–121). Thousand Oaks, London.
- Luers, A. L., Lobell, D. B., Sklar, L. S., Addams, C. L., & Matson, P. A. (2003). A method for quantifying vulnerability, applied to the agricultural system of the Yaqui Valley, Mexico. Global Environmental Change, 13, 255–267. doi:10.1016/S0959-3780(03)00054-2
- Malakar, K., & Mishra, T. (2016). Assessing socio-economic vulnerability to climate change: A city-level index-based approach. Climate and Development, 9(4), 348–363..
- Nhemachena, C., & Hassan, R. (2007). Micro-level analysis of farmers adaption to climate change in Southern Africa. International Food Policy Research Institute.
- Polsky, C., Neff, R., & Yarnal, B. (2007). Building comparable global change vulnerability assessments: The vulnerability scoping diagram. Global Environmental Change, 17(3–4), 472–485. doi:10.1016/j.gloenvcha.2007.01.005
- Prashar, S., Shaw, R., & Takeuchi, Y. (2012). Assessing the resilience of Delhi to climate-related disasters: A comprehensive approach. Natural Hazards, 64(2), 1609–1624. doi:10.1007/s11069-012-0320-4
- Ribot, J. C. (1995). The causal structure of vulnerability: Its application to climate impacts analysis. GeoJournal, 35, 119–122. doi:10.1007/BF00814058
- Scoones, I., 1998. Sustainable rural livelihoods: A framework for analysis. IDS, Working Paper 72, Institute of Development Studies, Sussex, Brighton.
- Seo, S. N., & Mendelsohn, R. (2008). Measuring impacts and adaptations to climate change: A structural Ricardian model of African livestock management. Agricultural Economics, 38(2), 151–165.
- Turner, B. L., Kasperson, R. E., Matson, P. A., McCarthy, J. J., Corell, R. W., Christensen, L., et al. (2003). Science and technology for sustainable development special feature: A framework for vulnerability analysis in sustainability science. Proceedings of the National Academy of Sciences, 100(14), 8074–8079. doi:10.1073/pnas.1231335100
- United Nations Development Programme (UNDP). (2016). Mapping of selected hazards affecting rural livelihoods in Zimbabwe. A district and ward analysis. Harare: United Nations Development programme.
- United Nations, Department of Economic and Social Affairs, Population Division. (2014). World urbanization prospects: The 2014 revision, highlights (ST/ESA/SER.A/352).
- Vincent, K., Cull, T., Chanika, D., Hamazakaza, P., Joubert, A., Macome, E., & Mutonhodza-Davies, C. (2013). Farmers’ responses to climate variability and change in southern Africa–Is it coping or adaptation? Climate and Development, 5(3), 194–205. doi:10.1080/17565529.2013.821052
- World Bank. (2017). Climate change knowledge portal for development practitioners and policy makers. Retrieved, March 10, 2017 from http://sdwebx.worldbank.org/climateportal/index.cfm?page=downscaled_data_download&menu=historical.
- Yoo, G., Hwang, J. H., & Choi, C. (2011). Development and application of a methodology for vulnerability assessment of climate change in coastal cities. Ocean & Coastal Management, 54(7), 524–534. doi:10.1016/j.ocecoaman.2011.04.001
- Zimbabwe National Statistics Agency (ZIMSTATS). (2012). Preliminary census report. Harare: Causeway.
Appendix
ANNEX 1: Distribution of KII and FGD participants
Table A1. BuLilima district qualitative data respondents
Table A2. Gokwe south district qualitative data respondents
Table A3. Lupane district qualitative data respondents