
 ?Mathematical formulae have been encoded as MathML and are displayed in this HTML version using MathJax in order to improve their display. Uncheck the box to turn MathJax off. This feature requires Javascript. Click on a formula to zoom.
Abstract
In the labour market framework, gender inequalities penalizing women in participation, remuneration and career still persist almost everywhere, even though there are remarkable differences between countries. At the EU level, in many cases, the levels of these gaps also vary within the same country. According to human capital theory, labour market outcomes should be strongly influenced by the worker’s educational level. However, the gender gap endures even in countries where women have surpassed men in education. In this paper, both the aspects of spatial differences (in accordance with the NUTs 1 districts) and the impact of education on the gender gap in the labour market are analysed. With this aim, the composite indicator methodology (including sensitivity analysis involving bootstrap techniques) has been used. The results highlight the substantial stability of the gap in eduacation within the same country but a strong variability in the gap in the labour market outcomes within some countries. Adapting national policies to different regional frameworks could be an efficacious strategy for closing the gap.
PUBLIC INTEREST STATEMENT
Despite the remarkable progresses occurred in the last decades, gender disparities in the labour market still persist almost everywhere, even in the developed European countries. They manifest in many aspects, such as participation, career progression and remuneration. In most European countries, women are on average more educated than men, making these inequalities still less justifiable. This article analyzes and compares in a ranking perspective the gender inequalities in the labour market in its manifold aspects considering also education as relevant factor. The areas compared are the European macro-regions corresponding to the NUTS1 districts. These sub-national units allow identifying the differences in the levels of gender disparities also within the same country, suggesting in many cases the need of adapting European and national policies to the different regional contexts. Furthermore, this article identifies the strengths and weakness of the different regions, suggesting the most efficacious actions in different contexts.
1. Introduction
Gender inequalities in the labour market pertain to the different treatments received and outcomes reached by men and women in terms of participation, employment, professional conditions and remuneration. Closing the gender gap contributes to increasing the Gross Domestic Product (GDP) and constitutes a relevant factor for the enhancement and socio-economic development of each State. In the European framework, increasing female labour-force participation and raising the employment rate of women is paramount to meeting the Europe 2020 headline target (75% of the population aged 20–64 employed by 2020) and, therefore, many initiatives have been taken with this aim. Additionally, the levels of gender participation, unemployment rates, part-time diffusion, and segregation differ across countries and, for some of them, even within the same country. This result could seem to be in contradiction with the outcomes actually reached by men and women in education. Indeed, in most European countries, women have overcome men in education and, according to the human capital theory (Becker, Citation1957), this fact should imply that women perform better than men in the labour market. When the differences in the labour market outcomes reached by men and women do not comply with the workers’ productivity and human capital characteristics and persist after controlling for the time of engagement spent on the job, they are often ascribed to discrimination, although not all the unobservable and unexplainable differences in the labour market outcomes are due to discrimination (see among the others Bielby & Baron, Citation1986; Blau, Citation1984). It is well recognized that other factors, such as motherhood and different professional aspirations, affect this result. However, in measuring the gender gap in the labour market, the gender gap in education should also be taken into account because, in countries where female employees are more educated than male employees, a gender gap in the labour market outcomes is less justifiable than in places where men instead overcome women in education.
The issue of the gender gap in the labour market has usually been studied at the national level, assuming the invariance of the phenomenon within each State. Previous studies highlighted the presence of different dynamics within at least some European countries, such as Italy, where the results are economically divided into the South and the North (see for example Capello & Nijkamp, Citation2009; Shankar & Shah, Citation2003). Furthermore, in the international comparisons of the levels of the gender gap, it seems unfair to compare small countries such as Lithuania and Latvia with large countries such as the United Kingdom, Italy, France and Spain, where different economic and social dynamics characterize their districts (Beugelsdijk, Klasing, & Milionis, Citation2015; Eurostat, Citation2011). Therefore, the focus of this paper is to measure the gender gap in the European labour markets at both the national and regional levels (for countries presenting the regional detail) and link the gender gap in the outcomes reached on the labour market with the gender gap in education. According to the regional analysis, the NUTs 1 level has been chosen because it refers to territorial districts identified with the purpose of realizing harmonized and comparable regional socio-economic analyses (Eurostat, Citation2017). In previous work, the authors proposed a composite index for the analysis of the Gender Gap in the European Labour Markets (GGLMI) at the country level. This work analysed the gap between female and male employees in terms of presence (participation, unemployment, etc.) in the working conditions, remuneration and the levels of education (Castellano & Rocca, Citation2014). In this paper, a revised version of the GGLMI is presented. It is calculated at the NUTs 1 and country levels and differs from the previous one due to the inclusion of new indicators measuring the gender wage gap on the tails of wage distribution. Further, the new index separates the information on the gender gap in education from the other information in order to distinguish between the outcomes reached in the labour market and in education. Finally, for the first time, Bulgaria, Romania, Malta, Croatia and Switzerland are included in the analysis.
Therefore, in this paper, various objectives are pursued. On the one side, the increase in the number of countries analysed and the improvement of the composite indicator structure is proposed. On the other side, in addition to the classic national comparisons, when available, the regional detail is considered and the impact of the gap in education is evaluated, proposing two different types of composite indicator: one including the gap in education and one excluding it. It is the first time that the gender gap in labour market outcomes has been treated at a regional level with a wider perspective—that is, accounting for participation, remuneration, segregation and for 31 EU countries—considering the role played by education.
This study could help to identify the weaknesses and strengths of national labour markets from a gender perspective, accounting for the differences within NUTs districts. Countries highlighting significant regional differences in the levels of the gender gap require an investigation of the factors producing this result and the adaptation of national policies to the different regional socio-economic frameworks.
This paper is organized as follows. Section 2 deals with the choice of the regional detail. The framework of analysis is presented in Section 3, while Section 4 shows the methodological choices in the composite indicator construction. Finally, Section 5 shows the results, and in Section 6, some conclusive remarks are drawn.
2. Why an analysis at the NUTs 1 level
In the last few decades, the Communitarian policies have favoured the process of convergence among the member States. Contrariwise, pronounced regional differences in the economic and social sphere persisted and sometimes increased within many European countries (OECD, Citation2016, p.19), inducing the most important suppliers of international statistics, such as Eurostat and OECD, to pay attention to regional details, which have become the benchmark for EU policy-makers (Capello & Nijkamp, Citation2009). The EU cohesion policies are indeed specific actions addressed only to the neediest NUTs areas, in order to remove economic and social disparities across the EU (European Parliament Committe of Regional Development, Citation2013). The territorial unit chosen for the identification of the eligibility of regions for cohesion funds is NUTs 2, while the NUTs 1 level allows for identifying regions sharing the same level of development and similar historical and socio-cultural factors (Eurostat, Citation2013). In 2010, the European Council, in order to achieve the goals stated in the Europe 2020 strategy, assumed as the most important indicator the GDP per inhabitant (in PPS).Footnote1 OECD, in the Regional Outlook, analysed GDP and found increasing gaps in income and in productivity among regions, cities and people and studied the implications of these trends for the well-being of people living in different places. According to the Eurostat regional statistics, significant economic and social differences across regions concern, for example, Italy, the United Kingdom and Spain while they result minimally in Finland, Ireland, Sweden and Germany. Indeed, the Southern Italian regions, together with most of the Eastern European regions and some Portuguese and Spanish regions, are addressed as the most in need of cohesion funds. Southern Italy is therefore more similar to these areas than to the Northern Italian Regions that, instead, show high levels of economic development, the same as those reached by Switzerland and most German and Norwegian regions (Faina & Lopez-Rodriguez, Citation2004).
The differences in the economic and social framework within the same country are also related to the degree of urbanisation. Especially with reference to large cities such as London, Paris and Madrid, their territories and neighbours constitute a separate area with their own specific characteristics. Capital regions usually act as a magnet, especially for young, highly qualified and mobile generations. The areas of London, Paris and Hamburg, together with Luxembourg, are in fact at the top in the classification for per capita GDP, while the Romanian, Bulgarian and Hungarian regions are the poorest regions of the European Union. Significant regional disparities also emerge with some socio-demographic indicators, such as fertility and the female propensity to work rates (Eurostat, Citation2017). The need to provide support at global, regional and national levels as a system of coordination to accelerate gender equality and the empowerment of women has also been highlighted by the United Nations (Citation2011), which underlined, in particular, the importance of regional specificities. With this regard, the EU has recently recognized the need to support the implementation of existing local and regional gender equality initiatives (European Parliament, Citation2017). This justifies the reason to treat the gender gap at the regional level.
Despite this evidence, few scientific works chose a sub-national level as their territorial unit in order to investigate the gender gap. For example, with reference to Italy, Olivetti (Citation2008) Bozzano (Citation2014) and Quintano, Castellano, and Rocca (Citation2010) highlighted the disparities existing across the Italian regions also in terms of gender gap in the labour market. The different magnitude of the gender wage gap across Spanish regions was examined by Murillo, Ramos, and Hipólito (Citation2017) while Duranton and Monastiriotis (Citation2001) questioned the matter of the north-south divide in the UK regions.
In this paper, the indicators used in the analysis are, in part, extracted by the Eurostat on-line database and, in part, have been constructed through ad hoc elaborations on EU-SILC data. This is currently the main European reference source for comparable and multidimensional socio-economic statistics, providing exhaustive and harmonised target data on employment status, type of occupation, activity sector and single-income components, taxes and contributions. The analysis involves only employees aged 25–64. Excluding self-employed can be misleading because it may hide the duality of the labour market (Parker, Citation2004). Nevertheless, self-employed incomes are more affected by underreporting than the employee ones and present more difficulties in measuring the hourly wage. EU-SILC data can be used to produce accurate direct estimates until the NUTs 2 level. The reference year is 2013. The territorial level chosen for the analysis is NUTs 1, in order to ensure the robustness of estimates when the construction of some indicators involves only a subset of the units of analysis from the sample. Further, regions at NUTs 1 level are much more similar in size than EU countries, even if some cultural and economic heterogeneity might persist (Markaki & Longhi, Citation2013). Eurostat states that it is very difficult to compare a small Member State such as Malta, which has approximately 430,000 inhabitants, or Luxembourg, which has approximately 560,000 inhabitants, with Germany, which has just over 81 million inhabitants (http://ec.europa.eu/eurostat/web/regions). Comparing data at a sub-national level is often more meaningful, and such an analysis may also highlight potential disparities hidden when studying national data.Footnote2
However, there are a number of limitations in this analysis. First, in order to analyse gender disparities in the labour market, rather than the NUTs 1 regional detail, the Labour Market Areas should be more adequate because they are specifically defined with the purpose of evaluating labour market outcomes such as employment, unemployment and related topics. Nevertheless, most of the indicators considered are not available for this domain. Furthermore, for Germany, estimates are not available at the sub-national level. However, if we look at the Eurostat regional statistics on labour market and on per capita GDP, Germany shows a substantial homogeneity within its borders for most of the indicators. For example, the regional total unemployment rate for the 20–64 years population in 2013 in Germany showed a mean value of 5.5, with a standard deviation (sd) of 2.18 against a mean value of 12.2 in Italy with a sd of 5.31. Similar values also result when the data are analysed by gender (Germany: for males a mean of 5.8 with a sd of 2.43 and for females a mean of 5.2 with a sd of 1.99; Italy: for males a mean of 11.5 with a sd of 5.34 and for females a mean of 13.3 with a sd of 5.63). Even for Belgium, the Netherlands and Portugal, the details pertaining to NUTs 1 level are not provided, but the smaller size of these countries makes it more realistic to consider them as a single territorial unit. After all, other countries such as the Czech Republic, Denmark, Estonia and Ireland are not divided into smaller territorial units at the NUTs 1 level. Finally, some indicators used in the analysis, such as the share of women in Parliament, are invariant for all the regions within each State. However, in light of these limitations, the main scope of the analysis proposed consists verifying the differences across NUTs 1 areas belonging to the same country for those countries showing regional details rather than ranking the NUTs 1 regions.
3. The framework of analysis
Especially in the past, EU countries appeared to be very different in the economic and cultural spheres, and many differences still persist. Recently, their efforts have been first addressed to joining the EU and second, to surviving the financial and economic crisis. Analysing the European labour markets from a gender perspective, three different types of regimes emerge (European Commission, Citation2009, 1) Labour markets with low female employment rates; Italy, Greece, Poland, and Hungary belong to this type. With the exception of Greece, they show small gender wage gaps but a strong rigidity in labour market functioning. In these countries, working women adapt to a male labour market organization. 2) The strongly segregated labour markets of Cyprus, Estonia, the Slovak Republic and Finland, where the concentration of women in less well-remunerated jobs produces a high gender wage gap. 3) Finally, the Nordic and Central countries of Denmark, the United Kingdom, the Netherlands, Austria, Germany and Sweden, which show labour markets with high shares of women working part-time. In these countries, the lower remuneration and career prospects associated with part-time positions are the main determinants of the high levels of the gender wage gap, but these disadvantages are balanced by very high female participation rates. Analysing EU countries according to the levels of integration of women in the labour market over the course of their lives, many models can be identified. The most successful one is, for many aspects, the Scandinavian model of “universal breadwinner”, allowing the combination of high taxes and lavish welfare systems with fast growth, low unemployment, high levels of female employment and, consequently, high fertility rates (Eitrheim & Kuhnle, Citation2000; Esping-Andersen, Citation2002). Very different is the Mediterranean model, where high levels of unemployment, low female participation rates, very rigid labour markets and welfare systems, and the inability to adequately support female work (Cipollone, Patacchini, & Vallanti, Citation2014) produced a collapse in the fertility rates. The condition of women in the Eastern countries are, for some aspects, similar to that of Mediterranean countries. Indeed, Eastern European countries also show some of the structural economic problems of the Mediterranean ones, such as high unemployment rates. However, most of them have maintained the high female propensity to work of the past planned economy. Finally, the continental countries of Germany and Austria and, to a lesser extent, France and Belgium show low unemployment rates and great attention to gender issues (OECD, Citation2004), even if in a framework that tends to privilege men (Castellano & Rocca, Citation2018).
Through the composite indicator, many of these aspects characterizing the condition of female and male employees in the labour market are analysed from a comparative perspective. The dimensions of the gender gap in the labour market correspond to the pillars of the composite indicator (Table ).
Table 1. Indicators and pillars of the composite indicator. Year 2013
The first pillar measures the gap in participation and in the contractual conditions. A high rate of female participation is not a sufficient condition of gender equality. Many disparities persist due to the differences in jobs contracts, time spent at work and other unobservable characteristics. The gender gap in engagement in the labour market is measured through the gap in the percentage of employees working part-time. Part-time employment reduces the time spent at work and, consequently, the accumulation of work experience, hindering career progression. When it is a voluntary choice, it is positively evaluated because it allows the reconciliation of work and family life. Unemployment and involuntary part-time rates are instead indicators of, respectively, lack of employment opportunities and under-occupation. Finally, the gap in the share of employees working with a temporary contract measures the gender gap in work precariousness.
The second pillar evaluates the integration of women into the labour market; the indicators used with this aim are the share of women in some prestigious careers (indicators 2.1 and 2.2) and the levels of horizontal and vertical segregation. Indeed, men’s and women’s jobs differ greatly, whether across sectors, industries, occupations, types of jobs, or types of firms, and women appear to be concentrated in low-productivity jobs. Horizontal segregation concerns the different distribution of female and male employees across the economic activity sectors and the types of jobs (Shrivastava & Tiwari, Citation2014; Watts, Citation1998). Vertical segregation refers to the glass ceiling—the unbreakable barrier that keeps women from rising to the upper rungs of the corporate ladder, regardless of their qualifications or achievements (Federal Glass Ceiling Commission, Citation1995)—and to their under-representation in economic and political decision-making positions. For the measure of segregation, we used the Gibb’s index, which is not affected by differing labour market compositions and is therefore useful for comparisons across countries:
where Mi and Fi are, respectively, the numbers of males and females working in the jth economic sector (professional qualification) and Tj = Mj + Fj.
The third pillar includes indicators of work remuneration and education. Indicators 3.1 and 3.2 measure the gap in the remuneration of work experience and education. They are calculated as ratios between the female and male regression coefficients of these human capital characteristics in a Mincerian multiple regression model (the log of the hourly gross income is estimated with a set of personal socio-demographic and professional characteristics influencing it, such as experience, squared experience, child presence, civil status, professional qualifications, economic activity sector, health, supervisor position, degree of urbanisation of the area of residence, mean number of working hours per week, number of years at school, type of contract and firm size) separately estimated for female and male employees. Indicator 3.3 measures the gender wage gap, defined as the absolute difference between women’s and men’s average weekly full-time equivalent earnings, expressed as a percentage of men’s earnings. To take into account differences in working hours and the impact of the income tax system, it considers the differences in gross hourly wages. However, to account for the wage differences on the tails of income distribution, indicators 3.5 and 3.6 express the wage gap at the 10th and 90th percentiles, respectively. A higher gap in the left side of wage distribution (10th percentile) is identified as the sticky floor effect, that is, the inability of women to rise above entry-level positions and thus to remain trapped in low-wage and low-mobility jobs. When the gap is higher, on the upper tail of wage distribution (90th percentile), we refer to the glass ceiling effect, that is, the result of an upper limit to professional advancement for women. The factors determining the gender pay gap can be manifold. Recent evidence suggests that differences connected with human capital characteristics only play a minor role in the persistence of the gender gap (World Bank, Citation2012). Vincent (Citation2013) quantifies them as less than a third of the wage gap. The part of the gender wage gap that is not due to human capital characteristics could hide discrimination. Even if discrimination is legally contrasted, many forms of indirect discrimination still persist. Indicator 3.4 measures the share of the gender wage gap not due to the observable characteristics and then ascribable to discrimination. It is calculated through the Oaxaca-Blinder gender wage gap decomposition (Oaxaca, Citation1973).
Finally, indicators 3.7 and 3.8 measure the gap in education. Education can be considered an outcome variable when we assess the opportunities to attain a high level of education. Therefore, the gap in education is afterwards excluded by the composite indicator construction in order to test its impact on the country and region ranking and to assess the gender gap in the labour market in light of the gender gap in education.
4. The RGGLMI construction
After that the theoretical framework has been identified, for the composite indicator construction indicators have to be synthesized first into the pillars and after into the final index. Following the approach suggested by Aiello and Attanasio (Citation2006), a composite indicator X can be written as:
where xC is the Cth vector of simple, observed indicators belonging to the pillar C, T is the transformation function calculating each pillar and f is the aggregating function, with which the pillars are aggregated into the composite indicator. The underline structure of data has been explored through Principal Component Analysis. In order to allow data combination, data have been normalized using the min-max method, so that the maximum is 1 and the minimum 0 for each indicator. This technique allows preserving data proportionality, which is a preferable characteristic when variables assume very different ranges (Joint Research Centre, Citation2005). Anyway, as this type of normalization is not convenient in presence of a strong asymmetry or in presence of outliers, data were submitted to winsorization when their univariate distributions were overly irregular (in terms of skewness and kurtosis). Further, data were corrected for direction when their versus was not concordant with the latent variable they concur to measure (the bigger, the better). Therefore, for each jma variable, we have:
After, indicators were aggregated the pillar and after into the final index. It is not easy to identify the optimal aggregation method, because each of them has some advantages and some disadvantages. Therefore, in order to obtain a final reliable and robust ranking, different aggregation techniques were used.
In particular, for the aggregation of the indicators into the pillars we used:
Factorial methods: application of the Principal Component Analysis to the indicators within each pillar: the most relevant components were retained and synthesized through the arithmetic mean, weighting each component by the rescaled share of the total variance explained by each of them:
with
where Q is the number of the significant components within the pillar C and wqc is the normalized variability explained by the qth component.
This method takes the advantage of considering the correlation among the indicators, obtaining easily new uncorrelated variables and a reliable system of weights for the components in relation to their relevance; anyway, it accepts the full compensability among the variables, i.e. the possibility of offsetting a disadvantage on some criteria by an advantage on another criterion (Munda, Citation2016).
Additive aggregation methods: calculate the arithmetic mean of the indicators for each pillar; it represents the most simple and conservative way to synthesize indicators, but it accepts the full compensability among variables. Therefore, it implies that indicators are mutually preferentially independent, that is that the trade-off ratio between two variables is independent of the values of the Q-2 other variables within the pillar, allowing the assessment of the marginal contribution of each variable separately (Mazziotta & Pareto, Citation2016).
Geometric aggregation methods: are based on the geometric mean of the indicators for each pillar; it ensures that there is no possibility of a full compensation of low results in one indicator with high results in other indicators and excludes the independence of the trade-off between two variables from the values of the other Q-2 variables.
Afterwards, for the aggregation of the pillars into the composite indicator we refer to:
Linear aggregation (arithmetic mean)
Geometric aggregation (geometric mean)
A method based on the benchmarking with distance to the target: it consists in ranking countries in relation to their distance from the ideal country, that is the country with the best value for each pillar. At this aim, we used the Euclidean distance, according to the Wroclaw’s taxonomic approach:
where C = 1,…,M counts for the pillars, T(xc) is the value of the cth pillar for country x and y is the corresponding pillar for the ideal country.
Non-compensatory multicriteria approaches: these methods aggregate and weight units sorting them into binary relations for pair-wise comparisons and explain the relationships created by these binary relations alternatively:
assigning a weight to each unit in relation to the position assumed in the ranking for each pillar; this method refers to the Borda’s rule and uses the frequency matrix. It is based on the concept of intensity of preference accepting that the weights assume the meaning of trade off:
where Sk shows the number of times that the unit i is kmo in the ranking according to the M pillars; (n–k) is the corresponding weight; n is the number of units compared; the final rank is calculated on the basis of the score Bi received by each unit
summarizing the results of the comparisons of each unit against all the other ones for each aspect. This method is based on the outranking matrix and uses the Condorcet approach. In this case, the weights have the meaning of importance coefficients. In the outranking matrix, any generic element ejk, j ≠ k is the result of the pair-wise comparisons, according to all the M pillars, between units j and k. Such a global pair-wise comparison is obtained by means of equation:
and wC(Prjk) = 1 if the unit j is better than the unit k for the C-pillar and 0 otherwise and ejk+ekj = M. The final rank for the unit i is calculated according to the sum of the eik calculated for the unit i compared with all the other units.
Alternatively, we experimented also the synthesis of all the indicators into the composite indicator, without organizing them hierarchically into the pillars. In this case, all single indicators assume the role of a pillar in the composite indicator construction and the final index is not influenced by the hierarchical scheme chosen.
Overall, 14 different methods of aggregation were applied and the final result was obtained as the ranking of the median values of the 14 corresponding rankings. The volatility of results was assessed through bootstrap procedures according to Efron and Tibshirani (Citation1998).
5. The results
5.1. A preliminary explorative analysis
Before analyzing the rankings related to the composite indicators, it is useful to look at the main results in terms of individual indicators (Figure ). Most of the indicators are constructed as ratios between female and male values. Consequently, a good positioning at the top of the ranking (represented in the map with a darker colour because it is expressed by a higher normalized value of the indicator, near 1) highlights that in the corresponding area the female condition is better than the male one or that the gap is lower, in comparison with the other areas, regardless of its magnitude. For example, with reference to indicator 1.1, measuring the gap in the unemployment rates, some Spanish regions, while having the highest levels of unemployment rates, are not at the bottom of the classification for this indicator because in some cases the female unemployment rates are lower than the male ones. Contrariwise, other countries (for example Switzerland) occupy a rank at the bottom of classification even if the unemployment is very low, because the female unemployment rate is higher than the male rate. Likewise, analysing the gap in part-time work, the Netherlands, where more than 3 out of 4 women work part-time, is only 42nd in the rank because the gap between them and the male employees working part-time is smaller than in many other countries.
Figure 1. Maps for a selection of indicators(*) included in the composite index measured at NUTS1 level.
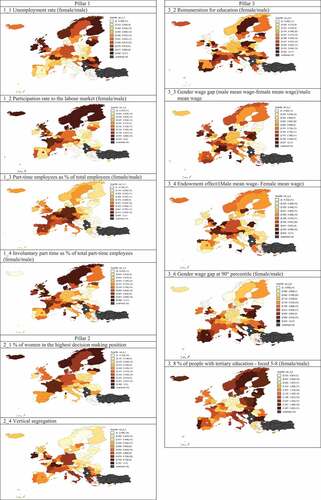
In many cases, regions belonging to the same country show very different outcomes. The regional performances differ much according to the different aspects of the gender gap. For example, the Bulgarian regions highlight high gender gaps for the majority of indicators but low levels of gender segregation, coherently with their past history of a planned economy with high level of female participation in the labour market. However, not all the ex-communist countries have maintained a high level of female participation. Indeed, the Czech Republic, Romania and Poland, together with Italian and Greek regions, highlight the highest gender gap in participation rates while Norway, Iceland Sweden and Finland show opposite characteristics. Overall, Eastern and Mediterranean countries also have the highest percentages of people at risk of poverty and many other economic structural problems (Addabbo, Bastos, Falcão Casca, Duvvury, & Nì Léime, Citation2015; Eurostat, Citation2017).
Here are just a few comments on the indicators measuring the labour market remuneration. The gender wage gap is, on average, very high in the Eastern countries of Bulgaria, Estonia, and the Czech Republic and in all the Romanian regions while the smallest gaps are found in some Polish regions, Italy, some Greek Islands and Denmark. Most Eastern European countries also show the highest share of unexplained gender wage gaps while the gender gap on the tails of the distribution is maximized in Austria and Greece. Finally, with reference to education, Switzerland, Austria, Germany, Luxembourg, the Netherland and some Romanian and Greek regions are the only areas where the share of men with tertiary education is higher than that of women. Therefore, most European countries, even if still affected by many forms of gender disparity, highlight a high potential in the female labour force that, if opportunely appreciated, could represent a great opportunity of social and economic growth for these countries.
Trying to draw some preliminary conclusions on these rankings, the condition of female employees in Great Britain is globally good, especially for the gap in unemployment rates and in the levels of vertical segregation, where no region clearly prevails on the other ones. As such, excluding the indicators measuring horizontal segregation, the Scandinavian countries are in an optimal position with respect to all the other indicators, in particular for the levels of female participation and the presence of women at the top of some important careers. France and Spain highlight overall good conditions for women, but in France they are concentrated especially in the Ile de France and in the South-west regions. The condition of women in the South of Italy, Greece and Cyprus—where they suffer high disparities in the levels of unemployment, in the temporary contracts, in the remuneration of education and a high gap in the left side of wage distribution—is particularly critical.
The results obtained at the country level highlight the optimal position of the United Kingdom and Germany for the first pillar indicators (labour market participation and contractual conditions) and confirm the supremacy of Scandinavian countries in relation to the integration of women into the labour market measured through the second pillar. The Netherlands, Denmark and Ireland show a good position for the indicators of the third dimension related to the labour market return while with reference to education Lithuania, Latvia, Estonia, Portugal, and Finland confirm their good positioning.
5.2. The within-country variability and the composite indicator
To appreciate the extent to which the NUTs 1 areas within each country differ in relation to the gender gap for the indicators used in the composite indicator construction, Table shows their coefficients of variation.
Table 2. Coefficient of variation of indicators measured within each country
The gap in education, unemployment, participation and part-time work is substantially stable within these countries. Higher regional differences in gender gaps arise when employees enter the labour market. Indeed, the gap in the share of involuntary part-time workers, in the remuneration of experience and education, in the wage gaps and in its unexplained component vary highly. Hungary, Austria, Romania and the United Kingdom show very different gaps especially in the share of involuntary part-time work, while the Mediterranean regions differ much, especially for the remuneration of human capital characteristics.
In terms of the composite indicator, the Swedish regions and Finland are at the top, followed by Denmark, the Mediterranean France regions and Latvia (Tables and ). Table shows the maximum and minimum positions occupied by the NUTs 1 regions within each country in the composite indicator ranking; Table reports the composite indicator ranking for countries. For each country position—obtained as median rank of the results of the different aggregation techniques—the corresponding confidence interval shows the connected results volatility.Footnote3 These intervals have been calculated through bootstrap procedures (Saisana, d’Hombres, & Saltelli, Citation2011). A high volatility arises for Estonia, some Spanish and Polish regions, the Italian Isles and Iceland.
Table 3. Minimum and maximum median ranks of NUTs 1 areas within each European country
Table 4. Median ranks for the composite indicator for European countries. Confidence intervals around median obtained through a bootstrap procedure using 2,500 simulations
French regions and Latvia reach good performances. Even if they are not at the top of the rankings for the single indicators, they occupy a good position in terms of the composite index.
The analysis at the country level highlights Latvia, Estonia and Sweden in the first positions while at the bottom of the classification we find the Czech Republic and Cyprus and, to a lesser extent, Austria, Luxembourg and Romania. These countries privilege male employees in the labour market in many aspects. Further, the ranking highlights, in many cases, a strong heterogeneity within countries; this is the case for Spain, where the position in the ranking ranges from the 13th for the Eastern area (ES5) to 51st for the North-east (ES2), and Italy, where the Southern area ranks 51st while the other regions perform up to 18 positions better. Finally, Poland highlights a good position only for the Central area (PL1), which is 22nd, while the other NUTs 1 areas range from the 45th to the 61st positions. Comparing the positions occupied in the regional and country composite indicator rankings, areas gaining positions from the country to the NUTs 1 area rankings are Denmark, Lithuania, Luxembourg, the Netherlands, Norway and Finland. On the opposite side, Estonia and Greece lose many positions. Finally, Latvia confirms its supremacy in both the rankings, but Sweden, Cyprus, the Czech Republic, Germany, Ireland and Switzerland also remain essentially stable.
5.3. The gender gap in education vs the gender gap on the labour market
Comparing the RGGLMI with the ranking obtained excluding the indicators measuring the gap in education, Germany and Switzerland gain, respectively, 40 and 30 positions, denoting that their labour markets reward more men over all because they are, on average, more educated. The opposite happens in many other countries where women are, on average, more educated than men, especially in Latvia, Lithuania Portugal Bulgaria and Estonia. Education still does not adequately pay off for women in many European countries.
To contextualize results and favour their comprehension, in Table , we report the correlation coefficients between the composite indicator rankings at the regional and country levels with some relevant socio-economic indicators. In addition to the per capita GDP, measuring the country’s richness and productivity, we refer to the levels of unemployment and participation rates for females and their gap with males; the share of NEETs (i.e., young people not in employment, education and training, measuring the difficulties of young people in entering the labour market); and the fertility rate. This latter level can be assumed as a proxy of the difficulties of reconciling work and family life. With reference to per capita GDP, while no significant relationship emerges with the composite indicator at the country level, the correlation with the regional composite index is high and inverse. Thus, richer countries show a lower gender gap in the labour market. Additionally, according to the share of NEETs only the correlation with the regional indicator is significant and direct.
Table 5. Correlation coefficients between the composite indicators and some important socio-demographic indicator. Year 2013
Further, the gender gap is lower in countries with high fertility rates. This evidence appears both at the country and regional levels, confirming that good performances in the labour market, in terms of participation, presence at the top of careers and low wage differentials are compatible with high fertility rates. In contrast, the higher the barriers in the labour market in terms of participation and success reached, the lower the propensity to have a child.
Finally, while no significant relationship emerges between the female unemployment and participation rates on one side and composite indicators on the other, the correlation between the RGGLMI and the ratio of unemployment rates is positive, denoting that the gender gap is higher where the unemployment rates penalize more women than men.
6. Conclusions
In this paper, for the first time, the gender gap in the European labour markets has been analysed through the composite indicator methodology at the NUTs 1 level, as well as at the country level. The NUTs 1 level enriches the analysis with new, significant evidence. The areas belonging to the same country usually share a common economic regime and the same welfare policies. However, high regional disparities exist in many socio-economic indicators; they also reflect disparities in treatment of female and male employees. In the future, they are expected to increase because of the increasing intensity of knowledge of the economy and the increased importance of dense locations for knowledge-based industries (European Trade Union Institute, Citation2012).
The analysis suggests that the levels of gender gaps in education, in participation in the labour market, in unemployment and in part-time work are very similar within countries. Conversely, high regional gender disparities arise in the levels of involuntary part-time work, in the remuneration of education and experience and in the unexplained share of wage gaps. Thus, even in a common framework of welfare policies, the different attention paid to counteract discrimination and to favour conciliation between family and work is reflected in the consolidated gender stereotypes, and in the business practices of the personnel management. Difficulties in balancing work and private life are indeed among the main causes of the different outcomes reached by men and women on the labour market (World Bank, Citation2012). Unfortunately, it is not easy to measure these variables, especially with regional detail.
Policy makers should promote conciliation measures and actions finalized to increase the equal opportunities first in education and then at work. Family policies, social protection systems and measures finalized to reduce gender inequalities, encouraging high education and job opportunities, are only some possible measures.
Education is the basic prerequisite for access to more highly qualified and rewarded work.
The separate analysis of the indicators measuring the gap in education stimulates other important reflections. The higher female education, on average, in most European countries is not sufficient to guarantee lower gender gaps in the labour market. Among the countries where women are more educated than men, only Latvia, Lithuania, Sweden and Iceland highlight a small gender gap in the labour market.
At the top of the composite indicator for the smallest gender gap, we find many Northern countries, where the participation of women, is very high and their presence at the top of managerial careers and in Parliament is the greatest. A more equal division of family tasks within couples probably contributes to this result (European Parliament—Directorate-General for internal policies, Citation2016). Lithuania, Latvia, Ireland and some French regions follow just after in the rankings while we find Cyprus, Romania, the Czech Republic and some regions of Greece and Hungary at the bottom of the rankings.
Furthermore, the analysis at the NUTs 1 level highlights some dynamics that the analysis at the country level is unable to show. Usually, the regions where the gender gap in the labour market is higher have lower levels of per capita GDP, lower fertility rates and lower female participation rates in the labour market. The different economic condition of the NUTs 1 regions affects the capacity to close the gender gap, but gender inequality is primarily a social issue, where the unobserved factors still predominate in its outcomes. Education is fundamental in increasing female job opportunities, but it is not sufficient.
To avoid weaker regions falling further behind, policymakers have to address this problem with more efficacious regional policies. They should start with the awareness that regional disparities reflect differences between people and not just places. Therefore, they should aim to increase the awareness of gender equality in all the spheres, removing the consolidated gender stereotypes and filling in the lack of workforce skills. This should be done by investing in higher education and improving its qualitative content, thus financing Universities and large companies for more innovative training because adequate workforce skills will allow them to attract investments and set up a virtuous circle of development, particularly in the most disadvantaged regions. However, it will involve a cultural revolution, based on the evidence of the crucial role played by the female workforce on economic growth.
Additional information
Funding
Notes on contributors
Rosalia Castellano
Rosalia Castellano, PdD, is Full Professor of Economic Statistics in the Department of Management and Quantitative Studies at the University of Naples Parthenope. Her research focuses on the analysis of the labour market, household conditions and sustainability. Her work is informed by theories from economics, sociology and behavioural analysis.
Antonella Rocca
Antonella Rocca, PhD, is a Researcher of Economic Statistics in the Department of Management and Quantitative Studies at the University of Naples Parthenope. Her research focuses on the analysis of the conditions of the most vulnerable groups in the labour market, such as women and young people. Her work is informed by theories from economics, sociology and behavioural analysis.
Notes
1. It was designed as the successor to the Lisbon strategy and places emphasis on promoting a growth pact that can lead to a smart, sustainable and inclusive economy with the aim to overcome structural weaknesses, improve Europe’s competitiveness and productivity, and underpin a sustainable social market economy.
2. In the field of quality of life, see for example Annoni, Weziak-Bialowolska, and Dijkstra (Citation2012).
3. For sake of brevity, in Table the confidence intervals have been omitted, but they are available on request by authors.
Related Research Data
References
- Addabbo, T., Bastos, A., Falcão Casca, S., Duvvury, N., & Nì Léime, Á. (2015). Gender and labour in times of austerity: Ireland, Italy and Portugal in comparative perspective. International Labour Review, 154(4), 449–18. doi:10.1111/j.1564-913X.2015.00250.x
- Aiello, F., & Attanasio, M. (2006). Some issues in constructing composite indicators, VIII International Meeting on Quantitative Methods for Applied Sciences, Certosa di Pontignano.
- Annoni, P., Weziak-Bialowolska, D., & Dijkstra, L. (2012). Quality of life at the sub-national level: An operational example for the EU. Luxembourg: Joint Research Centre publication.
- Becker, G. S. (1957). The economics of discrimination. Chicago: University of Chicago Press.
- Beugelsdijk, S., Klasing, M., & Milionis, P. (2015). Regional TFP differences in Europe and what we can learn from them. Groningen: University of Groningen.
- Bielby, W., & Baron, J. (1986). Men and women at work: Sex segregation and statistical discrimination. American Journal of Sociology, 91(4), 759–799. doi:10.1086/228350
- Blau, F. D. (1984). Occupational segregation and labor market discrimination. In B. F. Reskin (Ed.), Sex segregation in the workplace: Trends, explanations and remedies (pp. 117–143). Washington, DC: National Academy Press.
- Bozzano, M. (2014, January). Assessing gender inequality among Italian regions: The Italian gender gap index, Rivista di Politica Economica. Issue 1. SIPI Spa, 255–300.
- Capello, R., & Nijkamp, P. (2009). Handbook of regional growth and development theories. Cheltenham and Northampton, MA: Edward Elgar publishing.
- Castellano, R., & Rocca, A. (2014). Gender gap and labour market participation: A composite indicator for the ranking of European countries. International Journal of Manpower, 35(3), 345–367. doi:10.1108/IJM-07-2012-0107
- Castellano, R., & Rocca, A. (2018). Gender disparities in European labour markets: A comparison between female and male employees. International Labour Review, 157(4), 589–608. doi:10.1111/ilr.12122
- Cipollone, A., Patacchini, E., & Vallanti, G. (2014). Female labour market participation in Europe: Novel evidence on trends and shaping factors. IZA Journal of European Labor Studies, 3(1), 1–40. doi:10.1186/2193-9012-3-18
- Duranton, G., & Monastiriotis, V. (2001). Mind the gap how much does Britain’s north-south divide matter? London: CentrePiece Spring.
- Efron, B., & Tibshirani, R. J. (1998). An introduction to the bootstrap. New York: Chapman & Hall/CRC.
- Eitrheim, P., & Kuhnle, S. (2000). Nordic welfare states in 1990s: Institutional stability, signs of divergence. In S. Kuhnle (Ed.), Survival of the European welfare state. London: Routledge.
- Esping-Andersen, G. (2002). Why we need a new welfare state. Oxford: Oxford Scholarship online.
- European Commission. (2009). Gender segregation in the labour market root causes, implications and policy responses in the EU. Luxembourg: Author.
- European Parliament. (2017, February 8). Motion for a European Parliament Resolution. Bruxelles: Committee on Women’s Rights and Gender Equality.
- European Parliament – Directorate-General for internal policies. (2016). Differences in men’s and women’s work, care and leisure time. Study for the FEMM committee, Bruxelles.
- European Parliament Committe of Regional Development. (2013, December 20th). Regualtion (EU) N. 1301/2013 of the European Parliament and of the Council of 17 December 2013 on the European Regional Development Fund and on specific provisions concerning the investment for growth and jobs goal and repealing Regulation (EC) No 1080/2006. Official Journal of the European Union. L. 347/289.
- European Trade Union Institute. (2012). Benchmarking Working Europe 2012. Brussels: Publisher ETUI.
- Eurostat. (2011). Regions in the European Union, Nomenclature of territorial units for statistics. NUTS 2010/EU-27, Luxembourg.
- Eurostat. (2013). Regions in the European Union. Nomenclature of territorial units for statistics. NUTS 2013/EU-28. Luxembourg: Author.
- Eurostat. (2017). Eurostat regional yearbook. Luxembourg: Publication Office of the European Union.
- Faina, A., & Lopez-Rodriguez, J. (2004). European regional policy and backward regions: Implications towards EU enlargement. European Journal of Law and Economics, 18, 5–32. doi:10.1023/B:EJLE.0000032768.08952.b6
- Federal Glass Ceiling Commission. (1995). Good for business: Making full use of the Nation’s Human Capital – A fact-finding Report of the Federal Glass Ceiling Commission. Washington, D.C.: U.S. Government Printing Office.
- Gibbs, J. P. (1965). Occupational differentiation of negroes and whites in the United States. Social Forces, 44(2), 159–165.
- Joint Research Centre. (2005). Tools for constructing composite indicators. prepared by Nardo M., Saisana M., Saltelli A. & Tarantola S., EUR 21682, Ispra (VA), Italy.
- Markaki, Y., & Longhi, S. (2013). What determines attitudes to immigration in European countries? An analysis at the regional level. Migration Studies, 1(3), 311–337. doi:10.1093/migration/mnt015
- Mazziotta, M., & Pareto, A. (2016). On a generalized non-compensatory composite index for measuring socio-economic phenomena. Social Indicators Research, 127(3), 983–1003. doi:10.1007/s11205-015-0998-2
- Munda, G. (2016). Multiple criteria decision analysis and sustainable development. In S. Greco, M. Ehrgott, & J. R. Figueira (Eds.), Multiple criteria decision analysis, state of the art survey (II edn.) (pp. 953-986). Berlin: Springer.
- Murillo, H., Ramos, R., & Hipólito, S. (2017). Regional differences in the gender wage gap in Spain. Social Indicator Research is a Review (Springer ed.), 134(3), 981-1008. doi:10.1007/s11205-016-1461-8
- Oaxaca, R. (1973). Male-female wages differentials in urban labor markets. International Economic Review, 14(3), 693–709. doi:10.2307/2525981
- OECD. (2004, May). Female labour force participation: Past trends and main determinants in OECD countries. Paris: Author.
- OECD. (2016). Regional outlook. Paris: Author.
- Olivetti, P. (2008, May–June). Gender and the labour market: An international perspective and the case of Italy. Rivista di Politica economica, 3–32.
- Parker, S. C. (2004). The economics of self-employment and entrepreneurship. Cambridge: Cambridge University Press.
- Quintano, C., Castellano, R., & Rocca, A. (2010). Male-female discrimination: An analysis of gender gap and its determinants. Statistica, Bologna, 70(2), 171–190.
- Saisana, M., d’Hombres, B., & Saltelli, A. (2011). Rickety numbers: Volatility of university rankings and policy implications. Research Policy, 40, 165–177. doi:10.1016/j.respol.2010.09.003
- Shankar, R., & Shah, A. (2003). Bridging the economic divide within countries: A scorecard on the performance of regional policies in reducing regional income disparities. World Development, 31(8), 1421–1441. doi:10.1016/S0305-750X(03)00098-6
- Shrivastava, R. P., & Tiwari, A. K. (2014). Gender differences in labour productivity & earnings and structure of employment. Journal of Economic & Social Development, 10(1), 127–130.
- United Nations (2011, February 16–18). Inter-Agency Network on Women and Gender Equality, Report of the Tenth Session of the Inter-Agency Network on Women and Gender Equality ( IANWGE/2011/Report). New York, NY.
- Vincent, C. (2013, September). Why do women earn less than men? A synthesis of findings from Canadian microdata. Hamilton: CRDCN (Canadian Research Data Centre Network) Synthesis Series.
- Watts, M. (1998). Occupational gender segregation: Index measurement and econometric modeling. Demography, 35(4), 489–496. doi:10.2307/3004016
- World Bank. (2012). World development report, gender equality and development. Washington, DC: Author.