
 ?Mathematical formulae have been encoded as MathML and are displayed in this HTML version using MathJax in order to improve their display. Uncheck the box to turn MathJax off. This feature requires Javascript. Click on a formula to zoom.
Abstract
Determinants of market channel choice are the contributing issues that influence production and sales. Despite their significance, yet adequate research has not been carried out on it, particularly in the North West Province, South Africa. Consequently, this paper assessed the socio-economic profile and the determinants of the choices of market channel utilized by Maize and Sunflower farmers in the North West Province, South Africa. A semi-structured questionnaire was used to interview 163 respondents categorized according to those who were financially assisted (n = 101) and those who were not (n = 62). The choice of Market channels utilized by respondents was then analyzed using a Multinomial Logit Regression Model with Non-market participation as a reference category. Overall, the finding demonstrated that most respondents (65%) were utilizing informal markets, followed by non-market participation and formal markets with 20% and 15% respectively. The findings emanated from the Multinomial Logit Regression analyses revealed that factors such as age, marital status, gender, credit access, education, and farming experience significantly influenced the choice of the market channel among maize and sunflowers farmers in the study area. Policies aimed at improving the farmers’ access to formal markets should be informed by these factors.
PUBLIC INTEREST STATEMENT
Accessibility to the market in agriculture is believed to be one of the main mechanisms for economic growth. The choice of market channel plays a significant role in making a huge difference in achieving production goals. Through access to different markets, underprivileged smallholder farmers are enabled to access inputs, credit, market their produce. South Africa as a developing country is generally characterized by the inefficiency of her marketing system where economic development and sustainable livelihood are negatively affected. However, smallholder farmers face a limitation to participate and benefit from high-value markets. Their inability to participate in high-value markets is currently a major concern. Thus, the study focusses on three marketing channels that are mostly used. Consequently, this paper assessed the socio-economic profile and the determinants of the choices of market channels utilized by Maize and Sunflower farmers in the North West Province, South Africa.
1. Introduction
It cannot be gainsaid that markets play a crucial role in sustainable agriculture because livelihoods of most of the world’s poor people depend on participating in markets as either workers or producers {Food and Agriculture Organisation (FAO), Citation2009}. Besides, market accessibility is believed to be the main transmission mechanism between growth in the wider economy and the lives of the poor {Department for International Development (DFID), Citation2005}. Following this, through access to different markets, underprivileged households are enabled to access inputs, credit, market their produce, access other consumption goods as well as learn about and adopt new technologies (FAO, Citation2009). However, perfect market conditions hardly exist in real life, particularly in developing countries. A marketing channel is defined as a set of interdependent organizations that help make a product available for use or consumption by the consumer or business user (Mansfield, Citation2003). Correspondingly, a marketing channel, according to Lake (Citation2007), is an organized network of agencies and institutions which in combination performs all the functions required to link producers with end customers to accomplish the marketing task. For the purpose of this study, there are three marketing channels mostly utilized by maize and sunflowers farmers in the study area. This includes informal markets; formal markets; and non-market participation.
Informal markets or Private sales provide the shortest and simplest distance between the farmer and the consumer, and as a result, it has become the most popular option, amongst smallholder farmers (Ferris et al., Citation2014). Through this option, smallholder farmers transact directly with the ultimate consumer (Nkosi & Kirsten, Citation1993). On-farm or direct sales to the consumer offer the greatest profit margin for the producer because all middle-men and their fees are eliminated. Besides informal market is a self-sufficient section of the economy producing mainly for consumption, and it is joined with the rest of the economy through harmonizing connections (Bairagya, Citation2010). These markets are also characterized by having no formal grades, no traceability, and a standard measure is rarely used. Prices are largely set through arbitrary combinations of supply, demand, and customer loyalties to specific sellers. Subsequently, informal markets sell mainly to low-income consumers, thus, the current level of participation of smallholder farmers in high-value markets is unsatisfactory (Baloyi, Citation2010). Furthermore, the average prices offered by supermarkets are significantly lower than informal market prices (Ferris et al., Citation2014). The main reason for the selection of this channel is that prices are negotiated on a willing-buyer, willing-seller relationship; and convenience with no added costs like transport or commissions (Fan & Rosegrant, Citation2008).
In contrast to informal markets, formal markets are more regulated as they operate using standard weights, measures and where transactions are agreed upon based on clearly defined legal frameworks (Ferris et al., Citation2014). These markets are characterized by modern value chain systems and can link more commercial smallholder farmers with larger commercial buyers. Farmers must comply with the stringent quality standard and regular volume requirements of formal buyers as well as be willing to accept that prices may be below those in informal markets. Hence, farmers may experience high transaction costs under such circumstances (Bahiigwa, Citation2006) and they often fail to meet market requirements such as high quality, quantity and product specifications. Formal market requirements for smallholder farmers require traceability of a product and adherence to a series of best practices for the production and handling of goods due to food safety standards. Lothore and Delmas (Citation2009), stipulated that farmers must agree to lower prices in exchange for longer-term buying arrangements access to services and social investments. Equally, Ferris et al. (Citation2014) asserted that higher volumes in formal markets require a greater level of organization of smallholder farmers through collective groups, association, and cooperatives to access specific services in order to maintain quality, quantity, and consistency.
Unlike the aforementioned markets, missing markets/Non-market participation refers to a great case of market failure. There is no access to the market for a particular commodity produced. Such a failure does not reflect the absence of a market but rather it can be household-specific which can relate to high transaction costs. It is, therefore, important that smallholder farmers are supported to revolutionize their operations in order to grow viable business enterprises that can generate enough income to sustain the needs of their households. Linking farmers to the market should, therefore, be a priority for any agricultural program that aims at poverty reduction. Lack of market access implies that the rural poor will remain isolated from participating in the national and global economies (DFID, Citation2005). Following this, it is most unlikely for them to commercialize without market accessibility.
South Africa as a developing country is generally characterized by the inefficiency of her marketing system. Thus, when farmers do not receive a reasonable return from the sale of their surplus production, they tend to produce at a subsistence level (Hendricks & Fraser, Citation2003). Majority of the smallholder farmers lack logistical infrastructure such as cold rooms and refrigerated transport to keep their produce in good quality for long-distance markets (Ngemntu, Citation2010); consequent upon that, distance to markets continue to affect the participation of smallholder farmers in mainstream markets negatively (Van Schalkwyk, Groenewald, Fraser, Obi, & Van Tilburg, Citation2012). To this end, the absence of contractual sale increases the risk that producers may not sell their goods at the right time due to lack of storage facilities, lack of refrigerated transportation and long distances to output markets.
Additionally, the prices they could have obtained for their goods were unknown, thus making it difficult to plan and project future cash flow and profitability (Cousins, Citation2005). This is attributed to various socio-economic and marketing challenges (Baloyi, Citation2010). Subsequently, these challenges make it difficult for smallholder farmers to explore full market potentials, thus reducing their eagerness to participate in high-value markets (Pote, Citation2008). Therefore, economic development and sustainable livelihood are negatively affected. Accordingly, one of the fundamental problems facing smallholder farmers in the study area is the limitation to participate and benefit from high-value markets. Farmers seem to have difficulties searching supermarkets to sell their produce, due to inadequate access to knowledge on the market, thus resulting in high information costs (Antwi & Seahlodi, Citation2011). The inability of smallholder farmers to participate in high-value markets is currently a major concern in South Africa.
Markets and improved market access for poor rural households are therefore a prerequisite for enhancing agriculture-based economic growth and increasing rural incomes. Ipso facto, access to different market channels for the poor is a crucial development matter that relates to addressing poverty and fairness because markets are not only an economic issue but are embedded in social, economic, and political institutions. Hence, in this study, market channels and factors that influence participation in such markets demand urgent and comprehensive examination.
Accordingly, the main objective of this research is to examine the determinants of market channel choices utilized by maize and sunflower farmers; while the specific objectives are as to: (i) analyze the socio-economic profile of the maize and sunflower farmers and (ii) determine existing market channels utilized by the farmers. The study is based on the following hypothesis:
Hnull: There is no statistically significant relationship between choice of market channel utilized by maize and sunflowers farmers and their socio-economic profile.
Halt: There is a statistically significant relationship between choice of market channel utilized by maize and sunflowers farmers and their socio-economic profile.
2. Methods
2.1. Study area
The study was conducted in the North West Province of South Africa. The province covers an area of approximately 116, 180 km2 which brings the population density to approximately 30 people per km2. The Statistics of South Africa’s (Stats SA, Citation2012) mid-year population estimate of 2006 puts the North West population at 3.858 million. The province is largely rural in nature and approximately 66% of its population lives in non-urban areas (Statistics South Africa, Citation2012). It is located in the north of the country on the Botswana border, fringed by the Kalahari Desert in the west, Gauteng Province to the east and Free State province to the south. The North West province was formed during the end of apartheid in 1994 and it includes part of the former Transvaal and Cape Province as well as most of the former Bantustan of Bophuthatswana. There are 4 districts and 21 local municipalities in the Province. These districts are Ngaka Modiri Molema, Bojanala, Dr. Kenneth Kaunda and Dr. Ruth Segomotsi Mompati. Ngaka Modiri Molema, Bojanala, and Dr. Kenneth Kaunda districts comprise 5 local municipalities per district and Dr. Ruth Segomotsi Mompati has 6 local municipalities (Department of Cooperative Governance, Citation2010).
2.2. Population and sample size
The department of agriculture, forestry and fisheries in the study area (DAFF) provided a list of two sub-groups crop farmers (maize and sunflower farmers)who are being financially assisted and those who are not (non-financially assisted). The list constituted the total population of 208 farmers in which 73 are non-financially assisted maize and sunflower farmers and 135 of financially assisted maize and sunflower farmers. Stratified random sampling techniques were used for this study. Following Oduniyi and Tekana (Citation2019), a Raosoft calculator was used to select a sample size of 62 and 101 farmers respectively from each sub-group (stratum).
2.3. Data collection method
A semi-structured logical questionnaire was developed based on the objectives of the study to collect data from the respondents. The questionnaire consisted of both open and closed-ended questions in which interview method was used in order to thoroughly explain the questions to respondents. The interviews were done face-to-face with respondents and this enables the collection of some information which was important but was not catered for in the questionnaire. The questionnaire was divided into six sections based on the study objectives. For the purpose of this study, the survey questionnaire was pilot tested on 5.0% randomly selected participants representing the crop farmers. A random proportionate by group sample of participants meeting the set criteria (n = 8) was selected. The sample group was then drawn from the intended target population. These participants were not included in the succeeding major study.
2.4. Methods of data analysis
Data collected were sorted, coded and analyzed using STATA 14.0. Before running the Multinomial Logit Regression analysis, Multicollinearity and Heteroskedasticity tests were first carried out. The variable inflator factors (VIF) test was used to check for Multicollinearity. This was done using VIF command in STATA 14. The results of the variance inflator factor show the mean of variance inflation factors (VIF) of 1.37 in which the average VIF was less than 10. Moreover, the test for Heteroskedasticity was also done using the Breusch-Pagan/Cook-Weisberg test for Heteroskedasticity using hettest command in STATA 14.0. The null hypothesis states that there is constant variance, meaning that—Ho: there is no presence of Heteroskedasticity. The standard condition to detect if Heteroskedasticity exists is based on P-value. That is if P-value < 0.05, the null hypothesis is rejected and the conclusion is that there is a presence of Heteroskedasticity and if P-value > 0.05, null hypothesis is accepted, thus, concluding that there is no presence of Heteroskedasticity. In this study, P-value was (P = 0.0621: P > 0.05). It is greater than 0.05, therefore, it was concluded that in the model, there was no presence of Heteroskedasticity. Descriptive statistics together with multinomial regression Logit regression were used to determine the objectives stated. The main descriptive indicators that were used were percentages, frequencies and mean values. The examination of the determinants of market channel choices utilized by respondents was done using Multinomial Logit Regression Model.
2.5. Multinomial logit regression model (MNLM)
The analytical approaches that are commonly used in an adoption decision study involving multiple choices are the multinomial logit (MNL) and multinomial probit (MNP) models. Both the MNL and MNP are important for analysing farmers’ decisions as these are usually made jointly (Hausman & Wise, Citation1978; Wu & Babcock, Citation1998). This study used a Multinomial Logit Model to examine determinants of market channel choices utilized by respondents because it is widely used in adoption decision studies involving multiple choices and is easier to compute than its alternative, the MNP. The advantage of using a MNL model is its computational simplicity in calculating the choice probabilities that are expressible in an analytical form (Tse, Citation1987). This model provides a convenient closed form for underlying choice probabilities, with no need for multivariate integration, making it simple to compute choice situations characterized by many alternatives. In addition, the computational burden of the MNL specification is made easier by its likelihood function, which is globally concave (Hausman & McFadden, Citation1984).
The process for formulating a Multinomial Logistic Regression model is similar to that of binary logistic regression (Dougherty, Citation1992). However, in binary logistic regression, the endogenous variable has two categories while Multinomial Logistic Regression has more than two categories. Thus, multinomial logistic regression is an extension of the binary logistic regression. According to Jari (Citation2009), the utility-maximizing function stipulates that it can be realized that farmers make choices to produce, consume and market as subjected to institutional and technical factors. Thus, choices to participate in either formal or informal markets or even not participating signify the direction which maximizes utility. With the given assumption, Multinomial Logit Regression model was used to relate the decisions to participate in formal markets, informal markets or not to participate and the factors that influence these choices.
The variable of non-market participation was used as the baseline or reference category; therefore, it took the value of zero (0). Informal market participation took the value of one (1) and formal market participation was coded as two (2). The multinomial model was used in this paper to determine the probabilities of both formal market participation versus non-market participation and informal market participation versus non-market participation. It follows that Pi represents the probability of not participating in the market and (1—Pi) represents the probability of either informal market participation or formal market participation in relation to non-market participation. The probability that the farmer prefers one market compared to the other was restricted to lie between zero and one (0 ≤ Pi ≤ 1). Hence, logit (Pi) ranges from negative infinity to positive infinity (Gujarati, Citation1992).
The multinomial logistic regression model used in the study is specified mathematically as shown below:
Let i A be a random variable representing the market channel chosen by any respondent. The assumption is that each farmer faces a set of discrete, mutually exclusive choices of market channels. These market channels are assumed to depend on a number of socio-economic characteristics and other factors X. The MNL model for choice of market channels specifies the following relationship between the probability of choosing option and the set of explanatory variables X as described by Greene (Citation2003):
Where is a vector of coefficients on each of the independent variables X. EquationEquation (1)
(1)
(1) could be normalized to remove indeterminacy in the model by assuming that the probabilities could be estimated as:
Estimating Equationequation (2)(2)
(2) yields the J log-odds ratios
3. Results and discussion
3.1. The demographic profile of farmers
The demographic profile analyzed and discussed includes gender, age, population group, educational level, and training received, farming experience, marital status, household size, and dependents. The analyses and discussions were grouped according to those who were financially assisted (n = 101) and those who were not (n = 62) as shown in Table . Considering the gender of financially assisted household head, Table shows that majority (80%) were males and 20% were females while the majority (72%) of non-financially assisted households were male and only 28% were females. This indicates that there were a greater proportion of males when compared with females. The small percentage of women among the respondents may be accredited to the general attitudes amongst Africans, South Africans in particular, that agriculture is for the male and women are expected to perform domestic activities in the households. This result is in line with that of Antwi and Oladele (Citation2013), which revealed that majority (54%) of the beneficiaries in the study of the performance of LRAD projects in Ngaka Modiri Molema were men and 46% were women. A report on community survey (Citation2016), validated that male-headed agricultural household is a larger proportion compared with the female counterpart. Table explained the definition and the variables used in the multinomial logit regression model.
Table 1. Sample size according to Raosoft calculator
Table 2. Definition and explanation variables used in the empirical multinomial logit regression model
Table 3. Demographic profile of respondents
The findings in Table present the educational background of farmers in the study area. Education is a necessary tool in enhancing sustainable economy and livelihood. Thus, investment in education and training is important as it is widely believed that the educational level of farmers will improve their information-seeking behavior, and adoption of agricultural innovation (Tekana & Oladele, Citation2011). In this study, the findings indicate that majority of financially assisted farmers (54%) had no education, followed by 20% of the respondents who had primary education; 16% attended tertiary institutions, while 10% studied up to the secondary level. Also, for non-financially assisted farmers, the results show that 25% had no education, followed by 23% with primary level, 52% secondary education and no one with tertiary educational qualification. Oni, Oladele, and Oyewole (Citation2005), stated that literate farmers are most likely to accept innovations than illiterate farmers thereby, enhancing their productivity and better their farms’ returns. This heightens the importance to increase the literacy level of smallholder farmers so that they advance their farming knowledge which will assist them to make more informed decisions.
Furthermore, in relation to the training received, the findings depict the percentage distribution of training provided to the farmers. It evinces that (90%) financially assisted farmers have been trained before and most (98%) of non-financially assisted farmers never got any training. Table below also presents general farming experience among respondents. The number of years spent in farming may serve as a measure of farming experience and as a direct indicator of production knowledge and individual expertise to some extent. The results revealed that most (85%) financially assisted respondents had five or more years of experience and 77% for non-financially assisted respondents. This clearly shows that respondents are experienced farmers. This is not farfetched from the fact that most farmers are above 50 years which could have ensued into more farming experience.
With regards to marital status, result from Table shows that the majority (70%) of financially assisted farmers were married while 61.4% of non-financially assisted farmers were married. The high percentage of married people can be accredited to the fact that most respondents were family-oriented and old people. The marital status of farmers could be viewed as a true reflection of their age groups. With regard to household size and number of dependents among the respondents, Table explains that majority (75%) of financially assisted respondents had more than three household size and 25% had three or less household size. Furthermore, the findings revealed that most (69%) financially assisted respondents had more than three household members who depend on them while 31% had three or less household size members who depend on them. These findings clearly evidenced that the bigger household size does not automatically means that all members depend on the household head for survival.
3.2. Kernel density graph of age distribution among respondents
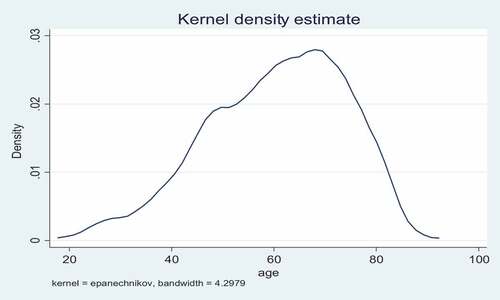
As presented in the previous section, the results demonstrated that most (71%) financially assisted respondents were above 50 years and the least (5%) were below 35 years while the majority (80%) for non-financially assisted respondents were also above 50 years and only 6% were below age 35. This could endanger sustainable agricultural production and food security as there are very few young people in the study area who are involved in agriculture. It is assumed that this sector needs energetic and able-bodied who can farm effectively to promote food insecurity. These findings clearly indicate that majority of the respondents are old and very little has been achieved in terms of attracting the youth into agricultural programs. The small percentage of young people participating in agriculture may be attributed to their perception that agricultural related projects are for old people. This discovery tallies with Anyanwu’s (Citation1992) submission, who avowed also that younger people have no interest in agricultural activities. Hence, most of them within rural areas or farms flock to big cities in South Africa to look for better lives and jobs that will suit and sustain their livelihood. In all, the youngest sampled respondent was 22 and the oldest was 88 years of age. The Kernel density graph of age distribution among respondents with the overall mean and overall standard deviation of 13.22658 (60.47853) is presented in Figure below.
Figure 1. Kernel density graph of age distribution among farmers.
3.3. Market channel choices utilized by farmers
The results presented in Table below indicate findings of market channel utilized by farmers. The results were categorized into financial assisted, not financial assisted and overall. Likewise, regarding those who were financially assisted, the findings indicate that most (65%) of the farmers were using informal markets, followed by formal markets, which attracted 27% and 8% of the respondents for non-market participation. For those who were not financially assisted, the result indicates that the majority, that is, 65% were using informal markets followed by formal markets (28%) and no-market participation (7%). Overall, the findings indicate that most (65%) farmers were utilizing informal markets, followed by formal markets (20%) and non-market participation (15%). These findings clearly indicate that there is still a serious problem with respect to beneficiaries accessing most rewarding output markets as very few of them were utilizing formal markets to sell their produce. In terms of informal markets, this finding supports Nkhori (Citation2004), who affirmed that informal marketing is a common practice to smallholder farmers as they are in a position to determine their own prices and incur low marketing costs. Informal markets are, therefore, the cheapest and most probably the simplest form of market outlet. Factors influencing marketing channel choice decision among respondents through Multinomial Logit Model regression is presented and discussed in the following section.
Table 4. Market channel utilized by beneficiaries
3.4. Multinomial logit regression modeling
The results as presented in Table show factors influencing marketing channel choice decision among respondents using Multinomial Logit Model regression. In the model, marketing channels were grouped into three categories or outcomes depending on the number of channels that respondents were utilizing in the study area. These channels were: (1) informal market, (2) formal market, and (3) non—market participation, which was used as a base or reference category. The results were explained or discussed using RRR- Risk Relative Ratio which explains the likelihood of choosing one market over the other (base or reference category). In the unadjusted model where no variables were kept constant, with regards to household residing closer or otherwise, the results illustrate that residing closer to farm- premises positively influenced the likelihood of participation in informal markets by (RRR = 10.614; 95 CI {0.684-164} P > 0.1). Relying on the informal markets is considered as a shortcoming and a setback as it negatively affects proper planning and accurate projections as there are no guarantees of getting a buyer at the right time (Antwi & Nxumalo, Citation2014).
Table 5. Result from the multinomial logit regression model
When comparing formal markets to non- market participation as a base outcome, the results show that one unit increase in farming experience reduces the likelihood of participating in formal markets by (RRR = 0.904; 95% CI{0.840–0.973}, P > 0.05). The reason for decrease in participation in formal participation as the number of years increase may be attributed to the fact that as the years in farming experience increases, the farmers’ age increases as well and farmers are most likely to lack the energy and interest in the activities related to formal market such as attending workshops; organizational memberships and adhering to product specifications. This finding is in line with that of Antwi and Nxumalo (Citation2014), which revealed a negative relationship between farming experience and participation of Smallholder farmers’ in the mainstream markets. This may be due to the fact that old people get tired quicker than young ones; they are also more vulnerable to diseases than their counterparts; they may also be reluctant to adopt new technology and cannot cope with challenges of drudgery work associated with farming. On the same, one unit increase in the distance to output markets reflect the less likelihood that respondent will participate in formal markets by (RRR = 0.979; 95% CI {0.960–0.998}, P > 0.05). Distance to the market negatively influences both the household’s decision to participate in the market and the intensity of participation. The further the distance to the market, the higher the transportation costs and the lower the net benefit to the household (Omiti, Otieno, Nyanamba, & McCullough, Citation2009). Furthermore, distance to market increases the cost of inputs, transportation costs, and reduces the effective price farmers receive for their outputs or produce (Buckmaster, Citation2012).
However, in the adjusted model where other variables were kept constant, a unit increase in farming experience reduces the likelihood of respondents participating in informal markets (RRR = 0.778; 95% CI {0.660–0.916} P > 0.05). This implies that one unit increase in farmers experiences decreases the Risk Relative Ratio of participating in informal markets as compared to non—market participation as a reference category. The more experienced respondents became lead to better awareness of shortcomings related to informal markets as postulated by Antwi and Nxumalo (Citation2014), such as negative effects towards proper planning and accurate projections. Contrariwise, residing closer to farm premises positively influenced participation in informal markets by (RRR = 15.514; 95% CI {0.826–291.441} P > 0.1). This could be attributed to a lack of opportunities for formal markets leading to producers utilizing the readily available markets as they lack storage facilities.
Furthermore, gender of respondents negatively influenced participation in informal markets by (RRR = 0.152; 95% CI {0.042–0.558} P > 0.05). On the same, educational level of farmers indicate a less likelihood of informal market participation by (RRR = 0.417; 95% CI {0.219–0.792} P > 0.05). The negative relationship between educational level and participation in informal markets could be attributed to the fact that when farmers are educated, they become aware of the value of their produce, thus; their likelihood to participate in informal markets is reduced. This enhances the importance to increase the literacy level of the respondents so that they advance their farming knowledge which will ultimately assist them to make more informed decisions. However, marital status and age of respondents revealed an increased likelihood of participating in informal markets by (RRR = 2.287; 95% CI {1.337–3.914} P > 0.05) and (RRR = 1.061; 95% CI {1.015–1.108} P > 0.05) respectively. Contrariwise, this is not in line with Musemwa et al. (Citation2007), who found that the older the farmer, the more they run away from selling their produce in the markets. Nonetheless, this finding contradicts that of Arega et al. (Citation2007), who alluded that market participation declines with age, indicating that older farmers are risk-averse and reluctant to adopt technology and hence inability to produce for the market, dominate the expected greater market contacts and trust that would allow them to trade at lower costs.
Moreover, when comparing formal markets to non-market participation under adjusted model where other variables were kept constant, gender and educational level of respondents portrays a decreased likelihood of participating in formal market by (RRR = 0.149; 95% CI {0.002–0.093} P > 0.01) and (RR = 0.380; 95% CI {0.189–0.768} P > 0.01) respectively. The negative relationship between educational level and participation in a formal market could be attributed to the fact that when farmers are educated, they became aware of the value of their produce, as a result of their likelihood to participate in informal markets is reduced as they do not have an influence on the price of their produce. Contrariwise, marital status and age of respondents indicate an improved likelihood of participating in formal markets by (RRR = 2.253; 95% CI {1.155–4.794} P > 0.05) and (RRR = 1.065; 95% CI {1.006–1.126} P > 0.05) respectively as compared to non—market participation as a reference category. This implies that the more the married couples among respondents, the more it lead to improved likelihood to participate in formal markets as compared to non—market participation. The positive relationship between marital status and participation in formal markets could be attributed to the assistance a farmer can get from his or her partner such as advantages associated with formal markets. Moreover, the positive relationship between age and participation in formal markets could be due to the farming experience.
3.5. Factors influencing the choice of the market channel in the study area
Table below capture the results of factors influencing marketing channel choice decision among respondents: the interaction models. The factors include age, marital status, gender, credit access, education, and farming experience. Marital status was found statistically significant in this study. The reason could be as a married household head, the farmer gets support from his/her partner which could be in the form of advice, financial assistance, age, education or experience which influence the decision on the choice of market utilisation and market participate. This result was supported by Egbetokun and Omonona (Citation2012), who reported that marital status is one of the major determining factors influencing farmer’s choice and participation in the market. Ataul and Elias (Citation2015), in their review also pointed out the same fact.
Table 6. The results from the multinomial logit regression model: The interaction models
In the unadjusted model, the findings indicate that one unit of increase in farming experience reflects a reduction on the likelihood to participate in informal markets (RRR = 0.911; 95% CI {0.842–0.986} P > 0.01). Still under the unadjusted model, when comparing formal markets to non-market participation, the results point out that farm experience reflects a reduced likelihood to participate in formal markets (RRR = 0.921; 95% CI {0.852–0.996} P > 0.01). In the adjusted model where other variables were kept constant, farming experience indicates a negative influence on the participation likelihood ratio. This implies that a unit increases on farming experience reduces the likelihood to participate in formal markets (by RRR = 0.895; 95% CI {0.809–0.989} P > 0.05). This implies that as the number of years in the farming increase, participation in formal markets decreases. This may be ascribed to lack of energy and interest in the activities related to formal markets such as attending workshops; organizational memberships and adhering to required specifications as the years in the farming increase. This is supported by Kirui, Mutai, Kibet, Kibet, and Macharia (Citation2016), who affirmed that an increase in farming years decreases farmers’ decision to participate. Farming experience had a negative effect on farmers’ decision to participate in a choice of marketing channel.
Moreover, the educational level among respondents also reflects a reduced likelihood to participate in formal markets (RRR = 0.482; CI {0.345-0674} P > 0.01). This relationship implies that as the educational level of farmers increases, their participation in formal markets decreases. The result follows Jari (Citation2009), who explained that educational levels affect the interpretation of market information and choice, thus, this influence the level of participation and the choice of the market channel. Still, the research portrays that education has an implication on the ability to understand and interpret extension information received by an individual. The age of the farmers was statistically significant to the choice of market utilised. This is result agreed with Barrett (Citation2007), who reported that younger farmers are more receptive to new ideas and are less risk-averse. According to Arega et al. (Citation2007), market participation and choice of market utilisation declines with age. These indicate the characteristic of older farmers such as reluctance to adopt new technology, risk aversion and long trust with the buyer that would enable them to trade at lower transaction cost.
Furthermore, credit access reflects an increased likelihood to participate in formal markets (RRR = 3.384; CI {1.414–8.094} P > 0.1). This may be attributed to the fact that credit access can be of great assistance in terms adhering to required specifications or standards. However, when comparing formal markets and non-market participation as a base category, credit access among respondents reflect an increased likelihood of participation in formal markets (by RRR = 3.662; 95 CI {1.115 − 12.023} P > 0.05). This may be attributed to the fact that credit access may allow farmers to buy inputs, labor payments, improving both quantity and quality of the produce as well as adhering to required specifications or standards. On the word of Copestake et al. (Citation2010), credit can influence the incomes of households through other means than income and consumption patterns, and this includes social, political and economic variables such as profits, asset accumulation, health, and nutrition. Contrariwise, Siyoum, Hilhorst, and Pankhurst (Citation2012), maintained that credit has a negative impact on the creation of household wealth in that poor households are forced to sell their livestock and other assets in an effort to repay their loans.
Equally, as regards the Gender perspective, when examining the training received by women only, the results evidenced an increased likelihood of participation in formal markets (by RRR = 33.117; 95% CI {3.503–313.133} P > 0.05). Kirui et al. (Citation2016), reported that gender characterizes the differences in market orientation between male and female household heads. In their study, it was revealed that the gender of the household head significantly and positively affected the choice of marketing channel and participation. Additionally, regarding the scrutiny of the educational level of women only, the finding indicates an improved likelihood of participating in formal markets (by RRR = 1.089; 95% CI {1.002–1.183} P > 0.05). This implies that a unit increase in women’s level of education improves the likelihood of formal market participation when compared with non-market participation as a reference category. Formal education enhances managerial competence and successful implementation of improved production, processing and marketing practices (Marenya & Barrett, Citation2007). Also, a study by Reyes et al. (Citation2012), revealed that male-headed household was richer than their counterparts.
4. Conclusion and recommendations
The contribution of the study is to provide an understanding as to what factors need to be addressed to encourage and boost Maize and Sunflower farmers in the study area. The findings discovered from the study clearly indicate that most maize and sunflowers farmers (65%) were utilizing informal markets, followed by non-market participation and formal markets with 20% and 15% respectively. Besides, these findings are authentic evidence that there is still a serious problem with respect to farmers accessing most rewarding output markets; this observation is buttressed with the fact that very few (15%) of them had contracts to sell their produce. Subsequently, based on the findings of the study, the following recommendations are made:
Education and training should be provided to the farmers to enhance the knowledge and promote information regarding the decision and choice of market utilisation.
More youth and women should be encouraged to participate in agriculture. This will assist in training young people with farming skills when they are still young, energetic and promote market channels.
The government needs to assist farmers to find established markets so that they do not rely on auctions and selling of produce to surrounding communities. This will help them get value for money of their produce.
Access to credit support programs should benefit all farmers. Grants should also be initiated to assist farmers.
Declaration of Interest Statement
Authors declare there is no conflict of interest.
Correction
This article has been republished with minor changes. These changes do not impact the academic content of the article.
Additional information
Funding
Notes on contributors
K. K. S. Nxumalo
Dr. K. K. S. Nxumalo Nxumalo is an agricultural economist, and a lecturer at the North West University of South Africa.
O. S. Oduniyi
Dr. O. S. Oduniyi is an agricultural economist, a post-doctoral research fellow at the University of South Africa.
M. A. Antwi
Dr. S. S. Tekana is a Senior Lecturer at the University of South Africa. She has a vast university teaching experience that spans over fifteen years.
S. S. Tekana
Prof M. A. Antwi is an Agricultural Economist, with more than twenty-two years of experience in research and lecturing. He is a member and the Chair of the General Ethics Committee of the College of Agriculture & Environmental Sciences (CAES).
Related Research Data
References
- Antwi, M., & Nxumalo, K. K. S. (2014). Impact of Proactive Land Acquisition Strategy (PLAS) projects on human capital livelihood of beneficiaries in the Dr. Kenneth Kaunda district in South Africa. Journal of human ergology 44(2), 161–9.
- Antwi, M., & Seahlodi, P. (2011). Marketing constraints facing emerging small-scale pig farmers in Gauteng province, South Africa. Journal of Human Ecology, 36(1), 37–18. doi:10.1080/09709274.2011.11906415
- Antwi, M. A., & Oladele, O. I. (2013). Impact of the Land Redistribution for Agricultural Development (LRAD) projects on livelihoods of beneficiaries in Ngaka Modiri Molema district, South Africa. Journal of Human Ecology, 42(3), 273–281. doi:10.1080/09709274.2013.11906601
- Anyanwu, C. (1992). Community development. The Nigerian perspective. Ibadan: Gabesther Educational Publishers.
- Arega, D. A., Manyong, V. M., Omanya, G., Mignouna, H. D., Bokanga, M., & Odhiambo, G. (2007). Smallholder market participation under transactions cost: Maize supply and fertilizer demand in Kenya. Journal on Food Policy, 33(2008), 318–328.
- Ataul, G. O., & Elias, H. (2015). Market participation decision of smallholder farmers and its determinants in Bangladesh. A review. Economics of Agriculture, 62(1), 163–179.
- Bahiigwa, G. (2006). Access of Eastern African farmers to domestic and international markets: Opportunities and constraints. In Invited paper prepared for presentation at the International Association of Agricultural Economists Conference. Gold Coast, Australia.
- Bairagya, I. (2010). Liberalization, informal sector and formal-informal sectors’ relationship: A study of India.
- Baloyi, J. K. (2010). An analysis of constraints facing smallholder farmers in the agribusiness value chain: A case study of farmers in the Limpopo province (A Doctoral dissertation). University of Pretoria.
- Barrett, C. B. (2007). Smallholder market participation: Concepts and evidence from eastern and southern Africa. Prepared for FAO workshop on Staple Food Trade and Market Policy Options for Promoting Development in Eastern and Southern Africa, Rome, March 1–2, 2007. Food Policy, 33(4), 299–317. doi:10.1016/j.foodpol.2007.10.005
- Buckmaster, A. D. (2012). Going the distance: The impact of distance to market on smallholders crop and technology choices. (Virginia Tech, Doctoral dissertation).
- Community Survey. (2016). Statistical release p0301 / statistics south africa. Pretoria: Statistics South Africa.
- Copestake, J., Duvendack, M., Hooper, L., Loke, Y., Palmer-Jones, R., & Rao, R. (2010). What is the Evidence of the Impact of Micro-credit on the Incomes of Poor People? School of International Development, University of East Anglia.
- Cousins, B. (2005). Agrarian Reform and “two economies”: Transforming South Africa’s country side. Programme for land and agrarian studies, School of Government, University of the Western Cape.
- Department of Cooperative Governance. (2010). Municipalities of the Republic of South Africa.
- DFID. (2005). Making Market Systems Work Better for the Poor (M4P) An introduction to the concept Discussion paper prepared for the ADB-DFID ‘learning event’ ADB Headquarters, http://www.urbanlandmark.org.za/downloads/DFID_M4P_An_introduction_to_the_concept.pdf
- Dougherty, C. (1992). Introduction to econometrics. Oxford University Press.
- Egbetokun, O. A., & Omonona, B. T. (2012). Determinants of Farmers’ Participation in Food Market in Ogun State. Global Journal of Science Frontier Research Agriculture and Veterinary Sciences, 12(9, Version 1.0), 24–30.
- Fan, S. A., & Rosegrant, M. W. (2008). Investing in agriculture to overcome the world food crisis and reduce poverty and hunger. Washington, DC: IFPRI (International Food Policy Research Institute).
- Ferris, S., Robbins, P., Best, R., Seville, D., Buxton, A., Shriver, J., & Wei, E. (2014). Linking smallholder farmers to markets and the implications for extension and advisory services. MEAS Brief, 4(10), 13–14.
- Food and Agriculture Organization. (2009). FAOSTAT online database. Retrieved from http://faostat.fao.org 201620.
- Greene, W. (2003). Econometric analysis (5th ed.). Englewood Cliffs: Prentice Hall.
- Gujarati, D. (1992). Essentials of Econometrics. New York: MacGraw–Hill.
- Hausman, J., & McFadden, D. (1984). Specification tests for the multinomial logit model. Econometrica: Journal of the Econometric Society, 52, 1219–1240. doi:10.2307/1910997
- Hausman, J. A., & Wise, D. A. (1978). A conditional probit model for qualitative choice: Discrete decisions recognizing interdependence and heterogeneous preferences. Econometrica: Journal of the Econometric Society, 46, 403–426. doi:10.2307/1913909
- Hendricks, F., & Fraser, G. (2003). Obstacles to agricultural development in the communal areas of the Eastern Cape. A report for the Eastern Cape provincial growth and development plan, http://www.fao.Org/ag/AGP/agpc/doc/Counprof/southafrica/southafrica
- Jari, B. (2009). Institutional and technical factors influencing agricultural marketing channel choices amongst smallholder and emerging farmers in the Kat River Valley (MSc Agricultural Economics thesis), University of Fort Hare, South Africa.
- Kirui, H., Mutai, K. B., Kibet, K. L., Kibet, R. P., & Macharia, A. (2016). Determinants of Tea Marketing Channel Choice and Sales Intensity among Smallholder Farmers in Kericho District, Kenya. Journal of Economics and Sustainable Development, 7(7), 107 – 114.
- Lake, L. (2007). Marketing distribution. Retrieved from http://marketing.about.com/mbiopage.htm
- Lothore, A. Y., & Delmas, P. (2009). Accès au marché et commercialisation de produits agricoles: Valorisation d’initiatives de producteurs. Inter-réseaux Développent Rural, 1–178.
- Mansfield, B. (2003). Fish, factory trawlers, and imitation crab: The nature of quality in the seafood industry. Journal of Rural Studies, 19(1), 9–21. doi:10.1016/S0743-0167(02)00036-0
- Marenya, P. P., & Barrett, C. B. (2007). Household-level determinants of adoption of improved natural resources management practices among smallholder farmers in western Kenya. Food Policy, 32(4), 515–536. doi:10.1016/j.foodpol.2006.10.002
- Musemwa, L., Chagwiza, C., Sikuka, W., Fraser, G., Chimonyo, M., & Mzileni, N. (2007). Analysis of cattle marketing channels used by small scale farmers in the Eastern cape province, South Africa. Livest. Res. Rur. Dev, 19(9).
- Ngemntu, S. T. (2010). An investigation of the production and marketing challenges faced by smallholder farmers in Amahlathi municipality: A case study of Zanyokwe irrigation scheme and Silwindlala woman’s project (Doctoral dissertation). University of Fort Hare. https://core.ac.uk/download/pdf/145053379.pdf
- Nkhori, P. A. (2004). The impact of transaction costs on the choice of cattle markets in Mahalapye district (Doctoral dissertation). University of Pretoria, Botswana.
- Nkosi, S. A., & Kirsten, J. F. (1993). The marketing of livestock in south africa’s developing areas: A case study of the role of speculators, auctioneers, butchers and private buyers in lebowa/die bemarking van lewende hawe in die minder-ontwikkelde gebiede van Suid-Afrika:’n Gevallestudie van die rol van veespekulante, afslaers, slagters en privaat kopers in Lebowa. Agrekon, 32(4), 230–237.
- Oduniyi, O. S., & Tekana, S. S. (2019). Adoption of agroforestry practices and climate change mitigation strategies in North West province of South Africa. International Journal of Climate Change Strategies and Management, 11(5), 716–729. doi:10.1108/IJCCSM-02-2019-0009
- Omiti, J., Otieno, D., Nyanamba, T., & McCullough, E. (2009). Factors influencing the intensity of market participation by smallholder farmers: A case study of rural and peri-urban areas of Kenya. African Journal of Agricultural and Resource Economics, 3(1), 57–82.
- Oni, O. A., Oladele, O. I., & Oyewole, I. K. (2005). Analysis of factors influencing loan default among poultry farmers in Ogun State, Nigeria. Journal of Central European Agriculture, 6(4), 619–624.
- Pote, P. P. T. (2008). Technical constraints to smallholder agriculture: Case study of Nkonkobe municipality (Doctoral dissertation). University of Fort Hare: Eastern Cape, South Africa.
- Reyes, M. R., Brackett, M. A., Rivers, S. E., White, M., & Salovey, P. (2012). The emotional climate of learning: Links to academic achievement. Journal of Educational Psychology. Advance online publication. doi:10.1037/a0027268
- Siyoum, A. D., Hilhorst, D. J. M., & Pankhurst, A. S. A. (2012). The differential impact of microcredit on rural livelihoods: Case study from Ethiopia. International Journal of Development and Sustainability, 1(3), 1–19.
- Statistics South Africa. (2012). Statistical release P0301.4, Census 2011. Embargoed until: 30 October 2012 10:00. Pretoria: Author.
- Tekana, S. S., & Oladele, O. I. (2011). Impact analysis of taung irrigation scheme on household welfare among farmers in North West Province, South Africa. Journal of Human Ecology, 36(1), 69–77. doi:10.1080/09709274.2011.11906419
- Tse, Y. K. (1987). A diagnostic test for the multinomial logit model. Journal of Business and Economic Statistics, 5(2), 283–286.
- Van Schalkwyk, H. D., Groenewald, J. A., Fraser, G. C., Obi, A., & Van Tilburg, A. (2012). Unlocking markets to smallholders: Lessons from South Africa (Vol. 10, pp. 35–58). Wageningen: Springer Science & Business Media, Wageningen Academic Publishers.
- Wu, J., & Babcock, B. A. (1998). The choice of tillage, rotation, and soil testing practices: Economic and environmental implications. American Journal of Agricultural Economics, 80(3), 494–511. doi:10.2307/1244552