
 ?Mathematical formulae have been encoded as MathML and are displayed in this HTML version using MathJax in order to improve their display. Uncheck the box to turn MathJax off. This feature requires Javascript. Click on a formula to zoom.
Abstract
Ambiguity over the effectiveness of agricultural intervention is more pronounced in rural areas where the majority of North West Nigeria’s poor population, and those involved in agriculture, reside. Further characterising these areas is the paucity of research on the issue of differentiation within the smallholder community. Specifically, definite classification of households based on efficiency, food security and income status remains inadequate. The study explores smallholder households’ differentials on the basis of these three phenomena, and other factors that affect smallholder typologies. Data was collected from 306 randomly selected smallholders involved in the Middle Rima Valley Irrigation Project, Sokoto State, Nigeria. Smallholders’ technical efficiency and households’ Food Consumption Score (FCS) were assessed. Also, Pearson correlation analysis, a segmentation approach using cluster analysis and multinomial regression model were used for the study. The study showed that the mean efficiency level of smallholder farms was 85.9% and that the majority of the households were food insecure. It also established a significant positive relationship between efficiency, income and food security status, and some degree of class stratification among the households. Differences in household characteristics determine variation in the efficiency, food security and income of households. Farm size, farming experience and diversification were major factors influencing households’ livelihoods. Recommendations emanating from the study include an increased focus on improving human capital, sustainable intensification and livelihoods diversification.
PUBLIC INTEREST STATEMENT
Many policies drawn up to assist smallholder households invariably consider them as a homogenous group. Quite often, there is no reference in research to the differing characteristics of smallholder households which, regrettably, takes its toll on the effectiveness of policies. The study attempts a differentiation of smallholder households of the Middle Rima Valley Irrigation Project in Nigeria, based on their efficiency, food security and income status. It also unpacks the relationship between these three phenomena and other farming and socio-economic characteristics of these households. Findings revealed that smallholder households are indeed heterogeneous as there are five distinct classes of smallholders based on these phenomena. The marked differentiation is further influenced by other factors that are not uniformly distributed among households which are years of experience, farmer training, farm size and diversification of livelihoods. Indeed, the foregoing have implications for how policies are formulated. The study concludes that to ensure better targeting of interventions, classification of households based on certain characteristics is imperative.
1. Introduction
An enduring narrative about agriculture is its present and potential contribution to global development. Over the years, focus has increasingly been on the interplay between agricultural productivity, food security and poverty. The eradication of poverty and hunger stands as a major thrust of the Sustainable Development Goals (SDGs) adopted by nations of the world in 2015. A main target of Goal 1, which aims at ending poverty in all forms globally, focused on the eradication of extreme poverty for all people everywhere by 2030. Also, Goal 2 seeks to end hunger, achieve food security and adequate nutrition for all, and promote sustainable agriculture. The first two targets of Goal 2 aim to eliminate hunger and all forms of malnutrition while ensuring food access for all people, particularly the poor and vulnerable. The association between agricultural productivity and income is laid bare in target 2.3 which aims to double the agricultural productivity and incomes of smallholders by 2030 (Food and Agricultural Organization (FAO), Citation2017). Therefore, meeting these objectives requires that adequate attention be paid to agriculture, owing to its relevance to socio-economic transformation.
As in most developing nations, the incidence of poverty and food insecurity in Nigeria is more of a rural phenomenon. The incidence of food poverty in rural Nigeria and urban Nigeria in 2010 was 48.3% and 26.7% respectively while the absolute poverty incidence in rural Nigeria was 66.1% compared to 52% in urban Nigeria (Anyanwu, Citation2014, p. 4). Evidently, the most impoverished people in Nigeria are found in agriculture, since the majority of the rural populace are involved in agriculture characterised by poor output (Kuku-Shittu et al., Citation2013; Oyelade & Anwanane, Citation2013). Also, the relationship between poverty and food insecurity in Nigeria is exemplified by the fact that about 29% of households found in the poorest wealth quintiles have unacceptable diet levels compared to 15% among the wealthiest quintiles (Kuku-Shittu et al., Citation2013).
Despite studies on food security at the household level in Nigeria, Akerele et al. (Citation2013) advocate for a more in-depth assessment of household food security to inform policy and programme decisions. However, this would be incomplete without due consideration of the income and poverty status, as well as economic activities of households. It is indeed expedient to lay the emphasis on a holistic approach that enhances the productive and economic capacities of smallholders, towards ways of collectively improving their efficiency in production, income and food security status. For smallholder households therefore, an examination of the interplay between efficiency, food security and poverty is imperative for more robust interventions. While acknowledging that these are three different but interrelated phenomena, addressing multiple policy objectives simultaneously requires that policy combinations are optimally designed, to guarantee that all objectives are met without one (policy) solution affecting the other (Babu & Sanyal, Citation2009). The application of a cluster analysis will no doubt assist in offering insights into the complexities and interrelated nature of phenomena, thereby providing the basis for policy-makers to better design solutions that take such complexities and interconnectedness into account (Babu & Sanyal, Citation2009).
This study therefore attempts a taxonomy of smallholder households of Middle Rima Valley Irrigation Project, Nigeria, based on their technical efficiency, income and food security status using a cluster analysis. The project is situated within the Goronyo and Gada Local Government Areas of Sokoto State. It is a predominantly rural agricultural area with significant socio-economic issues. This has necessitated the implementation of interventions such as the irrigation project. Nevertheless, it is important that policies and interventions are designed to achieve optimal results, hence this research. Following Babu and Sanyal (Citation2009), the aim is first to find an optimal grouping of observations on efficiency, food security and income that are similar in a cluster, but dissimilar to observations in other clusters. The paper further tests the hypothesis that the classifications are affected by other farming and socio-economic characteristics.
The rest of the paper is organised as follows: In the next section, we present an overview of the linkages between agricultural production, poverty and food security. We then highlight the concept of differentiation as it relates to the political economy of agriculture. This is followed by the description of the research methods. Next, we undertake an empirical analysis of the datasets to meet the objectives of the research, which are discussed thereafter. The final section presents some concluding remarks and research implications.
2. Agricultural production, poverty and food security
Discussions around ways of tackling issues relating to poverty and food security have consistently included the role of agriculture in light of its importance to the livelihoods and economy of many developing nations (Garrity et al., Citation2010). The mechanisms of agriculture’s contribution to food security and poverty alleviation, especially at the macro level, have been well expounded in the literature (see for instance, Byerlee et al., Citation2009; Christiaensen et al., Citation2011; Dethier & Effenberger, Citation2012; Food and Agricultural Organization (FAO), Citation2012; The World Bank, Citation2007; Thorbecke, Citation2013). Agriculture has the potential to stimulate economic growth, particularly in regions or nations where significant increases in productivity are achieved. Realising this is however largely dependent on multifarious factors such as technology adoption, farm size, access to land and inputs, and environmental concerns (Dethier & Effenberger, Citation2012; Thorbecke, Citation2013). Furthermore, compared to growth from other sectors, agriculture-driven economic growth is posited to be more beneficial for the poor and more effective in reducing poverty. This is particularly true in developing countries where growth is largely influenced by the sheer proportion of the population that derives its livelihood from agriculture (Christiaensen et al., Citation2011; Deininger & Byerlee, Citation2012; Food and Agricultural Organization [FAO], Citation2012).
Agricultural growth is fundamental for development in most developing countries (Dethier & Effenberger, Citation2012; FAO, Citation2012), owing to the dominance of the sector with respect to aggregate income and total labour force (Dethier & Effenberger, Citation2012; Thorbecke, Citation2013), as well as its comparative advantage in an export-driven growth model in the initial stages of development (Byerlee et al., Citation2009). About 60% of the labour force in developing economies is employed in agriculture (Dethier & Effenberger, Citation2012) while the proportion of sub-Saharan Africa’s population engaging in agriculture as a means of livelihoods ranges between 70% and 85% (Cistulli et al., Citation2014; Siddik et al., Citation2015). Needless to say therefore, that it would be impossible to undermine the role of agriculture in these countries in the foreseeable future (Gollin, Citation2014; Thorbecke, Citation2013).
Efficiency and agricultural productivity are interconnected, as the former is indeed critical to productivity growth. In resource-constrained economies and environments, inefficiency studies illustrate the feasibility of raising productivity through the improvement of efficiency without necessarily increasing the resource base or promoting new technology (Tijani, Citation2006). In another vein, it is generally held that increasing productivity in the agricultural sector would lead to increased food production, thus boosting food availability, especially among the poor (Baldos & Hertel, Citation2014; Dethier & Effenberger, Citation2012; FAO, Citation2012, Citation2013). Such policy direction, when combined with other measures to increase income, such as social protection, could be an effective strategy for rural development and poverty reduction, particularly when smallholders are targeted (Byerlee et al., Citation2009; FAO, Citation2013). Also, improvement in agriculture can readily translate to increased access to jobs and incomes that would inevitably improve access to food (Department for International Development [DfID], Citation2004; Byerlee et al., Citation2009; Dethier & Effenberger, Citation2012). Additionally, increasing agricultural productivity can potentially reduce prices of food produce, thus improving dietary diversity and quality of households while also boosting stability in consumption (FAO, Citation2012; Hendriks et al., Citation2009).
Food insecurity and poverty are intimately linked, such that both serve as causal factors of each other. On the one hand, food insecurity is engendered by poverty, which manifests itself through the discernible lack of income as well as asset and entitlement deprivation of households. This ultimately and negatively affects people’s potential ability to access food. Devereux (Citation2015) notes that the aforementioned is markedly pronounced among rural farmers where there is a strong overlap of income and crop production. On the other hand, food insecurity perpetuates poverty, as people’s ability to work and lead prosperous lives diminishes due to ill-health and other negative outcomes of hunger (DfID, Citation2004; Qureshi et al., Citation2015). The FAO (Citation2013) observes positive associations between poverty and the prevalence of undernourishment as well as between poverty and low levels of food utilisation.
Food insecurity is not merely about inadequate food production, but more importantly, it relates to poverty and poor household incomes (Cistulli et al., Citation2014). Food availability and access are thus critical elements of food security that intersect with, and are affected by, multifarious physical, socio-economic and political factors. Undoubtedly, food availability does not guarantee access which is categorised into two parts: physical and economic. While the former is contingent on existing infrastructure, the latter is determined by factors such as the combination of income, food prices and access to social support (FAO, Citation2013; Capone et al., Citation2014). This combination is important particularly for smallholders as it is invariably impractical for them to meet all their food needs from their own farms. Hence, the affordability of food needs that could not be met from farms, becomes significant.
Incontrovertibly, poverty and hunger continue to ravage many, especially in developing countries. The world population forecast of 9 billion by 2050 would bring with it an increased competition for the earth’s resources. Food demand, for instance, is anticipated to more than double in the foreseeable future, with a significant proportion of the increase coming from developing nations (Cistulli et al., Citation2014). In Africa, there is presently an imbalance between the food production growth rate and the population growth rate as the continent’s per capita food production lags behind the production growth rate (Cistulli et al., Citation2014). Certainly, food security challenges are greatest in sub-Saharan Africa (FAO, IFAD, UNICEF, WFP and WHO, Citation2017), which are characterised by poor access to food, low income and a deficient infrastructural base. The majority of the poor and food insecure people in these countries are found in the rural areas, where deprivation is most pervasive and many are involved in agriculture as a means of livelihood (Byerlee et al., Citation2009; Dercon & Gollin, Citation2014; Minten & Barrett, Citation2008). Indeed, there is evidence that agriculture’s below par performance has contributed largely to the continued grappling with food insecurity and poverty in sub-Saharan Africa (Siddik et al., Citation2015).
Among the rural poor, increasing the productivity of local farmers is fundamental to the achievement of food security and local economic development (Dercon & Gollin, Citation2014; Dethier & Effenberger, Citation2012; Garrity et al., Citation2010). Indeed, there is evidence that agricultural growth among labour-intensive smallholders who spend most of their earnings locally results in a ripple effect on the local economy, thus leading to job creation and income generation especially for the poorest, and profoundly impacting on hunger and poverty reduction (DfID, Citation2004; FAO, Citation2012). Agriculture’s ability to generate income, especially for rural dwellers, may be more critical for food security than its ability to boost local food supplies (Byerlee et al., Citation2009). This is defensible since farmers may not be able to meet all their food needs from their own farms.
Smallholders constitute the majority of the world’s pool of farmers, mostly operating on farms of less than 2 hectares. Among these farmers the incidence of poverty and food insecurity is more markedly pronounced (Tscharntke et al., Citation2012). Given that households with serious food insecurity challenges would have their level of agricultural productivity negatively affected and vice versa (Devereux, Citation2015; Liverpool-Tasie et al., Citation2011), it becomes imperative to consider the food security status of farmer households. In essence, due to the dominance of smallholder agriculture and the vulnerability of many smallholders, achieving global food security and poverty eradication requires that attention is paid to transforming the sector (Dethier & Effenberger, Citation2012; Garrity et al., Citation2010; Herrero et al., Citation2014; Tscharntke et al., Citation2012).
3. Differentiation in smallholder agriculture
In studying production systems within a community, it is imperative to consider the dynamics of the political economy in order to comprehend the forces driving local production, accumulation, and livelihoods strategies. Capitalism has promoted specialisation and social differentiation within the rural community, which was brought about by the mechanisms of the market. People increasingly felt that some of their needs could be met via the market. This resulted in an over-reliance on the market and social differentiation based on the ability or otherwise to be competitive in the market (Bernstein, Citation2010; Cousins, Citation2013). Cousins (Citation2013) points out that a notable feature of the classic agrarian question is the dynamics of class differentiation. This is prominent in the theoretical discourse of Marx, Lenin and Kautsky (Cousins, Citation2013). For Lenin, there was a growing differentiation within the peasantry and class polarisation within agriculture, resulting in the creation of conflicting classes of agrarian capitalists and rural workers (Buttel, Citation2001).
Suffice to say however, that social differentiation may not be as uniform and straightforward as it has been construed. Referring to O’Laughlin’s (Citation1996) dissection of the agrarian question in Mozambique, Cousins (Citation2013) notes that social differentiation of rural households does not proceed in a direct and precisely stratified manner, but combines two analytically divergent process: “(a) a ‘diversification of rural livelihoods’ via variable combinations of own production and different forms of wage labour; and (b) ‘class stratification’, the emergence of sharp differences in control of land, cattle and implements (the means of agricultural production)” (Cousins, Citation2013, p. 121). Cousins (Citation2008), in his agrarian class analysis of South Africa, identifies different typologies of smallholder farmers; capitalists whose major income is not from farming, small-scale capitalist farmers, petty commodity producers, worker-peasants, allotment-holding wage workers, and supplementary food producers. As a result of the foregoing, it would be apposite to maintain that although there exists a general inclination towards class differentiation, complexities exist. Therefore, heterogeneity observed in class is influenced and shaped by other conditions that are not uniformly distributed across space, and hence contingent on an array of locally specific dynamics. These include the concatenation of class with other social differentials such as age, race, ethnicity, religion and gender which are the most widespread (Bernstein, Citation2010).
The research grounds itself in undertaking a grouping of smallholder households on the basis of efficiency, food security and income. This will allow for the identification of households that are vulnerable in any of, or combination of, income, production efficiency and food security dimensions. Such analysis is valuable in establishing the basis for monitoring of households and assessing intervention impacts, as well as the design of effective policies (Babu & Sanyal, Citation2009).
4. Materials and methods
4.1. Study area
The Middle Rima Valley Irrigation Project is one of the irrigation developments of the Federal government of Nigeria. The scheme is under the direct supervision and management of the Sokoto Rima River Basin Development Authority (SRRBDA) with the Federal Ministry of Water Resources playing an oversight function on the project. Located at Keta Village in the Goronyo Local Government Area of Sokoto State, Nigeria, the scheme is designed to provide water resources for perennial cultivation for farmers. The project is located downstream of Goronyo Dam which is the key structure for irrigation and agricultural development of the area. The scheme was intended to provide water for irrigation of an area covering about 5,360 hectares.
The climate in the study area is characterised by some wet periods and a prolonged dry season. The incidence of periodic droughts is frequent as rainfall is mostly erratic, hence the irrigation in the study area. According to Yahaya (Citation2002), the mean annual rainfall ranges from 500 to 1,300 mm. Farmers operating under the scheme are smallholders who are organised into farming families and have access to the irrigation facilities provided by the SRRBDA.
As farming is the major preoccupation of the people in the study area, irrigation activities becomes necessary owing to the climatic condition of Sokoto State. Also, in terms of the number of smallholders operating on the scheme and the significant investment on the project, it is one of the biggest project of its kind in Nigeria. It is therefore imperative to analyse the efficiency, income and food security status of smallholder households in the hope that insights from such analysis will help policy makers and analysts to design better irrigation and agricultural policies that will have lasting positive effects on people.
4.2. Sampling and data collection
The main approach used in collecting quantitative data used for the study was the administration of household questionnaires. From an inventory of farmers conducted by the SRRBDA, there were about 10,000 smallholders in the project. To select smallholder households interviewed for the study, a systematic random sampling technique, which entails the selection of every “kth” element in the sample, was adopted. Sample size calculation was done using Raosoft Software.Footnote1 Based on a 5% margin of error and a 95% confidence interval, 370 smallholders were selected for the study. The questionnaire administration was conducted with household heads, using semi-structured and structured questions. It is frequently asserted in the literature that women, who are often in charge of food preparation and decisions, should be interviewed for data on household food consumption. However, this represents a limitation in this research due to time and cost constraints and the fact that agricultural production and household livelihoods data needed to be collected simultaneously, which, taken together, justified the selection of household heads for questionnaire administration. To limit errors that may arise from analysis, questionnaires that were not completed successfully, having many questions unanswered, were removed from the study. Consequently, 306 questionnaires were successfully completed and included in the analysis, representing an 83% response rate. The survey questionnaire collected information on variables relevant to the research aims including agricultural production, household food consumption over a seven day period, organisational membership, participation in training programmes, demographic and socio-economic characteristics of households.
4.3. Data analyses
As a major objective of the study is to classify smallholder households into categories based on their efficiency, income and food security status, a number of statistical procedures were carried out in the study using different statistical software packages.
First was the assessment of the technical efficiency of smallholders, which was done by examining their efficiency using the Stochastic Production Frontier Function. Productivity measures in agriculture refer to the association between the production of an agricultural commodity and the inputs used to produce the commodity (Coelli et al., Citation2005; O’Donnell, Citation2010; Simonyan et al., Citation2012). Whereas least-squares econometric production models and total factor productivity are more suitable and often applied to aggregate time series data and provide measures of technical change, data envelopment analysis and the stochastic frontier are most often adopted on a sample of firms, for cross-sectional data and provide measures of relative efficiency among firms (Coelli et al., Citation2005).
Arguably, enhancing technical efficiency is attainable either through technological change or improved use of existing technology. In resource-constrained environments however, improving efficiency may be more feasible given limitations to developing the technology base (FAO, Citation2017; Tijani, Citation2006). According to the FAO (Citation2017), the types of inputs and resources available characterise production technology and the production frontier represents the combination of inputs, which yields the output that is maximally obtainable. As such, the production frontier is the “ideal frontier” which no firm can exceed, and divergences from the frontier are reflections of individual inefficiencies (Belotti et al., Citation2013). Nevertheless, one of the fundamental objectives of producers is the avoidance of waste by obtaining maximum outputs from given inputs which corresponds to the attainment of a high level of technical efficiency (Kumbhakar & Lovell, Citation2000).
The stochastic frontier model, which aims at inferring information about technical efficiency and frontier parameters (Belotti et al., Citation2013; Kumbhakar & Lovell, Citation2000), comprises a production function which is specified using a regression model with an error term that has two components. Specifically, the Cobb-Douglas stochastic production function was used in the study (see Simonyan et al., Citation2012; Tijani, Citation2006). It is specified as follows:
In the above equation the subscript, i, indicates the ith farmer in the sample; ln is natural logarithm and are coefficients to be estimated. Given that the value of output is in natural logarithmic form, the coefficients
measure percentage changes in output that result from a percentage change in the respective factors of production.
and
are components of the error term.
are assumed to be independent and identically distributed normal random errors, having zero mean and unknown variance,
and
represent the technical inefficiency effects, which are assumed to be independent of
such that
is the non-negative truncation (at zero) of the normal distribution with mean,
, and variance,
(Tijani, Citation2006).
Further, is defined by:
Where:
= number of times a plot is cultivated in a year
= household size
= farming experience (in years)
= access to credit (0—no access to credit; 1—access to credit)
= off-farm income (0—no off-farm income; 1—off-farm income)
= educational status (0—no education; 1—education)
These variables are assumed to influence the technical efficiency of farmers, and s are unknown scalar parameters to be estimated. The maximum likelihood estimates (MLEs) of the parameters in the Cobb-Douglas stochastic frontier production function model, as well as the inefficiency estimates of each smallholders were derived using the FRONTIER 4.1 programme (Coelli, Citation1996). These inefficiency estimates constitute one of the variables used in the smallholder typology.
The food security status of smallholder households was computed using the food consumption score (FCS) developed by the United Nations’ World Food Programme (WFP). The FCS signifies a household’s dietary diversity, nutrient intake and frequency of consumption. It is derived by aggregating data on the diversity and frequency of food consumed by a household over the previous seven days, and applying weight on the respective food groups based their relative nutritional value (World Food Programme [WFP], Citation2008). The food groups and their respective weights are: staples—2, pulses—3, vegetables—1, fruit—1, meat and fish—4, milk—4, sugar—0.5, oil—0.5, and condiments—0. The overall FCS for each smallholder household which addresses the accessibility dimension of food insecurity was derived by multiplying the frequency with which each food group is consumed by their respective weights, and thereafter summing the scores together (Jones et al., Citation2013). A household’s income status used in the analysis was the gross annual earnings of the household for the production year.
Cluster analysis was used to classify smallholders into categories based on the aforementioned variables. Cluster analysis is a technique that is concerned primarily with the classification of observations, individuals or objects into groups or categories based on shared similarities (Babu & Sanyal, Citation2009; Blaikie, Citation2003; Hair et al., Citation2014). In other words, cluster analysis is fundamentally concerned with putting the most similar observations together in groups with an overarching aim of maximising the homogeneity within clusters and the heterogeneity between clusters. The classification, rather than being an end in itself, is often a means to an end which could either be data reduction or hypothesis generation.
The clustering process started with the assessment of the variables for any multi-collinearity issues. This was achieved by examining their Pearson correlation coefficients. Because clustering variables were in differing scales, they were standardised using Z-scores in a bid to avoid cases of variables having more than the anticipated influence on the cluster solution as well as for easier comparison between variables. A fundamental issue for any clustering analysis is the specification of clustering seeds or a number of clusters to be included in the analysis. To arrive at the most fitting cluster solution, a combination of both the hierarchical and non-hierarchical methods was used in the study. Firstly, a hierarchical procedure was used to generate a complete set of cluster solutions and to identify a suitable number of clusters. It was also used to identify and eliminate outliers from the data. Once the number of clusters was derived, the non-hierarchical procedure using the K-means was used for the final cluster of observations (see Hair et al., Citation2014).
The hierarchical method combines the repetitive clustering process with a clustering algorithm to establish the similarity between clusters with multiple clusters. The procedure produces differing cluster solutions ranging between one-cluster solution to single-member clusters, thus providing a basis for assessing which cluster solution (or number of clusters) would be a good fit for the analysis (Hair et al., Citation2014). The Ward’s method of clustering algorithm was used as it relatively generates homogenous clusters and the squared Euclidean (straight-line) distance was used as the distance measure. Another consideration in the hierarchical approach was the use of the “stopping rule” to specify the number of clusters most representative of the structure of the data. The stopping rule adopted is based on the rate of change in the total heterogeneity measure as the number of clusters decreases or increases. A large increase in heterogeneity from one stage to another would be an indication that the prior cluster solution should be selected as the new combination, is merging substantially different clusters. Hair et al. (Citation2014) note that the agglomeration coefficients are a useful tool in selecting the final cluster solution, as small coefficients signify the merging of fairly homogenous groups and vice versa.
After the selection of the final cluster solution (number of clusters), the K-means method of cluster analysis, which specifies the number of clusters, was applied to the data. The clustering algorithm used is the optimisation procedure which allows for the reassigning of observations to another cluster other than the one it was initially assigned. An important advantage of the K-means clustering over the hierarchical procedure is the involvement of an iterative reassignment of observations to clusters until some user-specified numerical criterion is arrived at (Babu & Sanyal, Citation2009; Hair et al., Citation2014). In essence, the K-means was used to develop optimal cluster solutions.
The overall fit of the final cluster solution was assessed using ANOVA which represents the difference in the variable means across the clusters. The clusters established were also characterised using some socio-economic variables of the smallholder households and these were used in profiling the final cluster solution. These variables are: household size, farm size, household head’s educational status, farming experience, total livestock unit, participation in training schemes, participation in non-farm activities, and receipt of remittance. The research thereafter proceeds to establish some predictive validity by applying the multinomial logit regression to test whether the socio-economic variables are significant predictors of clustered smallholder households. The cluster analyses were carried out using SPSS Version 24.
5. Results
The summary statistics of the clustering variables is presented in Table . The mean technical efficiency of the smallholders was 85% with a standard deviation of 9%. The average food consumption score for the sampled households was 33.2 with a standard deviation of 6.3. Given that FCS scores that range between 0–21 and 21.5–35 are categorised as poor and borderline respectively and a score greater than 35 is classified as an acceptable food security level (WFP, Citation2008), it is evident that the majority of the households had unacceptable food security levels. The mean annual income of the households was 237,995 naira (approximately 650 USD) with a standard deviation of 90,823 naira (approximately 250 USD).
Table 1. Summary statistics of clustering variables
Subsequently, the selected variables for the cluster analysis were scrutinised for any multicollinearity issue. The Pearson correlation analysis presented in Table indicates that there were statistically significant associations between the variables, albeit the three variables were moderately correlated with each other. Hence there was no issue of multicollinearity, which could have affected the cluster analysis. A hierarchical cluster analysis was performed using the Ward’s linkage with squared Euclidean distance. The initial results revealed that two observations were outliers and were thus removed from the analysis. The analysis was performed again with the remaining 304 observations. Evidence from the literature suggests that the smaller the number of clusters, the bigger the agglomeration coefficients. More importantly, more clusters render the process of managing them problematic while they also become trickier to communicate. As such, no more than six clusters were desired and the focus was thus on the last 10 stages of the agglomeration schedule, which are presented in Table .
Table 2. Pearson correlation of clustering variables
Table 3. Agglomeration schedule for initial cluster analysis
The differences in the agglomeration coefficients between stages indicate the extent of the increase in heterogeneity from one stage to the next, and the application of the stopping rule is aided by examining the percentage change in clustering coefficients from one stage to the next (Hair et al., Citation2014). Since no more than six clusters were desired, a cursory look at the table indicates that the agglomeration coefficient shows relatively large increases going from stage 300 to 301 (24.4%), 301 to 302 (38.6%), and stage 302 to 303 (68.6%), hence relatively large increases in heterogeneity. However, relatively smaller coefficients were derived moving from stages 298 to 299 (13.7%) and 299 to 300 (18.7%). Hence, it was decided that the appropriate cluster solution for the research would be either a five-cluster solution or a six-cluster solution. Preliminary analysis of both cluster solutions was performed using the K-means method. The ANOVA result generated for both solutions indicates that the five-cluster solution showed relatively bigger F-Values compared to the six-cluster solution. As a result, and also for easier analysis and comparison among clusters, the cluster solution with five clusters was selected as the final cluster solution for the analysis.
The non-hierarchical cluster analysis done using the K-means method grouped households into five clusters and an optimisation algorithm that maximises within-cluster variance and maximises between-cluster variance was chosen. Table presents the ANOVA results of the five cluster solutions. The results indicate that there are statistically significant differences between the cluster households on each of the three clustering variables (as p-values < 0.0001). Interpretation and profiling of clusters were done by examining the mean cluster centres (presented in Table and Figure ) as well as the pairwise comparisons between the clusters and some socio-economic characteristics of households within each cluster (Table ).
Figure 1. Final cluster centres for efficiency, food consumption score and income
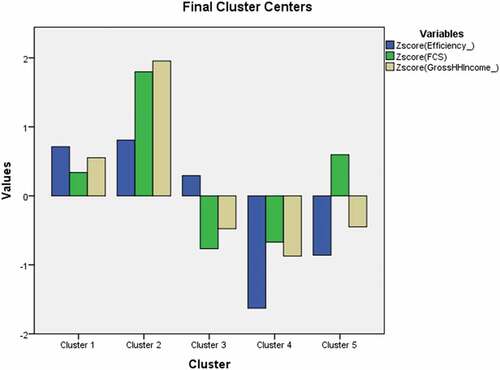
Table 4. ANOVA for final cluster solution
Table 5. Final cluster centres for efficiency, food consumption score and income
Table 6. Household characteristics by clusters
Cluster 1, termed households with average food security and income but high efficiency levels, comprises 27.3% of the total households. Compared to the means for the entire sample, this cluster has higher mean household sizes, farm sizes and more years of farming experience, but lower total livestock units. The households farm on an average land size of 0.25 hectares. About 26.5% of households within the cluster have formal education (lower than the sample means) and 62.7% have received at least a form of training via the irrigation scheme (higher than the total sample average). Remittance receipts are low among the households (9.6%) but the majority (65.1%) engage in non-farm activities.
Cluster 2, termed households with high food security, income and efficiency levels, represents the best-off households among the cluster groups but constitutes 10.5% of sampled households. Compared to the average levels in the total sample, these households have higher mean household sizes (9.56), farm sizes (0.39 ha), years of farming experience (15.28) and total livestock units (2.46). Furthermore, a higher proportion of the households, compared to other clusters, engage in non-farm activities (75%) and receive remittance (43.8%). However, the proportion with formal education is lower than the entire sample. Also, the majority have received training but the proportion is lower than cluster 1.
Cluster 3, referred to as households with average efficiency levels but food insecure and income poor, comprises the largest proportion of the total households (32.9%). It has the lowest mean values for household size and farm size among the clusters, and the second lowest average in terms of farming experience and total livestock units. However, the cluster has the second highest proportion of households with formal education, which is also higher than the total sample average. At least half of the households in the category has received training from the irrigation scheme and engaged in non-farm activities.
Cluster 4, termed households with low efficiency levels, food insecure and income poor, represents perhaps the most deprived of all clusters. About 16.1% of the total households fall into this category, and are characterised by lower levels of farm size, household size, farming experience and total livestock units compared to the entire sample average. Surprisingly, the cluster has more households with formal education than other clusters. However, it has the smallest proportion of households with training under the scheme. Furthermore, it has the smallest proportion engaging in non-farm activities and receiving remittance out of all of the clusters.
Cluster 5, referred to as households with low efficiency levels, income poor but food secure, comprises 13.1% of smallholder households surveyed. This group has relatively higher mean household size, farming experience and total livestock units (only lower than cluster 2). The mean farm size is lower than the sample average and so is the proportion of households with formal education, households with training, households who engaged in non-farm activities and households who received remittances.
A multinomial logistic regression was performed to model the relationship between membership in cluster groups and the predictor variables (household characteristics). Results presented in Table adding the predictor variables into the model that contained only the intercept, fits the data significantly better than the null model, X2 (df = 32; N = 304) = 237.11, p < 0.0001). Furthermore, with respect to the goodness-of-fit result of a multinomial logistic regression, it is widely noted that a statistically significant result (p < 0.05) is suggestive that the model is a poor fit for the data (Hair et al., Citation2014). The model, however, is a good fit for the data since the p-value for the Pearson chi-square is 0.590.
Table 7. Determinants of smallholder typology (multinomial logit regression)
For the parameter estimates, cluster 3 was used as the reference category as it was the most dominant group in terms of the number of households in the group. The odds ratios, which represent the ratio of the probability of two events or outcomes, were interpreted using significant levels ranging from 1% to 10%. These are presented in Table .
Given a unit increase in household size, the relative chance of being in cluster 1 as against cluster 3 increases by a factor of 1.560. In addition, a unit increase in farming experience increases the odds of being in cluster 2 relative to cluster 3 by a factor of 1.401. Given that remittance is a dummy variable, ‘0ʹ signifies non-receipt of remittance and ‘1ʹ indicates receipt of remittance. The probability of not receiving remittance decreases by 0.147 times in cluster 2 relative to cluster 3. In other words, the probability of receiving remittance increases by 0.147 times in cluster 2 relative to cluster 3. More precisely, households in cluster 2 are more likely to receive remittance than households in cluster 3. Following the same method of interpretation, it is evident that households in cluster 4 are 2.014 times less likely to have been trained compared to those in cluster 3. They are also 4.336 times less likely to engage in non-farm activities relative to households in cluster 3. This is a further confirmation of the deprivation or low levels of welfare of households in cluster 4. For these households, it is evident that livelihoods diversification is limited among them.
Regarding farm size, results indicate that given a unit increase in farm size, the relative chance of being in cluster 1, cluster 2, cluster 4 or cluster 5 as against the referent cluster (cluster 3) increases by factors of 1.002, 1.003, 1.001 and 1.001 respectively. A cursory consideration of these odd ratio values for farm size across all clusters is indicative that increase in farm size increases the probability of being in cluster 2 (the best-off cluster) relative to other clusters as it has a higher odds ratio value. The foregoing emphasises the importance of farm size in improving the livelihoods of smallholders as it can contribute to moving households to a higher return livelihood.
6. Discussion
Evidence from the analysis indicates that there is a significant positive relationship between efficiency, income and food security. This is not unexpected as it has been established that agriculture leads to income generation, which consequently provides the means for food access (Dioula et al., Citation2013; Negin et al., Citation2009; Smith, Citation1998). However, the association between income on the one hand, and efficiency and food security status on the other, was stronger than the association between efficiency and food security. This thus underlines the importance of income to smallholder production and household food security. The study attempted to identify and group households into categories based on their efficiency in agricultural production, food security and income status.
Households with the highest efficiency were characterised with high food consumption scores and income levels, further corroborating the relationship between the three phenomena. Very few households however, fell into this category, an indication that households with greater inefficiency would probably also face income and food security challenges. Besides, households with average levels of efficiency were associated with food insecurity and low income. This is the dominant household typology in the study area but not the most deprived as there was a greater likelihood that a typical household in the category had been trained or had diversified its livelihoods through engagement in farming activities.
The most deprived households had low efficiency levels, were income poor as well as food insecure. The reason for this may not be far-fetched as the households had lower farming and socio-economic status, with the exception of formal education. The proportion of households in this category with formal education was indeed higher than well-off households, but fewer had training compared to other clusters. More profoundly, the study established that training, rather than education, is more significantly associated with efficiency, food security and income.
Farm experience tends to be positively associated with food security, income and efficiency levels. It is anticipated that as farmers become more experienced, their ability to make better choices and better utilise resources, improves, which consequently enhances their technical efficiency. With efficiency improvement comes improved income and food security status. The foregoing is reflective of the fact that practical training and experience are more fundamental to raising efficiency and incomes of farmers than formal education in the study area. The importance of experience further begs the question of how to offset for experience in light of the fact that it cannot be substantially increased without due consideration of time. Arguably, the solution could be in the training and retraining of farmers as well as opportunities and spaces for knowledge transfer among them. The significance of training is exemplified in the observation of Wordofa and Sassi (Citation2018) who note that farmer training leads to income gains for farmers. With the shrinking of government extension outreaches however, a way to go may be to follow the suggestion of Jansen et al. (Citation2006) who advocate for the adoption of a farmer-to-farmer extension model which is being promoted in some NGO-led initiatives.
The importance of land to income, food security and technical efficiency is exemplified in its significance to all clustered households. Evidently, larger land sizes increase the probability of being in the best-off smallholder clusters, particularly in terms of income and household food security. While Place (Citation2009) alludes to evidence in the literature of the positive association between farm size and households, accounts of the effect of farm size on food security have been mixed. For instance, Muraoka et al. (Citation2018) note that farm size leads to increased food security in rural Kenya. Abay, Hirvonen and Minten (Citation2017) however observe that the difference in food security indicators was not so large between households with large farms and small farms in Ethiopia, as farmers in the latter category cultivated intensively and diversified their livelihoods in a bid to enhance the food security status.
Livelihoods diversification was very limited among the most deprived households, but was undertaken by many of the best-off households. Regression results also indicate that livelihoods diversification increases the probability of being in a better-off household typology. Indeed, there is a likelihood that income and livelihood strategies can have a mutual effect on each other. Income secured from non-farm activities or remittance, for instance, can be used to increase farm yields while increased incomes from improved farm yields can be utilised to diversify livelihoods. For some households, it appears their ability to diversify is associated with financial capital, which is facilitated by their relatively higher income earnings. This aligns with views advanced in the literature on the significance of finance in agricultural and livelihoods improvement (Brown et al., Citation2006; Fayet & Vermeulen, Citation2014; Rahn et al., Citation2014).
7. Conclusion
The use of both the cluster and multinomial regression analyses for the research represents an interesting way of exploring smallholder households’ differentials. The partitioning allows for the testing of the hypothesis that farming and socio-economic characteristics of households affect smallholder typologies based on efficiency, food security and income status of the households. The study found that household clusters are not only differentiated by their efficiency, food security and income status but also by some other household characteristics with an overarching effect on the former variables. In other words, household characteristics differentials determine variation in the efficiency, food security and income status of smallholder households. This procedure has generated results that may assist in better targeting of interventions based on the particular characteristics explored in the analysis. The paper also highlighted the important role that land size and farmer training plays in improving farmers’ livelihoods. As increasing farm size is not feasible into the future, this paper argues that sustainable intensification should be promoted among smallholders. A multi-pronged approach to the provision of extension services and training of farmers would assist in bridging the gap that may exist in the technical and management knowledge among the farmers. The study also found that although livelihood diversification is not very common among the farmers, it is an important strategy that can assist smallholders to improve their efficiency in production as well as their livelihood status. For this reason, opportunities for diversifying livelihoods should be promoted among smallholders.
Additional information
Funding
Notes on contributors
Daniel Adeoluwa Adeniyi
Daniel Adeoluwa Adeniyi is a Postdoctoral Research Fellow at the Centre of Excellence in Food Security and the Institute for Social Development, both of the University of the Western Cape, South Africa. A former doctoral scholar of the African Pathways Programme, Adeniyi holds a Bachelor of Science (Hons) degree in Urban and Regional Planning from Obafemi Awolowo University, Nigeria. He also holds PhD and Masters (Cum Laude) degrees in Development Studies from the University of the Western Cape, South Africa. His research interests include agriculture, food security, poverty, monitoring and evaluation, and sustainable development.
Mulugeta F. Dinbabo
Mulugeta Dinbabo is an Associate Professor of Development Studies at the Institute for Social Development, University of the Western Cape, South Africa. He has supervised and graduated many Masters and PhD students. He teaches postgraduate courses on research methods, development management and planning. He has published widely in refereed international journals and edited books. He is also the Chief Editor of the African Human Mobility Review (AHMR).
Notes
1. The software is readily available at www.raosoft.com.
References
- Abay, K., Hirvonen, K., & Minten, B. (2017). Farm size, food security, and welfare: Descriptive evidence from the Ethiopian highlands. International Food Policy Research Institute.
- Akerele, D., Momoh, S., Aromolaran, A. B., Oguntona, C. R. B., & Shittu, A. M. (2013). (2013) ‘Food insecurity and coping strategies in South-West Nigeria’. Food Security, 5(3), 407–19. https://doi.org/10.1007/s12571-013-0264-x
- Anyanwu, J. C. (2014). Marital status, household size and poverty in Nigeria : Evidence from the 2009/2010 survey data. African Development Review, 26(1), 118–137. https://doi.org/10.1111/1467-8268.12069
- Babu, S. C., & Sanyal, P. (2009). Food security, poverty and nutrition policy analysis: Statistical methods and applications (First ed.). Elsevier Inc. https://doi.org/10.1016/B978-0-12-374712-9.00001-8
- Baldos, U. L. C., & Hertel, T. W. (2014). Global food security in 2050: The role of agricultural productivity and climate change. Australian Journal of Agricultural and Resource Economics, 58(4), 554–570. https://doi.org/10.1111/1467-8489.12048
- Belotti, F., Daidone, S., Ilardi, G., & Atella, V. (2013). Stochastic frontier analysis using stata. The Stata Journal, 13(4), 719–758. https://doi.org/10.1177/1536867X1301300404
- Bernstein, H. (2010). Class dynamics of agrarian change. Fernwood Publishing.
- Blaikie, N. (2003). Analyzing quantitative data. SAGE Publications, Ltd. https://doi.org/10.4135/9781849208604
- Brown, D., Stephens, J., Ouma, J., Murithi, F., & Barrett, C. (2006). Livelihood strategies in the rural Kenyan highlands. African Journal of Agricultural and Resource Economics, 1(1), 21–36. http://ageconsearch.umn.edu/bitstream/57019/2/0101 Barrett - FINAL & Fr abstract 5 Mar.pdf%5Cnhttp://econpapers.repec.org/article/agsafjare/57019.htm
- Buttel, F. H. (2001). Some reflections on late twentieth century agrarian political economy. Sociologia Ruralis, 41(2), 165–181. https://doi.org/10.1111/1467-9523.00176
- Byerlee, D., De Janvry, A., & Sadoulet, E. (2009). Agriculture for development: Toward a new paradigm. Annual Review of Resource Economics, 1(1), 15–31. https://doi.org/10.1146/annurev.resource.050708.144239
- Capone, R., Bilali, H., Debs, P., Cardone, G., & Driouech, N. (2014). Food economic accessibility and affordability in the mediterranean region: An exploratory assessment at micro and macro levels. Journal of Food Security, 2(1), 1–12. https://doi.org/10.12691/jfs-2-1-1
- Christiaensen, L., Demery, L., & Kuhl, J. (2011). The (evolving) role of agriculture in poverty reduction-An empirical perspective. Journal of Development Economics, 96(2), 239–254. Elsevier B.V. https://doi.org/10.1016/j.jdeveco.2010.10.006
- Cistulli, V., Rodríguez-Pose, A., Escobar, G., Marta, S., & Schejtman, A. (2014). Addressing food security and nutrition by means of a territorial approach. Food Security, 6(6), 879–894. https://doi.org/10.1007/s12571-014-0395-8
- Coelli, T. J. (1996) A guide to FRONTIER 4.1: A computer program for stochastic frontier production and cost function estimation, CEPA Working Paper 96/07. Armidale. http://www.une.edu.au/econometrics/cepa.htm.
- Coelli, T. J., Rao, D., O’Donnell, C. J., & Battes, G. E. (2005). An introduction to efficiency and productivity analysis. Springer Science and Business Media, Inc. https://doi.org/10.2307/2531310
- Cousins, B. (2008) What is a ‘smallholder’? Class analytic perspectives on small-scale farming and agrarian reform in South Africa (PLAAS Working Paper No. 16). Cape Town.
- Cousins, B. (2013). Smallholder irrigation schemes, agrarian reform and “accumulation from above and from below” in South Africa. Journal of Agrarian Change, 13(1), 116–139. https://doi.org/10.1111/joac.12000
- Deininger, K., & Byerlee, D. (2012). The rise of large farms in land abundant countries: Do they have a future? World Development, 40(4), 701–714. Elsevier Ltd. https://doi.org/10.1016/j.worlddev.2011.04.030
- Department for International Development (DfID). (2004). Agriculture, hunger and food security. Department for International Development (DfID.
- Dercon, S., & Gollin, D. (2014). Agriculture in African development: Theories and strategies. Annual Review of Resource Economics, 6(1), 471–492. https://doi.org/10.1146/annurev-resource-100913-012706
- Dethier, -J.-J., & Effenberger, A. (2012). Agriculture and development: A brief review of the literature. Economic Systems, 36(2), 175–205. Elsevier B.V. https://doi.org/10.1016/j.ecosys.2011.09.003
- Devereux, S. (2015). Social protection for enhanced food security in sub-Saharan Africa. Food Policy, 60, 52–62. Elsevier Ltd. https://doi.org/10.1016/j.foodpol.2015.03.009
- Dioula, B. M., Deret, H., Morel, J., & Kiaya, V. (2013). Enhancing the role of smallholder farmers in achieving sustainable food and nutrition security. Food and Agriculture Organization.
- FAO, IFAD, UNICEF, WFP and WHO. (2017). The state of food security and nutrition in the world. FAO Rome. http://www.fao.org/state-of-food-security-nutrition/en/
- Fayet, L., & Vermeulen, W. J. V. (2014). Supporting smallholders to access sustainable supply chains: Lessons from the Indian cotton supply chain. Sustainable Development, 22(5), 289–310. https://doi.org/10.1002/sd.1540
- Food and Agricultural Organization (FAO). (2012). The state of food and agriculture 2012. Food and Agriculture Organization of the United Nations. https://doi.org/10.1002/9789251073179
- Food and Agricultural Organization (FAO). (2013). The State of Food Insecurity in the World: The Multiple Dimensions of Food Security, Web report. Rome: Food and Agriculture Organization of the United Nations.
- Food and Agricultural Organization (FAO). (2017). Productivity and efficiency measurement in agriculture: Literature review and gaps analysis (Technical Report Series Global Strategy). Rome: Food and Agriculture Organization of the United Nations.
- Garrity, D. P., Akinnifesi, F. K., Ajayi, O. C., Weldesemayat, S. G., Mowo, J. G., Kalinganire, A., Larwanou, M., & Bayala, J. (2010). Evergreen agriculture: A robust approach to sustainable food security in Africa. Food Security, 2(3), 197–214. https://doi.org/10.1007/s12571-010-0070-7
- Gollin, D. (2014). Smallholder agriculture in Africa (IIED Working Paper). IIED.
- Hair, J. F., Jr, Black, W. C., Babin, B. J., & Anderson, R. E. (2014). Multivariate data analysis (Seventh ed.). Pearson Education Limited.
- Hendriks, S., Lyne, M. C., & Chitja, J. M. (2009). Agricultural growth and food security. In S. Hendriks & M. C. Lyne (Eds.), In does food security improve smallholders access a niche market? (pp. 1–10). The African Centre for Food Security.
- Herrero, M., Thornton, P. K., Bernués, A., Baltenweck, I., Vervoort, J., van de Steeg, J., Makokha, S., van Wijk, M. T., Karanja, S., Rufino, M. C., & Staal, S. J. (2014). Exploring future changes in smallholder farming systems by linking socio-economic scenarios with regional and household models. Global Environmental Change, 24(1), 165–182. https://doi.org/10.1016/j.gloenvcha.2013.12.008
- Jansen, H. G. P., Pender, J., Damon, A., & Schipper, R. (2006). Policies and Sustainable Land Use in the Hillside Areas of Honduras: A Quantitative Livelihoods Approach. Agricultural Economics, 34(2), 141–153. https://doi.org/10.2499/0896291561
- Jones, A., Ngure, F. M., Pelto, G., & Young, S. L. (2013). What are we assessing when we measure food security? A compendium and review. Advances in Nutrition, 4(5), 481–505. https://doi.org/10.3945/an.113.004119.disciplines
- Kuku-Shittu, O., Mathiassen, A., Wadhwa, A., Myles, L., & Ajibola, A. (2013). Comprehensive food security and vulnerability analysis: Nigeria. IFPRI Discussion Paper 01275. https://doi.org/10.1017/CBO9781107415324.004.
- Kumbhakar, S. C., & Lovell, C. A. K. (2000). Stochastic frontier analysis. Cambridge University Press. https://doi.org/10.1177/1077558707307580
- Liverpool-Tasie, L. S., Kuku, O., & Ajibola, A. (2011). A review of literature on agricultural productivity, social capital and food security in Nigeria. International Food Policy Research Institute.
- Minten, B., & Barrett, C. B. (2008). Agricultural technology, productivity, and poverty in Madagascar. World Development, 36(5), 797–822. https://doi.org/10.1016/j.worlddev.2007.05.004
- Muraoka, R., Jin, S., & Jayne, T. S. (2018). Land access, land rental and food security: Evidence from Kenya. Land Use Policy, 70(October 2017), 611–622. Elsevier. https://doi.org/10.1016/j.landusepol.2017.10.045
- Negin, J., Remans, R., Karuti, S., & Fanzo, J. C. (2009). Integrating a broader notion of food security and gender empowerment into the African Green Revolution. Food Security, 1(3), 351–360. https://doi.org/10.1007/s12571-009-0025-z
- O’Donnell, C. J. (2010). Measuring and decomposing agricultural productivity and profitability change. Australian Journal of Agricultural and Resource Economics, 54(4), 527–560. https://doi.org/10.1111/j.1467-8489.2010.00512.x
- O’Laughlin, B. (1996). Through a divided glass: Dualism and the Agrarian question in Mozambique. Journal of Peasant Studies, 23(4), 1–39. https://doi.org/10.1080/03066159608438618
- Oyelade, O. A., & Anwanane, N. B. (2013). Ensuring food security in Nigeria. Advances in Agriculture, Sciences and Engineering Research, 1289(8), 78–84.
- Place, F. (2009). Land tenure and agricultural productivity in Africa: A comparative analysis of the economics literature and recent policy strategies and reforms. World Development, 37(8), 1326–1336. Elsevier Ltd. https://doi.org/10.1016/j.worlddev.2008.08.020
- Qureshi, M. E., Dixon, J., & Wood, M. (2015). Public policies for improving food and nutrition security at different scales. Food Security, 7(2), 393–403. https://doi.org/10.1007/s12571-015-0443-z
- Rahn, E., Läderach, P., Baca, M., Cressy, C., Schroth, G., Malin, D., van Rikxoort, H., & Shriver, J. (2014). Climate change adaptation, mitigation and livelihood benefits in coffee production: Where are the synergies? Mitigation and Adaptation Strategies for Global Change, 19(8), 1119–1137. https://doi.org/10.1007/s11027-013-9467-x
- Siddik, M., Kabiraj, S., Shanmugan, J., & Kahota, S. (2015). Assessing smallholder farming and poverty in post-conflict-Sierra Leone. Journal of Finance and Bank Management, 3(1), 156–166. https://doi.org/10.15640/jfbm.v3n1a14
- Simonyan, J. B., Olukosi, J. O., Omolehin, R. A., & Atala, T. K. A. (2012). Productivity and technical efficiency among beneficiary farmers of second national fadama project in Kaduna State, Nigeria. American Journal of Experimental Agriculture, 2 (1), 102–110. Available at. http://www.cabdirect.org/abstracts/20123099862.html
- Smith, L. C. (1998). Can FAO’s measure of chronic undernourishment be strengthened? Food Policy, 23(5), 425–445. https://doi.org/10.1016/S0306-9192(98)00049-9
- Thorbecke, E. (2013). The interrelationship linking growth, inequality and poverty in Sub-Saharan Africa. Journal of African Economies, 22(March 2018), i15–i48. https://doi.org/10.1093/jae/ejs028
- Tijani, A. A. (2006). Analysis of the technical efficiency of rice farms in Ijesha Land of Osun State, Nigeria. Agrekon, 45(2), 126–135. https://doi.org/10.1080/03031853.2006.9523738
- Tscharntke, T., Clough, Y., Wanger, T. C., Jackson, L., Motzke, I., Perfecto, I., Vandermeer, J., & Whitbread, A. (2012). Global food security, biodiversity conservation and the future of agricultural intensification. Biological Conservation, 151(1), 53–59. Elsevier Ltd. https://doi.org/10.1016/j.biocon.2012.01.068
- Wordofa, M., & Sassi, M. (2018). Impact of farmers’ training centres on household income: Evidence from propensity score matching in Eastern Ethiopia. Social Sciences, 7(4), 1–12. https://doi.org/10.3390/socsci7010004
- The World Bank. (2007). Agriculture for development. World Development Report. https://doi.org/10.1596/978-0-8213-7233-3.
- World Food Programme (WFP). (2008). Food consumption analysis. World Food Programme.
- Yahaya, M. K. (2002). Development and challenges of Bakolori irrigation project in Sokoto State, Nigeria. Nordic Journal of African Studies, 11(3), 411–430. https://njas.fi/njas/article/view/351