
Abstract
This paper aims to analyze the efficiency of land transport connectivity for international trade between Thailand and China, focusing on the 4 main routes (R3A, R8, R9, and R12). The study commenced by taking the data of time, cost, and distance for transportation and border process of general cargo with 40 feet containers collected from field surveys and in-depth interviews of 126 key-informants from the 4 countries involved (Thailand, Laos, Vietnam, and China). The data are analyzed, and created the relationship graphics by Time Cost Distance Analysis to evaluate the efficiency of the linkage land transport routes on trade between Thailand and China to identify the bottlenecks/obstacles along the 4 routes. This study will support government agencies in policy decision-making to improve the efficiency of each route. The result found that R9 is the most efficient route due to the low approximate transport cost (3.39 US dollars/km.) and the highest approximate speed (44.52 km./hr.). It is also found that the average Border Process Cost of routes R9, R8, and R12 is approximately 40% of the Total Cost, while the average Border Process Time of each route is approximately 16–25% of the Total Time, which shows that the border process cost and time of each route is quite high compared to operations along the route. Therefore, the government agencies of these 4 countries should jointly formulate policies related to the Border Process in order to develop more efficient land transport connectivity for Thailand and China’s international trade.
1. Introduction
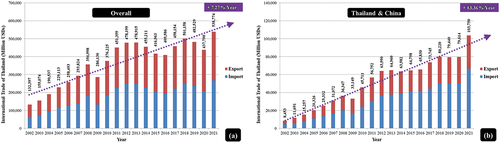
In 2022, the value of international trade between Thailand and other countries (overall) was approximately 538,774 million US dollars which increased 4.07 times from 2002 (132,397 million US dollars) and an average growth rate of 7.27%/year as shown in Figure . Thailand’s top three major trading partners are China, Japan, and the United States, with approximately 19.26%, 11.26%, and 10.43%, respectively. It indicates that China is Thailand’s most important trading partner, with an estimated value of 103.7 billion US dollars, increasing 12.27 times from 2002 (8,453 million US dollars) with an average growth rate of 13.36 %/year, as shown in Figure . The import value (plastic, iron, steel, etc.) and the export value (machinery, fruit, rubber, etc.) are about 64.14% and 36.86%, respectively (Office of Permanent Secretary Ministry of Commerce, Citation2021).
Figure 1. International Trade of Thailand between 2002 to 2021.
Currently, Thailand and China competitiveness rankings are 33rd and 17th in the world, respectively shown in Table . There are 4 main Thailand—China land transport routes, namely R3, R8, R9, and R12. All these routes heading to China pass through the Thailand—Laos border checkpoints, which are the Chiang Khong checkpoint, Bueng Kan checkpoint, Mukdahan checkpoint, and Nakhon Phanom checkpoint shown in Figure . In 2019, there were approximately 93,274 trucks/year, 9,598 trucks/year, 120,403 trucks/year, and 43,326 trucks/year, respectively (Chiangkhong, Citation2020, Buengkan, Citation2020, Mukdahan, Citation2020, Nakhonpanom Customs House, Citation2020).
Figure 2. Thailand – China Land Transport (R3A, R8, R9, and R12).
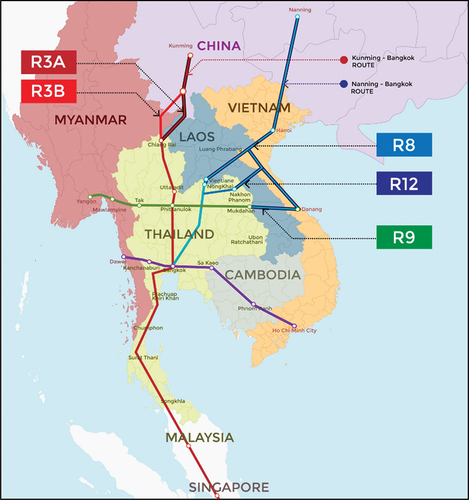
Table 1. Thailand and China Competitiveness Rankings in 2022
The main land transport connectivity for Thailand—China international trade is necessary to analyze the efficiency of transport connectivity for identifying the international transport bottlenecks and obstacles. It also assists policy decision-making in transport facilitation, such as route prioritization and budget allocation for the development of route infrastructures and facilities (UN’s Economic and Social Commission for Asia and the Pacific UNESCAP, Citation2007).
There are various ways to analyze the efficiency of land transport connectivity for international trade in order to take the results for policy decision-making in transportation facilitation; one example is the Multiple Criteria Decision-Making (MCDM) (Shen et al., Citation2022; Đalić et al., Citation2021), SWOT Analysis (Razzokov et al., Citation2022; Sirotić et al., Citation2021; Smolyanivov et al., Citation2019), GLINS Model (Yamaguchi et al., Citation2021), PLS-SEM (Cynthia, Citation2021), Time Cost Distance Analysis (Hao et al., Citation2022; Kawasaki et al., Citation2015), and etc (Lei, Citation2022; Taylor et al., Citation2004). The Time Cost Distance Analysis is a graphical presentation of time, cost, and distance involved in the transport operation to identify inefficiencies and isolate bottlenecks along transport routes by considering the cost and time characteristics of all parts along the transport routes. This method assists the policymakers in comparing the changes in transport required cost and time across different routes. Moreover, it identifies breakdowns of operating cost and time, such as related cross-border processes, which benefits policymakers who focus on policy guidelines on the most significant issues (UN’s Economic and Social Commission for Asia and the Pacific UNESCAP, Citation2007).
Therefore, this paper aims to analyze the efficiency of land transport connectivity for international trade between Thailand and China in 4 main routes, namely R3A, R8, R9, and R12, by Time Cost Distance Analysis to evaluate the efficiencies and bottlenecks/barriers of Thailand—China transport to utilize the information for policy decisions in the transport-facilitation of the government.
These results should be the guidelines of the relative stakeholders, such as government agencies, logistics service providers, shippers, and traders, to match the right operational route with their businesses. Thailand and China government agencies should negotiate with Lao government agencies to facilitate the routes. In addition, this paper is based on the significant reports and research studies related to the multimodal transportation and time-cost-distance model. The data included interviews with more than 100 informants (public and LSPs) in the field of study support from 4 countries (Thailand, Laos PDR, Vietnam, and China). This paper summarises the evidence for the benefits of study support for academic, social, and personal outcomes and identifies the need for further research in this field.
2. Methodology
This article introduces the typical 40 feet container (20–25 tons net load) transportation data, including time, cost, and distance for transportation and border process. Field surveys and in-depth interviews were conducted with the key informants comprising 126 public and logistics service providers (LSPs) from 4 countries (Thailand, Laos PDR, Vietnam, and China) (Table ) to analyze the efficiency of land transport connectivity for Thailand—China trade. Then, the graphical relationship is created according to the Time Cost Distance Analysis method in 4 main routes, which are all heading to China via the Thailand—Laos border checkpoints. These routes are; the Chiang Khong checkpoint, the Bueng Kan checkpoint, the Mukdahan checkpoint, and Nakhon Phanom checkpoint. All 4 routes have the same point of origin, the Talad Thai, located in Pathumthani of Thailand, and navigate in 2 destinations; Kunming, Yunnan (R3A) and Nanning, Guangxi (R8, R9, R12) of China.
Table 2. Key-Informants of In-depth Interviews
3. Results
It is found that the route conditions of Thailand-China routes were a two-lane highway with some damaged road surface, resulting in a long transportation time of 30–41 hrs. (average speed only 50–56 km./hr.), as shown in Table . Moreover, the total costs of general cargo transportation of 40 feet containers, including the border process along the R3A, R8, R9, and R12, are estimated at 6,930 US dollars, 6,250 US dollars, 6,640 US dollars, and 6,040 US dollars respectively. And the total number of hours used is approximately 49 hrs, 44.5 hrs, 44 hrs, and 40 hrs, respectively, with a distance of 2,052 kms, 1,797 kms, 1,959 kms, and 1,694 kms, respectively, as shown in Tables . Figures to Figure and to , show the relationship between cost, time, and distance across routes R3A, R8, R9, and R12, respectively.
Figure 3. R3A Route Time-Cost-Distance Analysis.
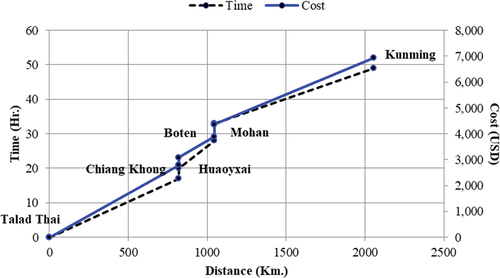
Figure 4. R8 Route Time-Cost-Distance Analysis.
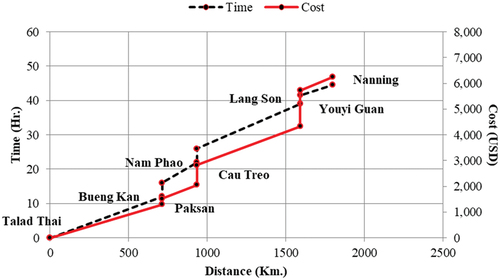
Figure 5. R9 Route Time-Cost-Distance Analysis.
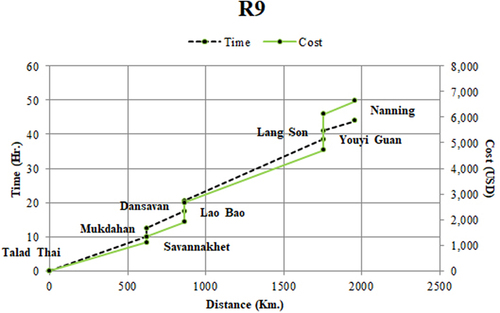
Figure 6. R12 Route Time-Cost-Distance Analysis.
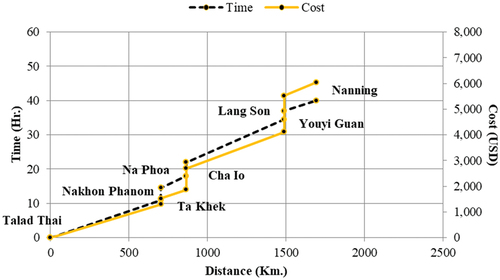
Table 3. Route Conditions of Thailand-China Routes
Table 4. Cost-Distance Comparison of Thailand-China Routes
Table 5. Time-Distance Comparison of Thailand-China Routes
Table 6. Time-Cost-Distance of R3A Route
Table 7. Time-Cost-Distance of R8 Route
Table 8. Time-Cost-Distance of R9 Route
Table 9. Time-Cost-Distance of R12 Route
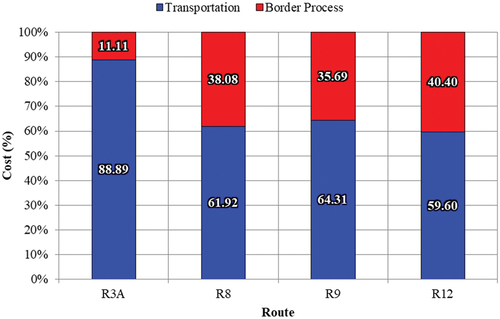
The analysis of the relationship between the cost and distance of 4 routes (Figure ) shows that all routes have a similar Cost Angle. The R3A has the highest transportation cost, about 6,160 US dollars (88.89% of the total cost), followed by R9, R8, and R12. The analysis also shows that although the distance of R3A is 4–18% longer than other routes, the transportation cost is approximately 30–42% or almost 3 times higher. In addition, considering the border process, R12 has the highest cost, about 2,440 US dollars or 40.40% of the total cost, followed by R8, R9, and R3A, as shown in Figures . The checkpoints with the highest cost are Lang Son-Youyi Guan checkpoint (R8, R9, and R12) and Boten-Mohan (R3A), with an estimated cost of 1,400 US dollars and 470 US dollars, respectively. The cost of the border process in these routes are approximately 3 times higher than R3A. However, when considering the average cost per checkpoint in each route, it was found that R3A, R8, R9, and R12 have an average of 385, 793, 790, and 813 US dollars, respectively; this means each route (R8, R9, and R12) cost 12.69%, 11.90%, 13.47% respectively, the total cost in each route, only about twice higher than R3A (5.56%).
Figure 7. Cost-Distance Analysis.
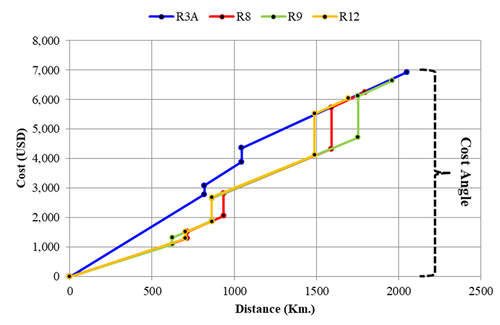
Figure 8. Cost Analysis (USD).
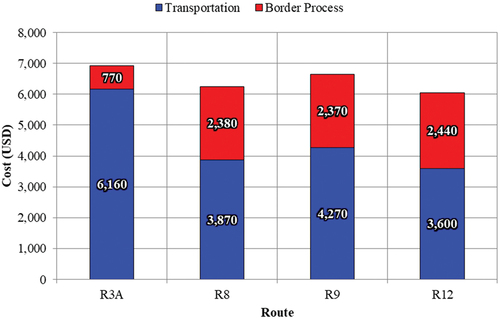
Figure 9. Cost Analysis (%).
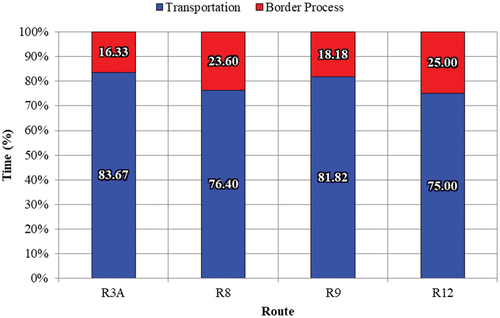
Analyzing the relationship between time and distance in each route (Figure ) shows that R3A and R8 have the highest Time Angle (slight difference), followed by R9 and R12. The R3A has the highest Travel Time, approximately 49 hrs (83.67% of overall travel time), followed by R8, R9, and R12. The results show that although the distance of R3A is only 4–18% longer than other routes, the travel time is approximately 12–27% which is almost twice higher than other routes. In the area of the border process, it was found that R8 and R12 had the highest operating time of about 10 hrs, or approximately 25% of the overall travel time, followed by R3A and R9 shown in Figures . The checkpoints with the highest time in each route are Boten-Mohan (R3A), Bung Kan-Paksan and Nam Phao-Cau Treo (R8), Dansavan- Lao Bao (R9), and Na Phoa-Cha Io (R12(with border process-time approximately 5 hrs, 4 hrs, 3 hrs, and 4 hrs, respectively. And the average time at the checkpoint in each route is 3–4 hrs.
Figure 10. Time-Distance Analysis.
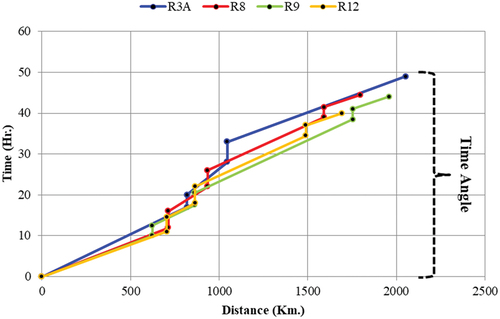
Figure 11. Time Analysis (USD).
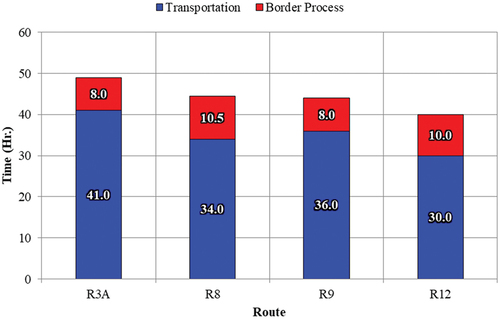
Figure 12. Time Analysis (%).
The Approximate Transport Cost per Kilometer, dividing the total cost by total distance, indicates that R3A has the lowest transportation cost, about 3.38 US dollars/km, followed by R9, R8, and R12 which are 3.39, 3.48, and 3.57 US dollars/km, respectively. And the analysis of Approximate Speed by dividing the total distance by total time, shows that R9 has the highest transport speed, approximately 44.52 km/hr, followed by R12, R3A, and R8, with 42.35, 41.88, and 40.38 km/hr, respectively, as shown in Table .
Table 10. Approximate Transport Cost and Approximate Speed of Thailand-China Routes
4. Conclusion
The analysis of the efficiency of land transport connectivity for international trade between Thailand and China using Time Cost Distance Analysis on 4 main routes (R3A, R8, R9, and R1) is presented in the graphics of Time, Cost, and Distance related to the transportation operating process. It also analyze the efficiency of transport connectivity and identify the bottlenecks along the transportation routes between Thailand and China by considering all parts of cost and time characteristics along the transport routes. These will assist the related policymakers to compare the difference in the necessary cost and/or time for several transportation routes. The results are also taken to make the policy decisions for the public facilitation of transportation. The analysis results found that R9 is the most efficient route due to the low Approximate Transport Cost (3.39 US dollars/km) and the highest Approximate Speed (44.52 km/hr), followed by R3A, R12, and R8. It is also found that routes R9, R8, and R12 have an average Border Process Cost of about 800 US dollars/checkpoint, or approximately 40% of the total cost, which is estimated twice higher than R3A (385 US dollars/checkpoint). The Border Process Time of each route is approximately 3–4 hrs/checkpoint or approximately 16–25% of the total time (one-fourth). These show that the land transport route between Thailand and China is a relatively high cost, and the time of the border process is longer compared to operation along the route. Furthermore, the land transportation routes have some limitations; Thailand operates on left lanes, while Lao, Vietnam, and China operate on right lanes. Additionally, there are different customs regulations among 4 countries, as well as different country times and different truck load limits. This research innovation focused on the cost and time per activity (checking point and distance between nodes), and the characteristics of cost and time along Thailand-China- land transportation routes. Therefore, government agencies of the 4 countries in the routes (Thailand, Laos PDR, Vietnam, and China) should establish joint policies on the border process, such as the adoption of technology, reducing the duplication of the inspections of both countries in the border area. As well as improving border facilitation (such as logistics Infrastructure, logistics services, etc.) and creating common customs procedures in order to make the land transport connectivity for international trade routes between Thailand and China more efficient.
Acknowledgments
This research work was partially supported by Faculty of Logistics and Digital Supply Chain, Naresuan University, including ASEAN Logistics Academic Network (ALA), Thailand.
Disclosure statement
No potential conflict of interest was reported by the authors.
References
- Buengkan Customs House. (2020). Retrieved on 15 May. 2022 from http://buengkan.customs.go.th/data_files/6242b23646de610686b97c984d792a76.pdf
- Chiangkhong Customs House. (2020). Retrieved on 15 May. 2022 from https://www.chiangkhongcustoms.com/mainsite/wp-content/uploads/2021/01/%E0%B8%A3%E0%B8%96%E0%B8%A2%E0%B8%99%E0%B8%95%E0%B9%8C%E0%B8%AA%E0%B9%88%E0%B8%A7%E0%B8%99%E0%B8%9A%E0%B8%B8%E0%B8%84%E0%B8%84%E0%B8%A5-1.xlsx
- Cynthia, S. D. (2021). The effect of transport and logistics on trade facilitation and trade: A PLS-SEM approach. ECONOMICS, 9(2), 11–11. https://doi.org/10.2478/eoik-2021-0021
- Đalić, I., Stević, Ž., Ateljević, J., Turskis, Z., Zavadskas, E. K., & Mardani, A. (2021). A novel integrated mcdm-swot-tows model for the strategic decision analysis in transportation company (Vol. 19). University of Nis.
- Hao, X., Ou, S., Lin, Z., He, X., Bouchard, J., Wang, H., & Liguo, L. (2022). Evaluating the current perceived cost of ownership for buses and trucks in China (Vol. 254). Elsevier Ltd.
- International Institute for Management Development (IMD). (2022). IMD World Competitiveness Booklet 2022. Retrieved on 15 December. 2022 from https://imd.cld.bz/IMD-World-Competitiveness-Booklet-2022.
- Kawasaki, T., Hanaoka, S., & Nguyen, L. X. (2015). Inland cargo flow modelling considering shipment time variability on cross-border transport (Vol. 38). Routledge.
- Lei, H. (2022). A Study on China-ASEAN Cross-Border E-Commerce Logistics Based on the New International Land-Sea Trade Corridor. Association for Computing Machinery.
- Mukdahan Customs House. (2020). Retrieved on 4 May. 2021 from http://www.danmuk.org/index.php?lay=show&ac=article&Id=2147552135
- Nakhonpanom Customs House. (2020). Retrieved on 15 May. 2022 from http://nakhonphanom.customs.go.th/data_files/947237aa440e29cb73ba73ecd6875fc3.pdf
- Office of Permanent Secretary Ministry of Commerce. (2021). Retrieved on 15 May. 2022 from https://tradereport.moc.go.th/Report/Default.aspx?Report=TradeThBalanceYearly
- Razzokov, J. I., Khatamova, M. S., Sapaev, B., & Saltov, E. B. (2022). Integrated Approach for Freight Transportation in Uzbekistan. (2432). American Institute of Physics Inc.
- Shen, L., Zin Chaw, S., Yang, X., Wang, C., & Jing, K. (2022). Study on evaluation of transport routes between China and Myanmar in the context of Belt and Road Initiative by fuzzy AHP-TOPSIS (Vol. 14). Inderscience Publishers.
- Sirotić, M., Žuškin, S., Rudan, I., & Stocchetti, A. (2021). Methodology for the sustainable development of the Italy-Croatia cross-border area: Sustainable and multimodal/cross-border passenger services. Volume 13. MDPI.
- Smolyanivov, A., Yushkova, S., & Sirina, N. (2019). Transport infrastructure condition for organizing piggyback traffic (Vol. 403). Institute of Physics Publishing.
- Taylor, J. C., Robideaux, D. R., & Jackson, G. C. (2004). U.S.-Canada transportation and logistics: Border impacts and costs, causes, and possible solutions. Transportation Journal, 43(4), 5–21.
- UN’s Economic and Social Commission for Asia and the Pacific (UNESCAP). (2007). Retrieved on 15 May. 2022 from https://unctad.org/system/files/non-official-document/aldc2019_ethiopia_servicestrade_Valentine2_UNCTAD_en.pdf
- Yamaguchi, T., Shibasaki, R., Samizo, H., & Ushirooka, H. (2021). Impact on Myanmar’s logistics flow of the east–west and southern corridor development of the Greater Mekong Subregion—a global logistics intermodal network simulation (Vol. 13). MDPI AG.