
 ?Mathematical formulae have been encoded as MathML and are displayed in this HTML version using MathJax in order to improve their display. Uncheck the box to turn MathJax off. This feature requires Javascript. Click on a formula to zoom.
Abstract
Criminal issues receive special attention from the public to researchers. The presence of crime has a detrimental impact on the surrounding environment. Therefore we are motivated to conduct research to look at the causes of crime from a different perspective, namely macroeconomics. This study examines the effect of macroeconomic variables such as inequality, income per capita, inflation, and unemployment on crime in Indonesia. The methods used are Autoregressive Distributed Lag (ARDL), FMOLS, and DOLS from 2000–2019. The research data utilized sources from the Central Bureau of Statistics and the World Development Indicators. The latest research using this method finds that inequality, inflation, and unemployment have a significant positive effect in the long run, while income per capita has a significant negative effect. Meanwhile, short-term estimates find consistent signs of income per capita and inequality that have a significant effect. Interestingly, inflation and unemployment have no effect on crime. On the other hand, inequality and income per capita were found to have an effect in the short term. Therefore, policymakers take action to increase equity, improve the economy, control inflation, and create jobs to reduce crime.
Public Interest Statement
Crime is an important issue in social circles. The presence of criminals creates something that is not good and has a negative impact. Crime does not appear by itself, there are factors that encourage it. One of the triggers for crime is due to economic factors such as income, inequality, unemployment, and inflation. This study examines macroeconomic factors affecting crime in Indonesia from 2000–2019. The results found that macroeconomic fluctuations have a serious impact on crime, especially in the long term. These findings are expected to become important material for the government as a policymaker so that the problem of crime can be reduced by encouraging the economy, equalizing inequality, reducing unemployment, and maintaining inflation stability.
1. Introduction
Crime-related issues have emerged as an interesting topic for scholars in recent years. The rampant increase in crime has seriously threatened the economy and society (Wahyu et al., Citation2021). In the current era, solving criminal issues is one of the priorities of Point 16 in the Sustainable Development Goals (SDGs) concerning peace, justice, and strong institutions by encouraging a just, peaceful, and inclusive society. Point 16 of the SDG reflects every individual’s hope. At first glance, crime issues appear solvable by giving punishment, such as a prison sentence or imposing a fine (Braun, Citation2019; Li et al., Citation2019). In reality, solving crimes is challenging and increasingly complex. Crime continues to occur regardless of time, especially when the economy is not improving (Goulas & Zervoyianni, Citation2015; Rosenfeld & Fornango, Citation2007).
Crime is not restricted to developed countries but also occurs in developing countries, one of which is the Indonesia. According to the Indonesian Central Bureau of Statistics (BPS, Citation2021), Indonesian crime statistics are experiencing a positive trend. Figure shows the data for the year 2000, which was the first record to indicate that the number of criminal cases reached 172,000. Within seven years, the cases increased by almost 100%, totaling 330,000 cases. The highest peak of cases occurred in 2017, with 357,000 cases. This significant increase has created a sense of concern among the public, so efforts are needed to suppress this problem so it does not continue to grow (Wijaya & Halim, Citation2020). The emphasis on this case was effective in 2017, when the government began to emphasize the imposition of sanctions for the perpetrators so they would not repeat it. In 2020, the number of cases decreased significantly to 247,000. The number of cases is predicted to continue to decline in the following years.
Figure 1. The number of criminal cases in Indonesia from 2000–2020.
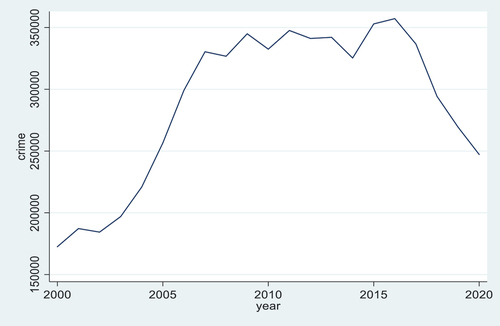
The interesting point from Figure is why has crime in Indonesia increased so drastically from year to year? It is known that the average crime rate in Indonesia is 290,938 cases per year. This figure is a large number and is very dangerous for the social environment if it is not resolved. Crime does not appear by itself, but some factors encourage it. One is the effect of macroeconomic instability in the country (Rosenfeld & Fornango, Citation2007). Macroeconomics provides an indirect picture of social conditions in a region. If the macro economy is problematic, social conditions will inevitably be problematic.
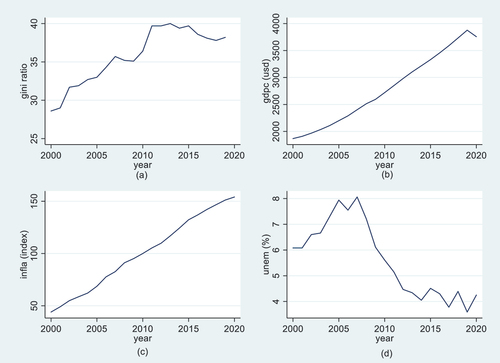
Indonesia is the fourth most populous country in the world with. economy grows positively at an average of around 5% per year (BPS, Citation2021). Although economic growth is part of the macroeconomic indicators, several other indicators, such as unexpected development inequality, where both have increased. Figure shows that the macroeconomic indicator of inequality in Indonesia is almost in the range of 0.4. Meanwhile, income and inflation increased simultaneously. However, in 2020 inflation still rise when income per capita decrease (Figure ).
Figure 2. Indonesia’s macroeconomic development trends from 2000–2019.
Several literature studies state that macroeconomic variables and crime have a close relationship. Studies such as Li et al. (Citation2019) and Hazra (Citation2020) found a positive relationship between inequality and crime. Furthermore, Dutta et al. (Citation2020) and Hazra (Citation2020) found a positive relationship between income per capita and crime, but Veysel et al. (Citation2018) and Anser et al. (Citation2020) found a negative relationship. While inflation was pioneered by Rosenfeld and Fornango (Citation2007), Rosenfeld and Levin (Citation2016), Rosenfeld et al. (Citation2019) found inflation to be a trigger for the crime. At the same time, unemployment has a positive relationship with the crime by Britto et al. (Citation2022) and Wang and Hu (Citation2022). Based on this situation, the researcher takes the formulation of the problem of whether macroeconomics, such as inequality, per capita income, inflation, and unemployment, have a relationship with a crime in Indonesia? Does this relationship matter in the short and long term?
The present study contributes significantly to the literature on crime but from a different perspective. First, this research contributes to the complex side of the literature on crime. Second, criminality and economic variables have been studied for a long time by different scholars, such as Tang and Lean (Citation2007), Fallahi et al. (Citation2012), Rosenfeld (Citation2014), Anser et al. (Citation2020), Hazra (Citation2020), and Khan et al. (Citation2020) with a separate analysis. The present study simultaneously analyzes the conditions of inequality, income per capita, inflation, and unemployment. To the best of the researchers’ knowledge, such a study has never been undertaken. Third, the present study econometrically provides a new view (short-term and long-term) through the Autoregressive Distributed Lag (ARDL) method. Most study Indonesia using panel data as analysis such as Hendri (Citation2014), Rahman and Prasetyo (Citation2018), Armin and Idris (Citation2020). Fourth, relatively few studies exist on crime in developing countries, particularly Indonesia.
This paper has been organized systematically. The first part discusses the concept of crime and provides an overview of the study. Subsequently, the second part comprises a literature review focusing on the causes of crime, while the third part emphasizes econometric data and strategies. The fourth part covers the results and discussion, whereas the final part offers the study’s conclusions and policy implications.
2. Literature Review
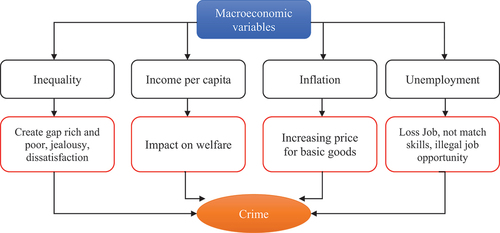
This section is further separated into four main sub-sections where each section reviews the relevant theory and empirical literature. An outline of the interrelationship of these variables is shown in the Figure .
Figure 3. Frame Macroeconomics on crime.
2.1 Inequality and crime nexus
Inequality is described as a tension between individuals or groups in the population. Inequality is important in economic development because it measures how much income is distributed between the rich and poor (Nazli et al., Citation2021). High inequality creates individual jealousy of the rich, which makes it possible for these (poor) groups to commit crimes (Fachrurrozi et al., Citation2021). Measurement of inequality can be seen from the Gini coefficient with a range of 0 to 1. According to Todaro and Smith (Citation2015), an indicator of inequality is high if it exceeds 0.5 meanwhile. The range 0.1–0.3 is still considered to have no inequality.
The link between the two was first carried out by Becker (Citation1968), where a series of criminal activities has a positive relationship with inequality. Enamorado et al. (Citation2016) mentions the rise of drug trafficking in Mexico due to income distribution factors that are not following work. This finding is also corroborated by Clément and Piaser (Citation2021) with the 2SLS model. Li et al. (Citation2019) conducted a relationship between the two in China and found that inequality positively affected crime—similar findings by Hazra (Citation2020) in India with a Random Effects Model (REM). Corvalan and Pazzona (Citation2022) looks at another effect of inequality that creates crime and increases personal protection against crime. Of course, self-protection costs will be more expensive.
However, this positive relationship is not always a consensus. Among them, such as Brush (Citation2007) found a negative relationship in the United States based on cross-sectional data. Meanwhile, Hendri (Citation2014) with the Fixed Effect Model (FEM) found that inequality did not affect crime in Indonesia. Simple regression testing by RS and Syahputri (Citation2016) found that inequality positively impacted crime in North Sumatra. The study was re-examined by Hardiawan et al. (Citation2019) using National Survey microdata. Analysis based on the spatial econometric method found inequality to have a significant positive effect.
2.2 GDP per capita and crime nexus
Income is a measure of welfare. The higher the income, the higher the individual’s ability to consume daily needs (Anser et al., Citation2020). In the micro perspective, the income measurement is reviewed by wages, while the macro perception uses the GDP per capita indicator. The higher the income per capita, the more prosperous the country is and vice versa. Several previous studies tried to confirm the relationship but found no consistency. In theory, it is explained that if a person has a better income, the tendency to commit crimes will be lower (Fone et al., Citation2023). Nevertheless, in an empirical approach, Anser et al. (Citation2020) found income per capita to have a negative sign but not significant. Meanwhile, Veysel et al. (Citation2018) found income per capita to have a reciprocal relationship with crime.
Furthermore, Dutta et al. (Citation2020) found a difference from the others where income per capita positively affects juvenile delinquency in the State of India. Juvenile delinquency also occurs based on the level of regional income. If the income per capita is low, the delinquency will also be low. His acquaintances are rife with teenagers in urban areas with high income per capitas. Furthermore, Hazra (Citation2020) found that income per capita has a significant positive effect. Freedman and Owens (Citation2011) argue that crime can be reduced if the government provides subsidies for low-income groups in the United States. With subsidies, the costs for the needs of the poor will decrease.
2.3 Inflation and crime nexus
Inflation is defined as an increase in the prices of goods in general (Mankiw, Citation2016). In theory, an increase inflation weakens purchasing power (Rosenfeld, Citation2014). Those with high incomes tend to experience a slight decline in consumption. However, for those with low incomes, their consumption ability will decrease drastically below the standard of living needs. Inflation is seen as an independent way of motivating behaviour to commit crimes compared to other socioeconomic conditions (Rosenfeld & Levin, Citation2016).
Several studies on inflation and crime have been conducted, such as Tang and Lean (Citation2007). This paper uses the bound test and modified Wald test approaches. The results of his research found that inflation has an effect in the long term but not in the short term. Gillani et al. (Citation2009) found that inflation can encourage crime in Pakistan. Using the error correction model method, Rosenfeld and Levin (Citation2016) tested both variables. His findings explain that inflation only impacts the long term, but inflation had no effect during the 2008–2009 economic recession. Rosenfeld et al. (Citation2019) start with a larger sample space in the United States, namely 17 cities from 1960 to 2013. Their latest findings explain that inflation has a significant effect. The latest study by Adekoya and Razak (Citation2016) through the ARDL model in Nigeria explains that inflation strongly impacts acts of robbery, fraud and arson in the long term. Rosenfeld and Vogel (Citation2021) repeated the consistency of this positive effect using the random effects model method. They found that current inflation and future predictions significantly impact crime. However, contrasting findings by Hazra (Citation2020) explain that inflation does not trigger crime in India.
2.4 Unemployment and crime nexus
Unemployment is the workforce looking for work (Mankiw, Citation2016). Mankiw (Citation2016) explains that unemployment is because it takes time to match workers with jobs. Workers have different preferences and abilities, and jobs have different characteristics. Meanwhile, the flow of information about prospective employees and job vacancies could be better, and the geographical mobility of workers is not instantaneous. For this reason, finding the right job takes time and effort because different jobs require different skills and pay. Unemployment caused by the time it takes people to find a job is called frictional unemployment. In addition, unemployment occurs due to unpredictable economic situations such as a crisis (Liotti, Citation2020) or the COVID pandemic (Antipova, Citation2021; Dergiades et al., Citation2022; Schleimer et al., Citation2022). In the case of a pandemic, restrictions on human activity are carried out so as not to spread disease outbreaks, so companies take steps to reduce labour (Ardiyono, Citation2022).
Those who lose their jobs will also lose their income. This situation could be more favourable because the necessities of life must be met. If someone does not get a job within a specific time, the alternative to surviving is committing a crime (Britto et al., Citation2022). Several studies, such as the results of empirical testing such as Gillani et al. (Citation2009) with the Toda-Yamamoto approach, found that unemployment has a one-way effect on crime. Veysel et al. (Citation2018) did something similar in Turkey. His study found that causality and crime have a causal relationship. Anser et al. (Citation2020) found that unemployment had a significant positive effect on crime. The findings were based on the two-step System Generalized Method of Moment (SYS-GMM) approach. Meanwhile, Britto et al. (Citation2022) analyzed the effect of job loss on crime in Brazil, where job loss can encourage someone to commit crimes in various age groups. A study in China by Wang and Hu (Citation2022) with the FEM and REM models found that an increase in unemployment had a significant positive impact on crime, with an increase of 0.67% to 0.7%. Studies in Indonesia by Rahman and Prasetyo (Citation2018) and Armin and Idris (Citation2020) find different conclusions. Both use the FEM method, where Rahman and Prasetyo (Citation2018) found a positive sign, while Armin and Idris (Citation2020) are known to have a negative effect.
2.5 Literature gap
After summarizing the relevant studies in the literature, the gaps in the empirical literature can be identified as follows: (a). The literature on crime and macroeconomics shows that there are conflicting findings between previous studies so that the results are inconsistent. (b) it is clear that there are still very limited studies on crime in Indonesia. (c) Most of the previous studies used the panel model approach as an analysis. Based on the gaps that have been described, we are motivated to research criminality determination using the time series model ARDL approach from 2000 to 2019 in Indonesia. This method provides important information about the impact of macroeconomic variables in the short and long term.
3. Data and econometric strategic
3.1 Data
Due to limited data, the study uses data from 2000 to 2019 with 20 observation. This limitation is often found in data, especially in annual data and become obstacles in regression. One of the reasons is that a small sample indicates inconsistent results and bias (Bali & Demirtas, Citation2009). According to Riveros Gavilantes (Citation2020) by using the bootstrap method, a minimum sample size of 20 is still feasible to use and produces consistent coefficients. The research data used are crime (Crime), real income per capita (Gdpc), inequality (Gini),, inflation (Infla), and unemployment (Unem). The crime-relate data were derived from the Indonesian Central Bureau of Statistics (BPS),, while inequality, inflation, and unemployment data were acquired from the World Development Indicator by World Bank. A more detailed explanation of the data can be seen in Table . We follow this research model from Hazra (Citation2020) as follows:
Table 1. Definition of variables used in study over the period 2000–2019
Data transformation in natural logarithms for empirical purposes was utilized (Farooq et al., Citation2013). Data utilization can provide efficient results (Shahbaz, Citation2012) because it reduces the problems of normality, autocorrelation, heteroscedasticity, and multicollinearity (Fachrurrozi et al., Citation2022; Ikhsan et al., Citation2022). Inflation and unemployment are not transformed because the data is in index and percentage. The transformation is formed as follows:
Where,
ln = Natural logarithm
Gini = Inequality
Gdpc = Income per capita
Infla = Inflation
Unem = Unemployment
= Regressor coefficient
e = Residual, which is assumed to be normally distributed with zero mean and limited variance
3.2 Econometric strategic
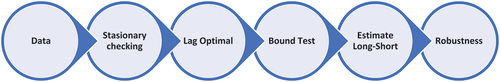
In order to achieve research objectives, this paper applies the ARDL model developed by Pesaran et al. (Citation2001) to assess the short-term and long-term effects of inequality, income per capita, inflation, and unemployment on crime in Indonesia. The determination of the model has been tested beforehand in order to avoid mistakes in analyzing. According to Odhiambo (Citation2009) and Shrestha and Bhatta (Citation2018), the ARDL method has unique and significant differences. First, the ARDL model can be cointegrated without assuming uniform integration of I(0) or I(1). Second, this cointegration test is unlike the Johansen method, which uses a large sample, and the cointegration test using the bound test can be done with a small sample. Third, the estimation results of the ARDL model are not biased in the long run, although the independent variables are endogenous. Fourth, the ARDL model estimator uses the Ordinary Least Square (OLS) estimator. Base on equation (2), we can derive the ARDL cointegration model as follows Figure :
Figure 4. Framework Research.
Where,
Δ = First-difference
= Long-term coefficient
,
,
,
, and
= Short-term coefficient
= Constant
t = Year
i = Optimal lag uses the Akaike Information Criterion (AIC) criteria ε = White noise
In order to determine the relationship between the short-term and the long-term, the bound cointegration test is used. Pesaran et al. (Citation2001) explained the possibilities of the results of this test:
Cointegration exists if the F-stat is greater than the upper and lower bands.
If the F-stat is below the upper and lower bands, cointegration will not occur.
There is no conclusion if the F-stat is between the upper and lower bands.
Regarding the sample, the number of samples in this study is small (20 samples). Thus, the critical value calculation is based on Narayan (Citation2005).
If cointegration exists, the next step is to estimate in the form of an Unrestricted Error Correction Model (UECM). This model aims to estimate the short run and the correction value due to time disturbances. The Error Correction Term (ECT) value is expected to be negative, indicating the occurrence of convergence. The specifications of this UECM model are as follows:
Given that the ARDL model uses the OLS estimator, several assumptions are needed, such as normality, heteroscedasticity, and autocorrelation. Subsequently, stability testing is also needed, such as the cumulative sum of recursive residues (CUSUM) and the cumulative sum squared (CUSUMSQ) of recursive residues to view the consistency of long-term and short-term estimates. The robustness model is employed to check the consistency coefficient. Figure represents the model to perform this step. To process this econometric, we used Eviews and STATA statistical program.
4. Result and discussion
4.1 Descriptive statistics and correlation matrix
The initial stage in analyzing the data is to assess the data as a whole atau statistik deskriptif. Descriptive statistics aim to summarize data from a sample. In addition, descriptive statistics aim to explore data (Appiah et al., Citation2022). Table provides summary statistics for all variables. Research data in Table still in raw form. The average crime cases in Indonesia reached 290,938 cases, while the average inequality was 35.74. Besides, the average income per capita was 2,737 dollars, the average inflation index was 97.49, and the average unemployment was 5.68%. The volatility of data fluctuations can be viewed from the standard deviation. The fluctuation in crime data is quite high, with 64.459, followed by an inflation index of 64.53. The dispersion of data reflected by Jarque-Bera explains that all data is normally distributed because the probability is above 0.05. Distribution of data with Skewness finds values close to 0 where the data is normally distributed. Meanwhile, the curtois value is positive which indicates the data tends to be homogeneous.
Table 2. Descriptive statistics
Furthermore, Table shows that the correlation matrix provides an overview of crime, inequality, income per capita, and inflation. The correlation between inequality and crime has a positive sign. The income per capita has a positive relationship with inequality. Furthermore, inflation and crime are positively related. A negative correlation was found between unemployment and crime. Most of these correlations were found to be more than 85%, which means that there is a close relationship between macroeconomic variables and crime.
Table 3. Correlation matrix
4.2 Stationarity testing
Similar to other time series models, data stationarity testing is needed to avoid mistakes in choosing a model. The Kwiatkowski-Phillips-Schmidt-Shin (KPSS) approach was used because it is appropriate for small samples (Afriyie et al., Citation2020). The KPSS hypothesis differs from the Augmented Dickey-Fuller (ADF) and Phillip-Perrons (PP), where the null hypothesis is stationary, whereas the alternative hypothesis is a unit root. The ARDL model has different or mixed stationary conditions between levels and the first difference. Based on Table , the crime and inequality variables were stationary at the first difference level. Nevertheless, income per capita, inflation and unemployment were stationary at this level. The different findings of this integration state that the ARDL model is feasible.
Table 4. Unit Root Test
4.3 Optimal Lag Testing
Optimal lag testing is an important part of the ARDL model. Lag plays an important role in presenting information dynamically to get the right results. In the ARDL model, the lag between variables has a different number of lags. Unlike VAR and VECM, where the use of lag is static for all variables. We perform lag testing using the Akaike Information Criterion (AIC) approach. The optimal lag selection decision is assessed based on the smallest value. Table show result optimal lag for model crime. The best lag modeling simulation with Eviews found more than 100 models. Table only shows the 5 best models based on the order of AIC values. Model 104 is the best model with the smallest value compared to the others with lag 1,2,0,1,1.
Table 5. Optimal Lag result
4.3 Cointegration testing
The next step is to test the cointegration of the criminality model. Cointegration testing in research was undertaken using the bound test by Pesaran et al. (Citation2001). The principle is similar to Johansen’s cointegration, namely looking at long-term relationships. Nevertheless, the bound test is more appropriate when there are differences in stationarity and small samples. Considering that the present research sample is small, the critical value by Narayan (Citation2005) was utilized. The test results are shown in Table , where the F-statistic value of 8.63 is higher than the critical value of 1%. The conclusion drawn is that cointegration exists in the criminality model.
Table 6. Cointegration Bound Test
4.4 Long-term and short-term estimation
After identifying cointegration, the next step is estimating the crime model’s long and short-term. The estimation results for both are presented in Table . One of the important points in the dynamic estimation is the sign of the coefficient stability in the short term to the long term. The goal is to see changes from one time to another in the future. However, the tendency to get inconsistent signs can occur. Our findings find signs consistent and in line with expectations from the short to the long term. It can be seen that inequality, inflation, and allergic responses have a positive sign, while income per capita has a negative effect. In the long-term section explaining inequality was found to have a significant effect on crime at a significance level of 1%. If inequality increases by 1%, crime will increase by 5,003%, assuming ceteris paribus.
Table 7. Long-term and short-term estimation results
Furthermore, income per capita was found to be a coefficient of −5.08 and had a significant effect at a significance level of 5%. This can be interpreted if per capita income increases by 1%, then crime decreases by 5.08%, assuming ceteris paribus. The macroeconomic inflation indicator was found to have a significant positive effect at a significance level of 10% where an increase in inflation of 1% would impact an increase in crime by 0.03%, assuming ceteris paribus. Lastly, unemployment were found to be significant, with a significance level of 5%. This can be explained if the response increases by 1%, then crime will increase by 0.13%, assuming ceteris paribus. The long-term estimation results explain the greatest impact on inequality and income per capita compared to inflation and unemployment.
In Table , the short-run estimate finds the same sign as the long-run for each independent variable. Nonetheless, statistically, only two variables influence crime, namely inequality and income per capita. The effect of inequality is positive and significant at the 1% level. If inequality increases by 1%, crime will increase by 1.8%, assuming ceteris paribus. Income per capita has a significant positive effect at the 5% level. If income per capita increases by 1%, crime will decrease to 2.9% assuming ceteris paribus. Interestingly, the effects of inflation and unemployment are found to be insignificant in the short run. This is different from the findings in the long term. The effect of inequality and income per capita on crime in the short term is elastic because the impact is greater if there is a change in the variable. The ECM coefficient is found to have a negative sign and as expected. The four variables have an influence in the long run. This imbalance will be corrected by 0.58 or need 6.96 month to reach equilibrium. This ECM is moderate because it does not take long to adjust.
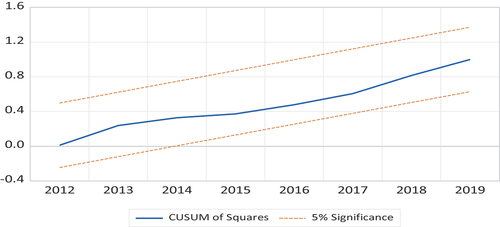
In order to strengthen the results, the results of testing the OLS assumptions and model stability were included. The probability of testing for normality, autocorrelation, and heteroscedasticity was found to be above 0.05 to ensure that the estimation found was efficient (see Table ). An additional tool in this research model was the stability test in the form of CUSUM and CUSUMQ. The test results are shown in Figures reveals the estimation line between the red lines. It can be concluded that the estimated coefficient is stable in the long run.
Figure 5. Cusum.
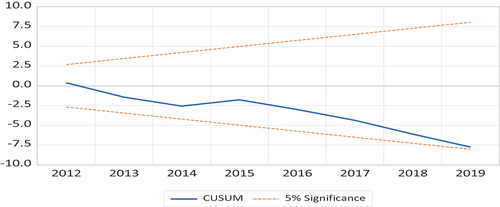
Figure 6. Cusumq.
4.5 Robustness model
In the final part of this empirical finding, the reliability of the model was tested in terms of Full Modified OLS (FMOLS) from Pedroni (Citation2001) and Canonical Cointegrating Regressions (CCR) from Park (Citation1992). Both methods estimate the coefficients in the long term and as a means of reliability. Table provide information about both estimation. Inequality has a significant positive effect on crime. That mean, The increase in crime is 2.8–2.9% if inequality increases by 1%. Nevertheless, income per capita was found to have a significant effect. The coefficient range of income per capita for both models is quite large, between −3.4% to −4.1% if income per capita increases by 1%. The findings on the inflation variable are very stable in both models, namely 0.023% and 0.027%. Statistically, both have an effect at the 10% level. Similar findings also show that unemployment has a significant effect, with 0.066% by FMOLS and 0.053% by CCR. Although there are differences in the estimation of the coefficients, in the long run, the reliability of the model is highly tested, where overall, the variable coefficients are very consistent.
Table 8. Robustness Model (FMOLS & CCR)
4.6 Discussion
Macroeconomics and crime have a strong relationship in the long term. This relationship can be seen from the significant cointegration results. In other words, the movement of macroeconomic variables has an essential role in the crime, and the two are inseparable. The long-term and short-term findings explain that inequality can encourage crime by 1.8% and 5,003%. This finding is in line with RS and Syahputri (Citation2016), Li et al. (Citation2019), Hardiawan et al. (Citation2019), Hazra (2019), and Clément and Piaser (Citation2021) but differ from the findings of Hendri (Citation2014). Inequality is problematic in the world of development. Resolving inequality is difficult because economic development focuses more on specific points and sees few groups. So naturally, social jealousy arises (Goda & Torres García, Citation2018). For example, more economic activity occurs in urban than rural areas. Urban and rural conditions differ in education, health, and employment opportunities (Sugiharti et al., Citation2023). Those with a higher social status get access to it more quickly than the poor group, so efforts to survive are carried out in a wrong way (Fachrurrozi et al., Citation2021). Enamorado et al. (Citation2016) reveal that inequality will provide a potentially dangerous in social cause because people will choose illegal paths.
Nevertheless, the coefficient of income per capita was found to have a decrease in crime by 5.08% assuming ceteris paribus. This finding is in line with Veysel et al. (Citation2018) and Anser et al. (Citation2020) but contradic finding by Dutta et al. (Citation2020) and Hazra (Citation2020). The income per capita is an important factor in determining an individual’s efforts in looking for money from the aggregate side. When income is weak, the ability to meet daily needs is insufficient. If income per capita increases, an individual’s tendency to commit crimes will decrease (Veysel et al., Citation2018).
Furthermore, the inflation coefficient found inflation increases by 1%, crime will increase by 0.03% with the assumption ceteris paribus. This study is in line with Yasir et al. (Citation2009), Adekoya and Razak (Citation2016), Sunday (2016), Rosenfeld and Levin (Citation2016), and Rosenfeld et al. (Citation2019). Inflation is an increase in the price of goods in general. The increase in the price of goods causes an individual’s purchasing power to decrease if the income they receive while working does not change. This position is very risky for those who do not have a permanent job and fixed income (Fachrurrozi et al., Citation2021). Furthermore, The finding of the unemployment explains that crime will increase by 0.13% if unemployment increases by 1%, assuming ceteris paribus. This finding is in accordance with Tang and Lean (Citation2007), Fallahi et al. (Citation2012), and Anser et al. (Citation2020). Unemployment is defined as those who are looking for work. During the process of looking for work, the unemployed group acts similarly to the worker group, where they continue to consume goods. Nevertheless, the ability to consume is different because working people have income while the unemployed do not. Those unemployed will also lose enthusiasm for work (Veysel et al., Citation2018; Britto et al., 2020). Based on BPS data, unemployment in Indonesia is still relatively high. The unemployed group will find it more difficult to get new jobs because they have to compete with a workforce that is better prepared and has better skills.
Interestingly, in the short-term estimation section, inflation and unemployment do not significantly affect crime. It is different in the long run, where both have an influence. A person’s decision to commit a crime is not necessarily done instantly. This lack of influence can be explained by those who are unemployed are not completely unemployed but are looking for a suitable job because it takes time to match their education. In other side, they are aware “if I commit a crime, I already understand the consequences”. Meanwhile, an increase in the price of goods in a short time did not significantly reduce purchasing power due to the increase in certain goods. (Adekoya & Razak, Citation2016; Tang & Lean, Citation2007).
5. Conclusion and policy implications
5.1 Conclusion
This study aims to examine the determination of crime on inequality, income per capita, inflation, and unemployment in Indonesia. Due to data limitations, the analytical method employed the ARDL model from 2000 to 2019. In order to complete this model, several tests were needed. The stationarity test results found different stationarity. Subsequently, the results of the cointegration test with the bound test found cointegration between the variables studied.
The ARDL model produces two estimates, namely short-term and long-term estimates. Long-term results explain that inequality, inflation, and unemployment positively and significantly affect crime. Nevertheless, income per capita has a negative and significant effect. In this long-term estimate, two variables have a large impact, namely inequality and income per capita, which is around 5%. If inequality increases by 1%, crime will increase by 5.003%, assuming ceteris paribus. Then, an increase in income per capita of 1% means a decrease in crime by 5.08%, assuming ceteris paribus. Unemployment and inflation have a small impact, namely 0.13% and 0.03%. Income per capita and inequality have a considerable impact compared to others. This increase gives a signal that in the long term crime will arise more and it is a concern for other macroeconomics such as economic growth.
Furthermore, short-term estimates found that only inequality (positif sign) and income per capita (negative sign) have a significant effect. Despite being in line with the long-term relationship, the impact of these two is different, especially income per capita of 2.9% and inequality of 1.8%. The result can be interpreted as an increase in income in the short term of 1%; it will reduce crime by 2.9%, assuming ceteris paribus. Meanwhile, an increase in inequality of 1% causes an increase in crime by 1.8%, assuming ceteris paribus. However, the findings in the short term explain that inflation and unemployment do not have a significant effect. Inflation and education findings explain that rising inflation and unemployment do not encourage individuals to commit crimes in a short time. Testing the classical assumptions and explaining stability has met the requirements. Last empirical findings, we tested the model’s reliability using the FMOLS and DOLS approaches. The test results provide findings similar to the primary model.
5.2 Policy implication
Inequality, income per capita, inflation, and unemployment can be presumed as determining factors for crime in Indonesia. Increasing problems in these indicators will cause serious friction in the social environment. This situation is a problem in not only in short run but also in the long run. Thus, concrete steps must be undertaken by policymakers to address these problems. Based on the research findings, there are several recommendations:
Inequality needs to be suppressed to reduce crime. To suppress this inequality, policymakes should provide subsidies to the poor. Inequality is not only in terms of income but also health and education. Therefore, equal access to these facilities gives both of them the same opportunity.
The economy must always grow positively every year. Increasing the economy will indirectly increase income per capita. One way is through the use of technology to increase productivity and efficiency. An increase in the economy can occur if the situation is normal, but in an abnormal situation such as the COVID pandemic and crisis economic, it is necessary to recover the economy quickly.
Anticipation of an increase in inflation is essential in reducing crime. Rising inflation impacts purchasing income. The decrease in income causes consumption of goods to decrease and survival to decrease, especially for those with low incomes. The government can anticipate inflation by intervening in the market, especially goods for living needs.
Policy actors must consider the availability of definite jobs for unemployed people. Currently, formal and informal job qualifications require more expertise, and the government must facilitate the program so that workers can quickly use it for work. Hence, the decision to commit a crime is low. income per capita
However, there are some limitations to this study. Firstly, future research can examine other influences such as poverty, population density, and level of education. Second, this paper only provides short-term and long-term interpretations, which results in a general view of one region. It would be better if the investigation of crime studies in Indonesia was carried out regionally (by provinces, islands, and city characteristics). The goal is to see a comparison of its influence on each region. Third, the implications of inequality need to be carried out in urban and rural areas in order to capture the impact on crime. Fourth, future research needs to look crime by using external impacts such as the covid pandemic or the economic crisis as dummy variable. This situation is important because it has an impact on macroeconomics. Lastly, this study has limited data, so future research can update more recent data. Through these limitations, further research can consider these issues so that it will contribute to understanding the causes of crime from different perspectives.
Acknowledgments
The authors would like to thank two anonymous reviewers for their valuable comments on our first manuscript.
Disclosure statement
No potential conflict of interest was reported by the authors.
Additional information
Funding
Notes on contributors

Ikhsan Ikhsan
Ikhsan Ikhsan is a full-time lecturer in the Economics Department of Economics and Business Faculty at Universitas Syiah Kuala, Indonesia. His research interest: are economic development, poverty and public policy, and economics and finance.
Amri Amri
Amri Amri is an active researcher and lecturer at the Department of Development Economics, the Faculty of Economics and Business, Universitas Syiah Kuala, Banda Aceh, Indonesia. His research interest includes monetary policy, macroeconomics and econometrics.
References
- Adekoya, A. F., & Razak, N. A. A. (2016). Inflation, deterrence and crime: evidence from Nigeria using bounds test approach. Journal of Economics and Sustainable Development, 7(October), 23–17.
- Afriyie, J. K., Twumasi-Ankrah, S., Gyamfi, K. B., Arthur, D., & Pels, W. A. (2020). Evaluating the performance of unit root tests in single time series processes. Mathematics and Statistics, 8(6), 656–664. https://doi.org/10.13189/ms.2020.080605
- Anser, M. K., Yousaf, Z., Nassani, A. A., Alotaibi, S. M., Kabbani, A., & Zaman, K. (2020). Dynamic linkages between poverty, inequality, crime, and social expenditures in a panel of 16 countries: Two-step GMM estimates. Journal of Economic Structures, 9(1). https://doi.org/10.1186/s40008-020-00220-6
- Antipova, A. (2021). Analysis of the COVID-19 impacts on employment and unemployment across the multi-dimensional social disadvantaged areas. Social Sciences & Humanities Open, 4(1), 100224. https://doi.org/10.1016/j.ssaho.2021.100224
- Appiah, M., Karim, S., Naeem, M. A., & Lucey, B. M. (2022). Do institutional affiliation affect the renewable energy-growth nexus in the Sub-Saharan Africa: Evidence from a multi-quantitative approach. Renewable Energy, 191, 785–795. https://doi.org/10.1016/j.renene.2022.04.045
- Ardiyono, S. K. (2022). Covid-19 pandemic, firms’ responses, and unemployment in the ASEAN-5. Economic Analysis and Policy, 76, 337–372. https://doi.org/10.1016/j.eap.2022.08.021
- Armin, F., & Idris. (2020). Analysis of the effects of education, unemployment, poverty, and income inequality on crime in Indonesia. 4th Padang International Conference on Education, Economics, Business and Accounting (PICEEBA-2 2019), 124, 368–374. https://doi.org/10.2991/aebmr.k.200305.092
- Bali, T. G., & Demirtas, K. O. (2009). Small Sample Bias in Panel Data. Social Science Research Network Electronic Journal. https://doi.org/10.2139/ssrn.1434425
- Becker, G. S. (1968). Crime and punishment: An economic approach. Journal ofPoliticaleconomy, 76(2), 169–217. https://doi.org/10.1086/259394
- Braun, C. (2019). Crime and the minimum wage. Review of Economic Dynamics, 32, 122–152. https://doi.org/10.1016/j.red.2019.02.002
- Britto, D. G. C., Pinotti, P., & Sampaio, B. (2022). The effect of job loss and unemployment insurance on crime in Brazil. Econometrica, 90(4), 1393–1423. https://doi.org/10.3982/ecta18984
- Brush, J. (2007). Does income inequality lead to more crime? A comparison of cross-sectional and time-series analyses of United States counties. Economics Letters, 96(2), 264–268. https://doi.org/10.1016/j.econlet.2007.01.012
- Central Bureau of Statistics (BPS). (2021). Criminal Statistics 2021. https://www.bps.go.id/publication/2021/12/15/8d1bc84d2055e99feed39986/statistik-kriminal-2021.html Accessed 1 November.
- Clément, M., & Piaser, L. (2021). Do inequalities predict fear of crime? Empirical evidence from Mexico. World Development, 140, 105354. https://doi.org/10.1016/j.worlddev.2020.105354
- Corvalan, A., & Pazzona, M. (2022). Inequality, crime and private protection. Economics Letters, 210, 110184. https://doi.org/10.1016/j.econlet.2021.110184
- Dergiades, T., Milas, C., & Panagiotidis, T. (2022). Unemployment claims during COVID-19 and economic support measures in the U.S. Economic Modelling, 113(April), 105891. https://doi.org/10.1016/j.econmod.2022.105891
- Dutta, N., Jana, D., & Kar, S. (2020). Does state-level per capita income affect juvenile delinquency? An empirical analysis for Indian states. Economic Modelling, 87, 109–120. July 2019. https://doi.org/10.1016/j.econmod.2019.07.011
- Enamorado, T., López-Calva, L. F., Rodríguez-Castelán, C., & Winkler, H. (2016). Income inequality and violent crime: Evidence from Mexico’s drug war. Journal of Development Economics, 120(2016), 128–143. https://doi.org/10.1016/j.jdeveco.2015.12.004
- Fachrurrozi, K., Fahmiwati, H., Aswadi, L., & Lidiana. (2021). Pengaruh kemiskinan dan pengangguran terhadap kriminalitas di Indonesia di tahun 2019. Jurnal Real Riset, 3(2), 173–178. https://doi.org/10.47647/jrr
- Fachrurrozi, K., Masbar, R., Aliasuddin, & Seftarita, C. (2022). Energy-growth-globalization (EGG) nexus in N-11 countries. Heliyon, 8(9), e10522. https://doi.org/10.1016/j.heliyon.2022.e10522
- Fallahi, F., Pourtaghi, H., & Rodríguez, G. (2012). The unemployment rate, unemployment volatility, and crime. International Journal of Social Economics, 39(6), 440–448. https://doi.org/10.1108/03068291211224937
- Farooq, A., Shahbaz, M., Arouri, M., & Teulon, F. (2013). Does corruption impede economic growth in Pakistan? Economic Modelling, 35, 622–633. https://doi.org/10.1016/j.econmod.2013.08.019
- Fone, Z. S., Sabia, J. J., & Cesur, R. (2023). The unintended effects of minimum wage increases on crime. Journal of Public Economics, 219, 104780. https://doi.org/10.1016/j.jpubeco.2022.104780
- Freedman, M., & Owens, E. G. (2011). Low-income housing development and crime. Journal of Urban Economics, 70(2–3), 115–131. https://doi.org/10.1016/j.jue.2011.04.001
- Gillani, S. Y. M., Rehman, H. U., & Gill, A. R. (2009). Unemployment, poverty, inflation and crime Nexus: Cointegration and causality analysis of Pakistan. Pakistan Economic and Social Review, 47(1), 79–98.
- Goda, T., & Torres García, A. (2018). Inequality and property crime: does absolute inequality matter? International Criminal Justice Review, 29(2), 121–140. https://doi.org/10.1177/1057567718799829
- Goulas, E., & Zervoyianni, A. (2015). Economic growth and crime: Is there an asymmetric relationship? Economic Modelling, 49, 286–295. https://doi.org/10.1016/j.econmod.2015.04.014
- Hardiawan, D., Yusuf, A. A., & Muljarijadi, B. (2019). the impact of expenditure inequality and socioeconomic on crime rates in Indonesia. Cross Sectional study using spatial econometrics and geographically weighted regression. Achieving and Sustaining SDGs 2018 Conference: Harnessing the Power of Frontier Technology to Achieve the Sustainable Development Goals (ASSDG 2018), 216(Assdg 2018), 150–169. https://doi.org/10.2991/assdg-18.2019.14
- Hazra, D. (2020). What does (and does not) affect crime in India? International Journal of Social Economics, 47(4), 503–521. https://doi.org/10.1108/IJSE-03-2019-0206
- Hendri, D. (2014). Sebuah sisi gelap dari ketimpangan distribusi pendapatan (crime: a dark side of income inequality). Jurnal Ekonomi & Kebijakan Publik, 5(2), 239–252.
- Ikhsan, I., Fachrurrozi, K., Nasir, M., Elfiana, E., & Nurjannah, N. (2022). Energy-growth nexus in Indonesia: Fresh Evidence from Asymmetric Causality Test. International Journal of Energy Economics and Policy, 12(1), 396–400. https://doi.org/10.32479/ijeep.11837
- Khan, I. H., Alyas, K., Hanif, N., & Zaiba, A. (2020). Relationship between Crime and Economic Conditions in Sindh: A Time Series Approach from 1984-2015. Sustainability in Environment, 5(2), 1. https://doi.org/10.22158/se.v5n2p1
- Liotti, G. (2020). Labour market flexibility, economic crisis and youth unemployment in Italy. Structural Change and Economic Dynamics, 54, 150–162. https://doi.org/10.1016/j.strueco.2020.04.011
- Li, J., Wan, G., Wang, C., & Zhang, X. (2019). Which indicator of income distribution explains crime better? Evidence from China. China Economic Review, 54(September 2018), 51–72. https://doi.org/10.1016/j.chieco.2018.10.008
- Mankiw, N. G. (2016). Macroeconomics (9th ed.). Worth Publisher.
- Narayan, P. K. (2005). The saving and investment nexus for China: Evidence from cointegration tests. Applied Economics, 37(17), 1979–1990. https://doi.org/10.1080/00036840500278103
- Nazli, Z., Jamal, A., & Nasir, M. (2021). Investigating the Income Inequality in Indonesia: An Application of Autoregressive Distributed Lag Approach. International Journal of Business, Economics, and Social Development, 2(4), 184–193. https://doi.org/10.46336/ijbesd.v2i4.162
- Odhiambo, N. M. (2009). Energy consumption and economic growth nexus in Tanzania: An ARDL bounds testing approach. Energy Policy, 37(2), 617–622. https://doi.org/10.1016/j.enpol.2008.09.077
- Park, J. Y. (1992). Canonical Cointegrating Regressions. Econometrica, 60(1), 119–143. https://doi.org/10.2307/2951679
- Pedroni, P. (2001). Fully modified OLS for heterogeneous cointegrated panels. Advances in Econometrics, 15, 93–130. https://doi.org/10.1016/S0731-9053(00)15004-2
- Pesaran, M. H., Shin, Y., & Smith, R. J. (2001). Bounds testing approaches to the analysis of level relationships. Journal of Applied Econometrics, 16(3), 289–326. https://doi.org/10.1002/jae.616
- Rahman, Y. A., & Prasetyo, A. D. (2018). Economics and crime rates in Indonesia. Jejak, 11(2), 401–412. https://doi.org/10.15294/jejak.v11i2.16060
- Riveros Gavilantes, J. M. (2020). Low sample size and regression: A Monte Carlo approach. Journal of Applied Economic Sciences, 1(67), 22–44. https://doi.org/10.14505/jaes.v15.1(67).02
- Rosenfeld, R. (2014). Crime and inflation in cross-national perspective. Crime and Justice, 43(1), 341–366. https://doi.org/10.1086/677665
- Rosenfeld, R., & Fornango, R. (2007). The impact of economic conditions on robbery and property crime: The role of consumer sentiment. Criminology, 45(4), 735–769. https://doi.org/10.1111/j.1745-9125.2007.00096.x
- Rosenfeld, R., & Levin, A. (2016). Acquisitive crime and inflation in the United States: 1960–2012. Journal of Quantitative Criminology, 32(3), 427–447. https://doi.org/10.1007/s10940-016-9279-8
- Rosenfeld, R., & Vogel, M. (2021). Homicide, Acquisitive Crime, and Inflation: A City-Level Longitudinal Analysis. Crime and delinquency, 69(1), 3–33. https://doi.org/10.1177/00111287211039994
- Rosenfeld, R., Vogel, M., & McCuddy, T. (2019). Crime and Inflation in U. S. Cities. Journal of Quantitative Criminology, 35(1), 195–210. https://doi.org/10.1007/s10940-018-9377-x
- RS, P. H., & Syahputri, A. R. (2016). Analisis Ketimpangan Ekonomi dan Pengaruhnya terhadap Tingkat Kriminalitas di Propinsi Sumatera Utara. Jurnal Ekonomi, 16(1), 77358.
- Schleimer, J. P., Pear, V. A., McCort, C. D., Shev, A. B., De Biasi, A., Tomsich, E., Buggs, S., Laqueur, H. S., & Wintemute, G. J. (2022). Unemployment and crime in US cities during the coronavirus pandemic. Journal of Urban Health, 99(1), 82–91. https://doi.org/10.1007/s11524-021-00605-3
- Shahbaz, M. (2012). Does trade openness affect long run growth? Cointegration, causality and forecast error variance decomposition tests for Pakistan. Economic Modelling, 29(6), 2325–2339. https://doi.org/10.1016/j.econmod.2012.07.015
- Shrestha, M. B., & Bhatta, G. R. (2018). Selecting appropriate methodological framework for time series data analysis. The Journal of Finance and Data Science, 4(2), 71–89. https://doi.org/10.1016/j.jfds.2017.11.001
- Sugiharti, L., Purwono, R., Esquivias, M. A., & Rohmawati, H. (2023). The Nexus between Crime Rates, Poverty, and Income Inequality: A Case Study of Indonesia. Economies, 11(2), 62. https://doi.org/10.3390/economies11020062
- Tang, C. F., & Lean, H. H. (2007). Will inflation increase crime rate? New evidence from bounds and modified wald tests. Global Crime, 8(4), 311–323. https://doi.org/10.1080/17440570701739694
- Todaro, M. P., & Smith, S. C. (2015). Economic development. Pearson Addison Wesley.
- Veysel, K. M., Ibrahim, A., & Serhat, Y. S. (2018). Income, Unemployment and Crime in Turkey: An Analysis of Causality. Annals of Dunarea de Jos University Fascicle I Economics and Applied Informatics, 24(1), 85–90.
- Wahyu, A. M., Anugrah, P. G., Danyalin, A. M., & Noorrizki, R. D. (2021). Ketimpangan Ekonomi Berdampak pada Tingkat Kriminalitas? Telaah dalam Perspektif Psikologi Problematika Sosial. Jurnal Ilmiah Ilmu Sosial, 7(2), 170. https://doi.org/10.23887/jiis.v7i2.35361
- Wang, X., & Hu, S. (2022). Analysis of the Relationship Between Unemployment and Crime Rate in China. Proceedings of the 2021 International Conference on Social Development and Media Communication (SDMC 2021), 631(Sdmc 2021), 665–670. https://doi.org/10.2991/assehr.k.220105.122
- Wijaya, T. H. D., & Halim, P. (2020). Punishment on Criminal Law Reform in Indonesia. International Conference on Law Reform (INCLAR 2019), 121(Inclar 2019), 35–38. https://doi.org/10.2991/aebmr.k.200226.007
- Yasir, S., Gillani, M., Rehman, H. U., & Gill, A. R. (2009). Unemployment, poverty, inflation and crime nexus: cointegration and causality analysis of Pakistan. Pakistan Economic and Social Review, 47(1), 79–98.