
 ?Mathematical formulae have been encoded as MathML and are displayed in this HTML version using MathJax in order to improve their display. Uncheck the box to turn MathJax off. This feature requires Javascript. Click on a formula to zoom.
Abstract
Terrorist attacks aim to maximize human fatalities and related damages to instill fear within the community. Such attacks are considered High Impact Attacks (HIAs) and orchestrating them requires considerable organizational setup and resources. This study extends the implementation of the Iterative Outlier Analysis (IOA) heuristics developed earlier to each region reported in the Global Terrorism Database (GTD). It reinforces and generalizes the finding that the “nkill” attribute resulted in richer sets of HIAs in regions where terrorism is prolific compared to the composite measure Global Terrorism Index—Impact Score (GTI-IS). HIA dataset of each region facilitates the identification and ranking of the Most Active Organizations (MAOs). Moreover, this study proposes a consistency and intensity code (CIC) to classify terrorist organizations capable of HIAs using four color categories. K-Means validate the number of clusters. The frequency of MAOs rank follows distinct probability distribution in each CIC category. Finally, this research identified the most virulent consistent and intense terrorist organizations (CITO) capable of perpetrating attacks in multiple regions. Regional counterterrorism policymakers can use such a classification method. A non-parametric hypothesis test confirmed that the contribution of ideologies varies significantly by region.
1. Introduction
Terrorism is a global evil that creates direct or indirect havoc in everyone’s lives. Terrorism continues to be a dynamic and evolving menace to humanity’s peaceful existence. Terrorists invest in widespread attention to further their objective or make their presence known. However, Abrahms et al. found no empirical evidence to suggest that violence perpetrated by terrorists helps them achieve their demands (Abrahms & Gottfried, Citation2016). Scholarly research to understand the perpetrators and their organization identified hierarchical roles within them (Victoroff, Citation2005). Moreover, the literature suggests various classification attributes like perpetrator number, target, methodology, etc., to segregate between various instances of terrorism. Efforts like the Memorial Institute for the Prevention of Terrorism (MIPT) (Ellis, Citation2004), International Terrorism: Attributes of Terrorist Events (ITERATE) (Mickolus et al., Citation2016), and Global Terrorism Database (LaFree & Dugan, Citation2007) aimed to collect and organize data of numerous terrorist incidents to help researchers. Terrorist organizations aim to instill significant fear in the target society to establish and maintain their presence in the region, thereby keeping their cause alive (Jenkins, Citation2020). High Impact Attacks (HIAs) are effective tools for terrorist organizations to garner public attention. Executing an HIA needs planning, trained human resources, and strong financial support, which are seldom available. Therefore, such attacks are relatively infrequent. The casualty statistics reported by GTD exhibits significant variation. Hyslop and Morgan indicated that attacks with heavy casualties, wounded, or property damage easily succeed in establishing a long-term psychological influence on the target audience. They devised a Global Terrorism Index (GTI) using these three attributes from the GTD and suggested a five-year period to capture the lingering psychological impact of any terrorist attack (Hyslop & Morgan, Citation2014). However, this globally used indicator is devoid of any mechanism to numerically capture preferential target choices by terrorist organizations in a particular region. This restricts the interpretation of an attack’s impact by an organization’s target choices.
Although certain terrorist actions like high-profile persons’ kidnapping fulfill the basic objective of instilling fear without accumulating body count. A sophisticated psychological measurement technique capable of detecting fear in terrorist situations will undoubtedly label them as HIAs. Without such a tool, the authors follow the existing norms that consider only those attacks as HIAs that result in significant damages, like casualties, wounds, or property damage.
Prior studies on HIA sought to gain insights by examining target and weapon choices in various terrorism events (Singh & Philip, Citation2022). However, studies indicate that the perpetrator’s ideology and organization play a critical part in the execution of an attack. Drake proposed that terrorists’ ideologies provide them their initial impetus for violence and serve as justification for it. Further, the ideology drives the target choices of the terrorists, supporting the claim that they rarely conduct random or mindless operations (Drake, Citation1998). Therefore, we investigated, using HIA data, the effects of various ideologies on different parts of the world to identify patterns of terrorist organizations. Several studies differentiated between terrorist organizations using factors such as organizational structure, assault sites, target preferences, etc (Victoroff, Citation2005). However, such classifications are rarely dichotomous. This research aimed to categorize such organizations into disjoint sets based on the persistence of the terrorist attacks and the associated intensities. This classification is helpful for two reasons. First, such disjoint buckets of terrorist organizations make it easier to formulate focused counterterrorism measures. Second, assessing the time-dependent transitions of such organizations between different buckets allows agencies to evaluate the efficacies of their counterterrorism strategies and tactics. Further, it eliminates judgemental errors that prevent any terrorist organization from becoming “tolerably intolerable” with the advent of time.
2. Literature review
Various terrorist organizations are active in different geographical regions for many reasons. Terrorism researchers attempted a comprehensive approach to segmenting these organizations based on multiple criteria. They suggested segmenting the organizations based on their locations, goals, and the period they remain active (Hoffman, Citation2006). Shultz categorized terrorism into two groups: Enforcement terror and Agitational terror (Shultz, Citation1978). Instead of identifying organizations by their intent or ideology, a functional approach was proposed based on the target population and operations base (Merari, Citation1978). The study classified these groups as domestic xenofighters, foreign xenofighters, domestic homofighters, and foreign homofighters. These classifications enable the creation of anti-terrorism policies. Another classification categorizes the group according to the variables restricting their terrorist actions at a given period (Ganor, Citation2008). It differentiates the organization into five distinct types based on the motivation of the organization and its operational capabilities. This dynamic categorization also facilitates forecasting an organization’s actions in a particular condition. A previously conducted detailed empirical investigation enabled researchers to identify specific factors that make terrorist organizations more lethal. The authors hypothesized that lethality depends on the organizational size, alliance with other peers, following religious-ethno-nationalist ideologies, or maintaining control over territories (Asal & Rethemeyer, Citation2008). Using the MIPT database, Romano et al. examined the categories of terrorist groups and the fatalities they inflicted (Romano et al., Citation2019). The study used data from 1998 to 2007 to determine that most terrorist groups were nationalist and Islamist. It challenges the notion that contemporary terrorism is religious in character but supports the notion that Islamist terrorism has amassed a greater number of victims. Based on the lethality, attacks can be easily classified as suicidal or non-suicidal attacks. Of all the terrorist attacks perpetrated by an organization, suicide attacks are generally considered most lethal by the academia and the agencies around the world. Mroszczyk conducted a cost-benefit analysis of a suicide attack from the perpetrating organization’s perspective and counterintuitively demonstrated the suboptimality of this tactic despite certain advantages (Mroszczyk, Citation2019). Therefore, in this study, we propose a novel typology by first identifying terrorist organizations capable of HIA and then differentiating them according to the consistency and intensity of their historical activity in a particular region of the world. This approach ranks organizations based on the impact of their activities and provides a color scheme to visually categorize them.
Global Terrorism Database (GTD) is a comprehensive collection of terror events from 1970 onwards maintained by the National Center for the Study of Terrorism and Responses to Terrorism (START) (LaFree & Dugan, Citation2007). Around 135 distinct database attributes capture various information associated with these attacks. GTD was introduced in 2007 and later incorporated past events from 1970 by collating data from various other organizations (START National Consortium for the Study of Terrorism and Responses to Terrorism, Citation2018). Therefore, it is an amalgamation of data from three different collecting sources and is divided into four distinct parts. Figure illustrates the constituent parts and the respective contribution of each collecting source in the GTD. Pinkerton Global Intelligence Service (PGIS), Center for Terrorism and Intelligence Studies (CETIS), Institute for the Study of Violent Groups (ISVG), and START contribute 37.155%, 10.264%, 9.649%, and 42.933% of data, respectively. This study utilizes part IV of the GTD, as shown in Figure .
Figure 1. Various data sources of Global Terrorism Database (GTD)(Singh & Philip, Citation2021).
Global Terrorism Index (GTI) utilizes GTD to rank nations based on the terrorist activities reported in the geographical region (Hyslop & Morgan, Citation2014). GTI is a well-known index among policymakers and journalist circles to quantify the impact of terrorism in a region. United Nations recently cited GTI in its terrorism report, stating that fatalities related to terrorist activities have declined since 2017 (General Assembly, Citation2021). GTI measures each incident using three attributes from GTD viz. (i) number of casualties (nkill), (ii) number of wounded (nwound), and (iii) property damages due to the incident (propextent). Using these indicators, GTI proposed an impact score (GTI-IS) to measure each terrorist attack, as shown in Equation 1.
Equation 1. Global Terrorism Index—Impact Score (GTI-IS) evaluation.
A weighted impact raw score (WIRS) is calculated by assigning weights to the aggregate GTI-IS of the last five years, representing the aggregation of terrorism in that region. Then, scaling WIRS to a final rank between 1–10 for each nation completes the process.
Different kinds of terrorist attacks create a varying impact on the target population. Our earlier work demonstrated the successful extraction of HIAs from the GTD using an Iterative Outlier Analysis (IOA) heuristic (Singh & Philip, Citation2021). Figure details the IOA heuristic with the data from the Middle East & North Africa (MENA) region as input.
Figure 2. Iterative outlier analysis heuristic for extractions of high impact attacks (Singh & Philip, Citation2021).
Further, an efficacy analysis of the pure database attribute “nkill” against the composite measure GTI-IS from the terrorism events of the MENA region suggests that usage of the “nkill” attribute resulted in a richer set of HIAs for the MENA region (Singh & Philip, Citation2021). The study also segregated the most active organizations (MAOs) from the annual HIAs extracted by the local point outlier analysis (Blázquez-García et al., Citation2020). A similar efficacy analysis between “nkill” and GTI-IS performed on the global dataset again found the former attribute as a better choice to extract HIAs using global point outliers or local point outliers (Singh & Philip, Citation2022). The study further analyzed the extracted HIAs using correspondence analysis to study the categorical attributes like region of attack, weapon type used in the attack and the target type of the attack. This study extends the efficacy analysis in each region to validate the applicability of the IOA heuristic and identify the region based HIAs to model the characteristics of the organizations perpetrating them. Another rigorous study on the HIAs of India & its neighbors incorporated the geographical aspects to explore spatial autocorrelation (Singh & Philip, Citation2023). Further, this research identified statistical differences between the occurrence of lethal and non-lethal terrorist attacks.
Profiling a terrorist group in a region based on the information of attacks they perpetrated can be considered a clustering problem. From the wide variety of clustering algorithms available in the data mining domain, k-Means is primarily suitable for unsupervised learning tasks. This algorithm partitions the dataset into a pre-specified “k” number of clusters by minimizing the variance within each cluster (Jin & Han, Citation2010). The k-Means algorithm randomly chooses the location of centroids and then iteratively measures and minimizes the average distance of the data points from these centroids. The solution quality of k-Means depends on the centroid’s initialization; hence, multiple initializations usually find better solutions. Scikit-learn, a popular open-source machine learning library (Pedregosa et al., Citation2011), provides a better initialization approach for the centroid using the k-means++ algorithm, which proved advantageous compared to the random initialization presented in the literature (Arthur & Vassilvitskii, Citation2007).
The k-Means algorithm requires the hyperparameter “k” beforehand. The elbow method is beneficial in ascertaining the number of clusters based on the inertia statistics of the data points. Researchers aiming to find the best clusters in the customer profile successfully implemented the elbow method, where the value of “k” was incrementally increased (Syakur et al., Citation2018). A steep decrease in the inertia for a particular “k” indicates the optimal number of clusters for the dataset.
Finding the best theoretical probability distribution for a massive dataset can effectively reduce it into a few distribution arguments. Distfit is an open-source Python package suitable for fitting probability distributions across 89 distinct univariate distributions (Taskesen, Citation2020/Taskesen, Citation2020). It utilizes the famous statistical package SciPy of the Python ecosystem (Virtanen et al., Citation2020). Distfit finds the best theoretical distribution using the goodness of fit tests by minimizing the Residual Sum of Squares (RSS). A theoretical distribution can further facilitate the simulation studies to conduct predictive analysis using models.
Furthermore, experts argue that rather than viewing terrorist organizations as unitary social units, they should be viewed as internally heterogeneous social units. Abrahms et al. demonstrated that terrorist commanders favor much less indiscriminate brutality than their operatives (Abrahms et al., Citation2017). Blomberg et al. studied the survival of terrorist organizations and found that religious ideologies fare better than organizations with secular political goals (Blomberg et al., Citation2011). Further, ideology does not play any crucial role in performing kidnappings (Forest, Citation2012). Onat & Gul suggest that terrorists make a rational choice while selecting the place of attack, and this choice is ideology-dependent (Onat & Gul, Citation2018). They further probed the risk of terrorism and the interaction of ideology in Turkey at the micro level and found that the risky areas of terrorism vary with ideology (Onat & Gul, Citation2018). In this study, we identify the ideologies of the terrorist organization perpetrating HIAs in the region and test whether the impact varies with region. Skillings-Mack test is a non-parametric test based on an incomplete block design, which is useful when the missing observations occur randomly in the block design (Skillings & Mack, Citation1981). It is a general case of Friedman-type statistic that studies the balanced complete block designs. The statistical software R provides various implementations of the Skillings-Mack test. “Skillings.Mack” is an R package that allows performing this test and performs Monte-Carlo simulations as well on small incomplete block designs (Srisuradetchai, Citation2015).
3. Methodology
This study aims to classify terrorist organizations based on their consistent presence and the intensity of their attacks in a particular region. This analysis utilized part IV of the GTD 2018 released by START, which contains terrorist events up to 2017. Two attributes were used for the analysis, viz., (i) nkill (from GTD), and (ii) GTI-IS, a composite attribute derived using the GTD attributes of nkill, nwound, and propextent. Figure depicts the complete process flowchart for identifying terror organizations capable of high impact attacks and categorizing them.
Figure 3. Flowchart of the extraction and classification of terror organizations capable of High Impact Attacks.
IOA (Singh & Philip, Citation2021) extracted HIAs for each year using nkill and GTI-IS separately. The extracted HIAs were then consolidated (for nkill and GTI-IS separately) based on terrorist organizations to find the top 10 organizations each year. A final aggregation of these top 10 organizations from each year based on the impact using nkill or GTI-IS generated the region’s Most Active Organizations (MAOs). These MAOs are thus based on the annual local point outlier analysis using the IOA, which perpetrated comparatively high-impact attacks in a particular calendar year. The retrieved MAOs in each region were ranked separately using the aggregated nkill, or GTI-IS reported.
Next, collecting MAOs from each region provides the global list of the most active organizations. This global dataset has the following attributes: name of the organization, time-series of aggregated nkill or GTI-IS from 2011 to 2017, the regional rank of the organization, name of the region, and the total impact perpetrated by the organization titled as Aggregate Intensity (AI). An additional derived attribute, “activity count,” indicates the number of non-zero years in which the organization reported any activity was appended to the dataset.
Next, two more categorical attributes were derived using the AI and activity count attributes by calculating each region’s median of the respective attributes. Organizations reporting higher activity counts than the median in a particular region were marked as High and Low vice versa. These indicators facilitate consistency-intensity coding, which assigns a color code to each organization based on its activity in a particular region. Table summarizes the criteria for assigning the proposed consistency-intensity code (CIC).
Table 1. Consistency-Intensity Code (CIC) for each organization
From Table , the “Red” categorical level of CIC indicates intense attacks (demonstrated by large aggregated nkill or GTI-IS values) that are consistently spread within the timeline of 2011–17, thereby indicating the dangerous nature of such organizations. Conversely, the “Green” coded organizations report HIAs with an infrequent lower intensity during the same timeline. Also, the “Violet” code represents organizations that reported lower intensity attacks but were consistent across the timeline, indicating their perseverance and potential to move towards the “Red” category. Finally, the “Orange” coded organizations indicate those who could manage sporadic HIAs that resulted in significant casualties.
Further, the k-Means algorithm conducted the confirmatory analysis to crossmatch the number of clusters obtained using the derived activity count category and the Aggregate Intensity (AI) category. An in-depth study using the organization’s rank in a particular region and the CIC helped decipher the distribution of the organization’s rank in a particular CIC category, viz. Red, Orange, Violet, and Green.
This study brings forth MAOs active in more than one region and highlights their segment in the proposed CIC categories. Finally, different terror ideologies were investigated in various parts of the world, and a statistical test was used to examine the variation in their impact across regions.
4. Results
GTD 2018 reports 181,691 total terror incidents, out of which part IV of the GTD accounts for 78,005 incidents. This study analyzed the complete part IV of the GTD to realize a region-wise insight into the data. Table reports the region-wise incident counts and their percentage share in part IV of the GTD.
Table 2. Region-wise incident counts in GTD part IV
The IOA retrieved the high-impact attacks in each region, reporting sufficient incidents. For regions reporting relatively few terrorism incidents, this study considered all reported events as HIAs, resulting in a coalescence of some regions, as detailed below.
America: Central America & Caribbean, North America, and South America
Central-East Asia: Central Asia and East Asia
Europe: Eastern Europe and Western Europe
Table summarizes the extracted HIAs for regions that report many terrorist attacks. The first column indicates the region’s name, followed by the count of HIAs extracted exclusively by the nkill attribute. The column titled “Common” provides the count of HIAs selected by both the nkill attribute and the GTI-IS composite attribute. The fourth column reports the HIA count exclusively identified by the GTI-IS measure. The final column is the total of all HIAs for the respective region. For regions that report many terrorism incidents, the “nkill” attribute provides a richer set of HIAs than the GTI-IS.
Table 3. HIAs extracted using Iterative Outlier Analysis (IOA)
Table compares the most active organizations (MAOs) identified for each region using the “nkill” and the GTI-IS attributes, where the top 10 organizations were extracted annually and then aggregated. The number of organizations identified by each attribute is comparable for almost all regions.
Table 4. Number of Most Active Organizations (MAOs) in each region
Also, data of all such reported organizations were aggregated to create a global dataset of MAOs. A quick snapshot of the top 10 rows of nkill and GTI-IS from this dataset is provided in Table . This dataset comprises 401 entries; the MAOs reported region-wise with their regional ranks based on their aggregated intensity. Also, columns labeled with years (2011–2017) contain the aggregated value of the attribute used to compute the rank. The dataset combines organizations reported by both nkill and GTI-IS. The authors enriched this dataset by adding three more attributes, viz., (i) type, (ii) gname alias, and (iii) umbrella organization. The type attribute represents the type or ideology of a terror organization, a categorical attribute with levels such as Anarchists, Anti-communists, Anti-regime, Christian Militia, Communist, Criminal gang, Drug cartel, Eco-extremism, Ethnic nationalism, Extremism, Gunmen, Insurgency, Islamic, Left-wing, Militants, Rebel, Separatists, and Tribal. The attribute gname alias, is an attempt to uniquely identify an organization by a distinct abbreviated form of its actual name. The umbrella organization attribute mentions the terror organization that supposedly acts as a parent organization to another terror organization by nurturing and supporting the child organization’s ideology, operations, or goal. These details are compiled using the open-source information available in media or official government sources. The complete dataset is available as an attachment to this article.
Table 5. Global Most Active Organizations (MAOs) dataset
Adding two more derived categorical attributes to the dataset in Table enhanced its information content. First, the categorical activity count sums the non-zero yearly columns (2011–2017) for a terror organization and classifies them into low or high categories based on the median of such counts for a particular region. Similarly, the aggregate intensity of an organization was categorized as low or high using the median of the aggregated attribute data for a particular region. Tables compare both attributes’ median values for each region against “nkill” and GTI-IS, respectively. It is interesting to note that the median values of activity count for MAOs identified by the “nkill” attribute is slightly more than GTI-IS, indicating the richer dataset of HIAs extracted by “nkill.”
Table 6. Region-wise median values using nkill
Table 7. Region-wise median values using GTI-IS
As indicated in Table , the calculated median values will determine the low or high category of the attribute, thereby creating the CIC for each organization in a particular region. Figure depicts the distribution of levels of this derived attribute and the number of organizations falling in each categorical level. It shows that GTI-IS categorizes more organizations than “nkill,” even though “nkill” results in a richer set of region-wise HIAs. Moreover, the maximum number of organizations falls into the two extreme categorical levels, i.e., Red and Green.
The number of distinct categories in CIC was validated using the k-Means clustering on the derived two categorical variables viz. (i) AI, and (ii) activity count. Figure illustrates that the elbow method indicated three optimal categories using either nkill or GTI-IS attributes. However, the inertia difference between the three and four categories is minimal, thereby validating four distinct categorical levels obtained in the CIC.
Figure 4. Distribution of Consistency-Intensity Code (CIC) using nkill and GTI-IS.
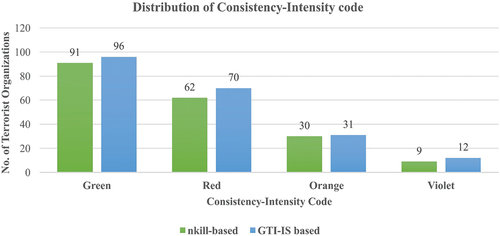
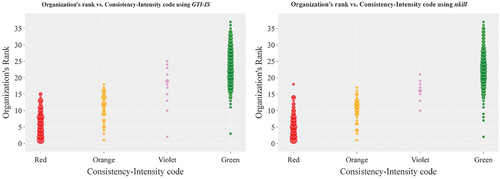
Table also contains each region’s localized ranks of M AOs, which can facilitate the region-based studies of such terrorist organizations. Figure is the balloon plot between the rank of organizations against the category levels of the CIC. The balloon size represents the frequency of ranks associated with organizations in each category of the CIC.
Figure 5. Identification of optimal categories using K-Means clustering algorithm.
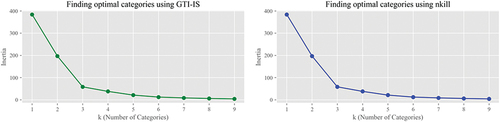
Figure shows separate analyses for both nkill and GTI-IS. Almost all terror organizations categorized as “Red” obtained a rank within 20, whereas the “Green” organizations attained diverse rank values. The “Orange” and “Violet” categories had relatively fewer frequencies, with “Violet” being the least, as indicated by the size of the balloon plot. Also, the “Violet” organizations show a visibly more diverse distribution in ranks using the attribute GTI-IS than “nkill.”
The rank of organizations classified under four different CIC categories follows different distributions. Figure compares various distributions followed by organizational ranks within each of the four codes using “nkill” as the attribute. The critical “Red” category indicates the possibility of an exponential distribution of rank, while the next critical “Orange” indicates a somewhat normal distribution with skewness.
Figure 6. Distribution of the organization’s rank against Consistency-Intensity Codes (CIC).
The probability distribution that best fits each class of the CIC was investigated by fitting general distributions like Normal, Exponential, Beta, Gamma, log gamma, Pareto, and t-distribution using the distfit library, using the Residual Sum of Squares (RSS) as the metric. Figure compares the best distribution fit in each category, where lower RSS values indicate a better fit. As hypothesized from Figure , both beta and exponential distribution return the lowest values of RSS for the “Red” category. However, for “Orange,” the gamma distribution appears to fit best. This analysis gains importance as these probability distributions can facilitate simulating the time-dependent behavior of MAOs, thereby realistically model their future activities.
Figure 7. Frequency of organization’s rank in Consistency-Intensity Code (CIC) using nkill.
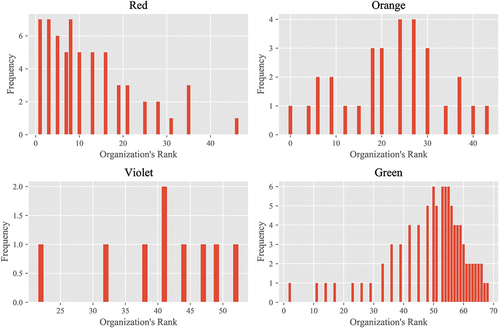
Table summarizes the detailed parameters of various distributions obtained as the best fit for each CIC against “nkill” and GTI-IS attributes. From Table , we see that for “Red,” the Beta distribution seems to fit the best in both “nkill” and GTI-IS attributes and gamma for “Orange” in the same fashion. Also, the columns “loc” and “scale” are SciPy’s reported mean and standard deviation values, respectively.
Figure 8. Best distribution fit for each category in consistency-intensity code using nkill.
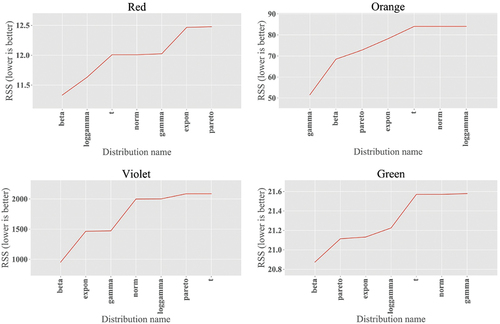
Table 8. Parameter details for the best fit distribution of organization’s rank data
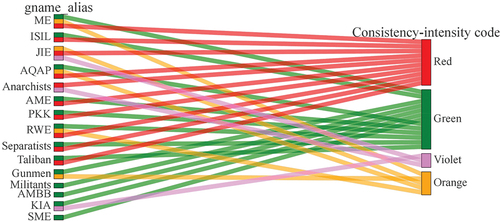
MAOs in each category of the CIC that are reported by either “nkill” or GTI-IS are combined and then referred to as Consistent and Intense Terrorist Organizations (CITO). This union operation results in 69, 44, 18, and 123 organizations in the red, orange, violet, and green categories. Out of all the CITOs, Table reports only those organizations that are active in more than one region. These filtered CITO have marked their presence in multiple regions, indicating their capability of orchestrating transnational attacks, making them more lethal than others. Thus, these are considered virulent CITO in this study. There are 15 unique virulent CITOs listed in Table , and the eight columns from the second to ninth contain binary values that indicate whether the specific organization is active in that region or not using one and zero, respectively. The column titled “nregion” is the sum of all binary values across all regions, whereas the Consistency code indicates the activity count category. The final column, “Intensity code,” represents the intensity in binary form. As stated earlier, the last two columns provide CIC’s color code. Using binary strings to code the transnational activities along with the consistency and intensity values opens the possibility of applying Genetic Algorithms (GAs) in the future.
Table 9. Virulent Consistent and Intense Organizations (CITOs) reporting events in multiple regions
Aliases of the organizations used in Table are: ME, Muslim Extremist; ISIL, Islamic State of Iraq and the Levant; JIE, Jihadi-inspired Extremist; AQAP, Al-Qaida in the Arabian Peninsula; AME, Anti-Muslim Extremist; PKK, Kurdistan Workers’ Party; RWE, Right-Wing Extremist; AMBB, Al-Mua’qi’oon Biddam Brigade (Those who Sign with Blood); KIA, Kachin Independence Army; SME, Sunni Muslim Extremists.
Figure depicts the virulent CITOs and their respective CICs. It indicates that these organizations are primarily in the Red or Green state. Figure also indicates that a particular CITO can have a different color code based on the region, which confirms the general understanding that the capabilities of organizations vary with regions.
Figure 9. Classification of virulent CITO based on Consistency-Intensity Code (CIC).
Using the information from additional sources, the dataset compiled by the authors includes the type of organization which indicates the ideology of the corresponding MAO.
The MAOs reported by the nkill attribute in this dataset are 192, whereas GTI-IS reported 209. Using the GTI-IS subset from the proposed dataset, Figure provides a visual description of the presence of a particular ideology in a specific region. It is evident that Australasia & Oceania, MENA, South Asia, and Southeast Asia faces terrorism from a few ideologies. In contrast, America, Europe, Central East Asia, and Sub-Saharan Africa have been under threat by many ideologies.
Figure 10. Presence of terrorism ideology in a region.
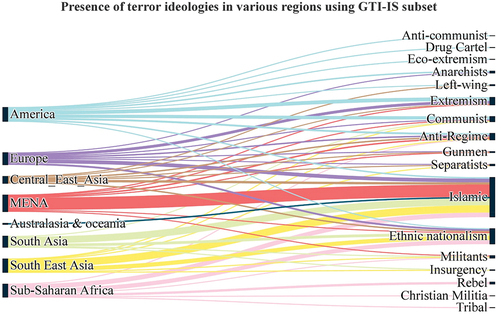
Finally, we use the aggregate GTI-IS accumulated by each ideology in a specific region to determine whether each ideology has a different impact in different regions. Table shows the GTI-IS contribution in each region by ideologies present in those regions. Australasia & Oceania regions have not been considered for this analysis as this block has only a single contribution by Islamic ideology, which is evident from Figure as well.
Table 10. GTI-IS contribution by ideologies in each region
This is an incomplete block design with randomly missing data. Therefore, we apply the Skillings-Mack test to test our hypothesis and found the p-value as 0.108115 and the Skillings-Mack statistic of 23.21. The p-value is based on a chi-square distribution with 16 degrees of freedom. The R package also provides the capability to perform Monte-Carlo simulation, which reported a p-value of 0.04 with a default replication of 10,000.
5. Conclusion
This study proposed a classification mechanism to segment terrorist organizations capable of orchestrating and sustaining high impact attacks (HIA). Initially, HIAs were extracted from each region by implementing an intuitive IOA heuristic that utilized “nkill” and GTI-IS attributes separately as input. MENA and South Asia regions reported 4684 and 4957 HIAs, respectively, using either nkill or GTI-IS attributes, which is higher than all other regions. A detailed region-wise analysis reported an almost similar number of active MAOs across regions using either attribute (nkill or GTI-IS) as the basis of analysis. Collecting all the reported MAOs for all regions created a global dataset that lists those critical organizations capable of perpetrating HIAs in their respective regions. This dataset includes the localized ranks of each MAO for the region they belong to and their total nkill or GTI-IS score for each year. This study successfully proposed a color-coding mechanism to classify these terrorist organizations by incorporating aggregate intensity and activity count attributes. The CIC’s category assignment utilizes the median values of the respective derived attributes, making this mechanism dynamic. This segmentation approach can be quickly extended to newer terrorism data with minimal computation effort. The characteristic of the proposed mechanism also allows for a longitudinal study of terrorist organizations. However, some organizations like left-wing/animal rights deliberately minimize casualties and remain impactful. The current state-of-the-art numerical measure of a terrorist attack (GTI) doesn’t capture the psychological impact of low-casualty events. Therefore, the CIC methodology can categorize them only based on their consistent presence.
Further, this study indicated that organizations in each CIC category follow a distinct distribution of localized ranks. These distributions can facilitate predicting the range of attack intensity in a region by a particular CIC category. The best fit theoretical probability distributions for each CIC category were obtained by minimizing RSS. The information of these distributions can facilitate predictive analytics using simulation studies on terrorism in a region.
This study also identified the most virulent terrorist organizations out of all the CITOs based on their active presence in more than one region. The most notable of these are Muslim Extremists, the Islamic State of Iraq and the Levant (ISIL), and Jihadi-inspired Extremists (JIE). Our approach identifies these organizations as critical, similar to the existing knowledge. The contribution of our methodology is its data-driven approach that eliminates biases, hunches, and opinions. Therefore, agencies can use our unbiased classification technique with timely updated terrorism data to minimize human judgemental errors. Further, these organizations need immediate attention from the policymakers and suggest the need for different region-specific and organization-oriented counterterrorism measures based on the CIC category such virulent CITOs fall in.
Finally, the dataset compiled by the authors facilitated the visual analytics of various ideologies in different regions, showing that some regions face threats from more ideologies than others. The umbrella organization attribute can be used to study terror organizations’ interactions further. Using GTI-IS score as the response variable, the non-parametric hypothesis test confirms that the contribution by ideologies varies significantly by region. Thus, policymakers should create region-based counterterrorism measures.
Correction
This article has been corrected with minor changes. These changes do not impact the academic content of the article.
Supplemental Material
Download MS Excel (60.7 KB)Disclosure statement
No potential conflict of interest was reported by the author(s).
Supplemental data
Supplemental data for this article can be accessed online at https://doi.org/10.1080/23311886.2023.2270642
Additional information
Notes on contributors

Prabal Pratap Singh
Prabal Pratap Singh is a Post Doctoral Fellow at IIT Kanpur. As part of his doctoral research at the Department of Management Sciences, IIT Kanpur, he specialized in Data Science and conducted his dissertation research in counterterrorism, peace, and conflict studies. His works on Data Sciences and Counterterrorism have been published & presented at prestigious international journals and conferences. In 2014, he earned a Bachelor of Technology in Mechanical Engineering. He earned a Master of Technology in Mechanical Engineering from PDPM IIIT D&M Jabalpur in 2016 by researching Computer-Aided Design (CAD), Computer-Aided Process Planning (CAPP), and Optimization Techniques. He received the Best Paper Award for his work in CAD and Counterterrorism.
Deepu Philip
Deepu Philip is a Faculty Member with the Department of Management Sciences and the Design Program, IIT Kanpur. His primary research includes production and operations, systems simulation, product life cycle management, UAS, and systems engineering. He completed various designing systems for various industries like defense, aviation, strategic chemical facilities, transportation, health care, energy, and communication.
Ashutosh Khanna
Ashutosh Khanna holds a Ph.D. in Innovation and Information Systems from the Department of Management at the London School of Economics and Political Science (LSE), London, U.K. He has an MSc in Analysis Design & Management of Information Systems from the LSE, U.K., and holds a Bachelor of Engineering in Computer Engineering from Mumbai University. He has over 15 years of rich experience in consulting, academia, and entrepreneurship in the U.K., Europe, and India, including Business Start-Ups, Innovation Strategy, Intellectual Property & Rights Management, and Corporate Web 2.0. Currently he is working with large Central Public Sector Enterprises of India, exploring their Innovation Capacities with the intent of redefining and hence developing their Innovation Strategy to enhance their competitiveness and grow sustainably.
Alok Kumar Singh
Alok Kumar Singh is an Associate Professor in the area of Production and Operation Management and Chairperson Executive MBA program at IIM Nagpur. Prior to joining IIM Nagpur, he served as PGPM chairperson at IIM Trichy. Prof Singh holds a FPM degree (Fellow in Management) in Operations management and quantitative techniques area from Indian Institute of Management, Indore. He is a Mechanical Engineer from the College of Technology, G. B. Pant University of Agriculture & Technology, Pantnagar. Before joining academics, he worked with Steel Authority of India Limited (SAIL) for eight and a half years and has more than eight years of academic experience at IMT and IMI New Delhi. Prof Singh is actively involved in academic, MDP’s and administrative activities. He has published papers in reputed journals and has attended several conferences in India and abroad. His teaching and research interests span across the domain of Operations Management, Project Management, Supply chain management and Quantitative Techniques.
References
- Abrahms, M., Beauchamp, N., & Mroszczyk, J. (2017). What terrorist leaders want: A content analysis of terrorist propaganda videos. Studies in Conflict & Terrorism, 40(11), 899–19. Scopus. https://doi.org/10.1080/1057610X.2016.1248666
- Abrahms, M., & Gottfried, M. S. (2016). Does Terrorism pay? An empirical analysis. Terrorism and Political Violence, 28(1), 72–89. Scopus. https://doi.org/10.1080/09546553.2013.879057
- Arthur, D., & Vassilvitskii, S. (2007). K-Means++: The advantages of careful seeding. Proceedings of the Eighteenth Annual ACM-SIAM Symposium on Discrete Algorithms, New Orleans, Louisiana (pp. 1027–1035).
- Asal, V., & Rethemeyer, R. K. (2008). The nature of the beast: Organizational structures and the lethality of terrorist attacks. The Journal of Politics, 70(2), 437–449. https://doi.org/10.1017/S0022381608080419
- Blázquez-García, A., Conde, A., Mori, U., & Lozano, J. A. (2020). A review on outlier/anomaly detection in time series data. https://doi.org/10.48550/arXiv.2002.04236
- Blomberg, S. B., Gaibulloev, K., & Sandler, T. (2011). Terrorist group survival: Ideology, tactics, and base of operations. Public Choice, 149(3–4), 441–463. https://doi.org/10.1007/s11127-011-9837-4
- Drake, C. J. M. (1998). The role of ideology in terrorists’ target selection. Terrorism and Political Violence, 10(2), 53–85. https://doi.org/10.1080/09546559808427457
- Ellis, J. O. (2004). MIPT: Sharing Terrorism information resources. In H. Chen, R. Moore, D. D. Zeng, & J. Leavitt (Eds.), Intelligence and security informatics (Vol. 3073, pp. 520–525). Springer. https://doi.org/10.1007/978-3-540-25952-7_48
- Forest, J. J. F. (2012). Kidnapping by terrorist groups, 1970-2010: Is ideological orientation relevant? Crime & Delinquency, 58(5), 769–797. https://doi.org/10.1177/0011128712452962
- Ganor, B. (2008). Terrorist organization typologies and the probability of a boomerang effect. Studies in Conflict & Terrorism, 31(4), 269–283. https://doi.org/10.1080/10576100801925208
- General Assembly, U. N. (2021, January 29). United Nations general Assembly resolution 75/729. United Nations Documents. https://documents-dds-ny.un.org/doc/UNDOC/GEN/N21/024/00/PDF/N2102400.pdf?OpenElement
- Hoffman, B. (2006). Inside terrorism (Rev. and expanded, ed.). Columbia University Press.
- Hyslop, D., & Morgan, T. (2014). Measuring terrorism with the global terrorism index. In Contributions to conflict management, peace economics and development (Vol. 22, pp. 97–114). Emerald Group Publishing. https://doi.org/10.1108/S1572-8323(2014)0000022010
- Jenkins, J. P. (2020, July). Terrorism | definition, history, & facts | britannica. https://www.britannica.com/topic/terrorism
- Jin, X., & Han, J. (2010). K-Means clustering. In C. Sammut & G. I. Webb (Eds.), Encyclopedia of machine learning (pp. 563–564). Springer US. https://doi.org/10.1007/978-0-387-30164-8_425
- LaFree, G., & Dugan, L. (2007). Introducing the global terrorism database. Terrorism and Political Violence, 19(2), 181–204. https://doi.org/10.1080/09546550701246817
- Merari, A. (1978). A classification of terrorist groups. Terrorism, 1(3–4), 331–346. https://doi.org/10.1080/10576107808435418
- Mickolus, E. F., Sandler, T., Murdock, J. M., & Flemming, P. A. (2016). International terrorism: Attributes of terrorist events (ITERATE), 1968-2010 [dataset]. Harvard Dataverse. https://doi.org/10.7910/DVN/UU6CHA
- Mroszczyk, J. (2019). To die or to kill? An analysis of suicide attack lethality. Terrorism and Political Violence, 31(2), 346–366. https://doi.org/10.1080/09546553.2016.1228632
- Onat, I., & Gul, Z. (2018). Terrorism risk forecasting by ideology. European Journal on Criminal Policy and Research, 24(4), 433–449. https://doi.org/10.1007/s10610-017-9368-8
- Pedregosa, F., Varoquaux, G., Gramfort, A., Michel, V., Thirion, B., Grisel, O., Blondel, M., Prettenhofer, P., Weiss, R., Dubourg, V., Vanderplas, J., Passos, A., Cournapeau, D., Brucher, M., Perrot, M., & Duchesnay, É. (2011). Scikit-learn: Machine learning in python. Journal of Machine Learning Research, 12(85), 2825–2830.
- Romano, D., Rowe, S., Phelps, R., & Simons, G. (2019). Correlates of terror: Trends in types of terrorist groups and fatalities inflicted. Cogent Social Sciences, 5(1), 1584957. https://doi.org/10.1080/23311886.2019.1584957
- Shultz, R. (1978). Conceptualizing Political Terrorism: A typology. Journal of International Affairs, 32(1), 7–15.
- Singh, P. P., & Philip, D. (2021). Iterative outlier analysis heuristic to study high impact terror attacks of the MENA region and Europe. WIT Transactions on the Built Environment, 206, 93–103. Scopus. https://doi.org/10.2495/SAFE210081
- Singh, P. P., & Philip, D. (2022). Extraction and analysis of high impact attacks for insights in global terrorism. Global Business Review. https://doi.org/10.1177/09721509221129038
- Singh, P. P., & Philip, D. (2023). Modelling & analysis of high impact terrorist attacks in India & its neighbors. ISPRS International Journal of Geo-Information, 12(4), 162. Article 4. https://doi.org/10.3390/ijgi12040162
- Skillings, J. H., & Mack, G. A. (1981). On the use of a Friedman-type statistic in balanced and unbalanced block designs. Technometrics, 23(2), 171–177. https://doi.org/10.1080/00401706.1981.10486261
- Srisuradetchai, P. (2015). Skillings.Mack: The Skillings-Mack test statistic for block designs with missing observations (1.10) [Computer software]. https://CRAN.R-project.org/package=Skillings.Mack
- START (National Consortium for the Study of Terrorism and Responses to Terrorism). (2018). Global terrorism database 2018 codebook. https://www.start.umd.edu/gtd/downloads/Codebook.pdf
- Syakur, M. A., Khotimah, B. K., Rochman, E. M. S., & Satoto, B. D. (2018). Integration K-Means clustering method and elbow method for identification of the best customer profile cluster. IOP Conference Series: Materials Science & Engineering, 336, 012017. https://doi.org/10.1088/1757-899X/336/1/012017
- Taskesen, E. (2020, January). Distfit—probability density fitting. Probability Density Fitting. (Original work published 2020), https://github.com/erdogant/distfit
- Victoroff, J. (2005). The mind of the terrorist: A review and critique of psychological approaches. Journal of Conflict Resolution, 49(1), 3–42. https://doi.org/10.1177/0022002704272040
- Virtanen, P., Gommers, R., Oliphant, T. E., Haberland, M., Reddy, T., Cournapeau, D., Burovski, E., Peterson, P., Weckesser, W., Bright, J., van der Walt, S. J., Brett, M., Wilson, J., Millman, K. J., Mayorov, N., Nelson, A. R. J., Jones, E., Kern, R., Larson, E., … van Mulbregt, P. (2020). SciPy 1.0: Fundamental algorithms for scientific computing in Python. Nature Methods, 17(3), 261–272. https://doi.org/10.1038/s41592-019-0686-2
