
 ?Mathematical formulae have been encoded as MathML and are displayed in this HTML version using MathJax in order to improve their display. Uncheck the box to turn MathJax off. This feature requires Javascript. Click on a formula to zoom.
Abstract
This study aims to evaluate the asymmetric effect of the real effective exchange rate (REER), in addition to examining the effects of foreign income, domestic capacity, openness, imports, and credit to the private sector on Saudi non-oil exports during 1984–2020. The study uses two indices for the dependent variables, and the estimation method is based on the data structure. The main finding of this study reveals that REER has an asymmetric effect; when it is above the 136.08 threshold, non-oil exports decrease from 0.66 to 1.22%. Moreover, positive shocks to the REER cause a 1.63% decrease in non-oil exports, but negative shocks are insignificant. Regarding the other variables, foreign income, domestic capacity, openness, imports, and credit to the private sector have positive effects, but government expenditure has negative effects in the long run. Finally, this study provides inspirational recommendations for a sustainable economy and a healthier environment. The originality of the study lies in its deep investigation of the linear and nonlinear effects of price competitiveness and evaluation of other essential and unessential variables for more coherent and confidential results. Accordingly, this study helps to clarify the ambiguity of specific factors, particularly those regarding the threshold value, and re-examines the asymmetric effect of the real effective exchange rate in recent years. Additionally, it clarifies the co-integration effect of the variables in the hands of policymakers, which can be used to boost the diversification of Saudi exports.
1. Introduction
Export diversification is a challenge for the Saudi Arabian economy. In recent years, the government of Saudi Arabia has resolved to diversify its economy and move away from oil dependence, which is the aim of its 2030 Vision. Saudi Arabia is a distinct case; the country has a long history of oil dependency, lower taxes, risk of exhausting oil resources, and vulnerability to oil price shocks; therefore, studying the determinants of non-oil exports is a crucial issue in Saudi Arabia. In view of international climate change problems and the propensity towards green economies, promoting non-oil exports is an important global issue.
Moreover, Saudi Arabia is more likely to be affected by the Dutch disease (DD). The DD theory is a well-known and widespread phenomenon that affects natural resource economies. The DD is defined as moving labour from services and non-resource exports to the resource sector and/or from non-resource exports to the services sector. Considering the income effect, the price levels increase, which is reflected in the appreciation of REER. Eventually, the non-resource export sector becomes very small as a result of drawing labour away from the sector and loss of competitiveness in the international market. Specifically, these outcomes increasingly depend on the management of resource revenues, whether the resources are directed to support the manufacturing sector or the reserves are managed for future generations. This adds more challenges to the diversification of Saudi Arabia’s export sector and calls for more research to support such export.
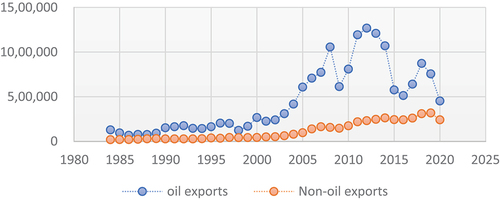
The seriousness of the non-oil export issue is illustrated in Figure . As shown, the trend of non-oil exports is lower than that of oil exports, but steadier, which also increases the risk from uncertainty in oil prices and the probability of oil depletion. Therefore, adjusting for the differences between the two types of exports requires important decisions concerning the main factors affecting non-oil exports.
Figure 1. Oil and non-oil Saudi exports.
In recent years, the Saudi government has attempted to diversify its economic growth by encouraging upstream and downstream production linked to oil resources. According to the Saudi Authority’s 2020 report, the Saudi Export Development Authority (SEDA) was established in 2012 to support the competitiveness of Saudi Arabia’s non-oil exports through programmes, incentives, training, and development to facilitate access to potential customers from global markets. The SEDA aimed to support the petrochemicals, food products, building materials, and packaging industries. According to the Saudi Authority Report (2020), the SEDA provided guarantees and finances for non-oil export projects. The report also referred to the goals of increasing the ratio of capital goods imported by the private sector, including merchandise, equipment, and supplies in the electricity, transportation, food products, chemicals, textiles, minerals, and other industries.
Empirically, there remains a need for studies evaluating the determinants of non-oil exports to sustain economic growth while simultaneously reducing emissions in favour of the environment. Several studies have examined the role of the REER in supporting exports. However, most studies have used the linear mode (Aljebrin (Citation2019), Al-Bassam (Citation2009), Brakni and Azzazi (Citation2021), Fakhri Hasanov et al. (Citation2022)), while others have used disaggregated data on industrial Saudi exports (Bamakhramah et al. (Citation1994) and Mahmood et al. (Citation2017)). They have also focused on the determinants of service exports (Mohamed & El-Tayeb, Citation2019); thus, few studies have examined the asymmetric effect using aggregate data, where the REER policy cannot depart for each type of export industry. Additionally, some important variables are alternatively examined from the export sector, such as the government expenditure (Sultan & Haque, Citation2018), import of merchandise (Al Bakr, Citation2015) and financial development (Sarwar et al., Citation2021). Combining the variables in one equation shows their effects on the mass of the mechanism. Therefore, a comprehensive study of the most influential variables is required in the literature.
This study aims to elaborately investigate the main determinants of non-oil exports. First, the study deeply focuses on the competitiveness of prices in the international market, bearing in mind the differing ways of calculating non-oil exports and estimations based on the data structure. Second, the study evaluates the most important factors characteristic of the ability of policymakers to adjust their future plans. Additionally, the study provides policy recommendations by comparing symmetric and asymmetric techniques in addition to considering the base factors for the export function to achieve more robust results.
This study has the following two aims: first, to investigate the asymmetric effect of the real exchange rate on non-oil exports and second, to shed light on the effect of the specific determinants, which are relative price and production capacity, foreign income, domestic credit to the private sector, import of machinery, the non-oil openness rate, government consumption, and labour and capital. To extract results, this study relies on an extended period from 1984 to 2020 and uses symmetric and asymmetric estimations. Symmetric estimation is conducted using OLS and ARDL techniques. Asymmetric estimation is conducted using the Threshold and NARDL techniques.
This study also makes important contributions at different levels. Scientifically, it adds experiential knowledge to the body of research on export policies. The implications of this study can assist policymakers in Saudi Arabia and countries with similar cases in crafting policies for improving the diversification of exports, subsequently helping to achieve sustainable economic growth, where the expansion of the non-resource sector and decreasing dependence on oil revenue keep healthy economies safe from oil price shocks. Internationally, the improvement in the performance of the non-oil sector means supporting green and blue industries to consequently reduce emissions, which are the reason for climate change. Saudi Arabia is the top oil exporter, which is why moving towards environmentally friendly industries can make an effective contribution to the overseas market.
This study encounters two challenges. The first concerns the different methods of calculating the dependent variables and concluding the analysis. Therefore, this study builds an analysis based on two indicators of the non-oil export sector, where one is stationary at the same level as REER and the other is stationary after the first difference. This is addressed using two methods of analysis based on each companion variable. Another difficulty is the shortage of data on certain variables. The study was drafted in 2021, and the last year examined is 2019 for some variables. For example, all human capital variables have missing values, and the best indicator is the Penn World Table (Feenstra et al., Citation2015), which was updated until 2019. To overcome this difficulty, regressions are repeated before and after using the short series.
The remainder of this paper is organised as follows. Section 2 presents the literature review. Section 3 describes the methodology of the study. Section 4 presents the results, and Section 5 discusses them. Section 6 presents the conclusions of the study, and Section 7 presents the recommendations for future research.
2. Literature review
The export sector has great potential to increase wealth and employment because it is characterised by increasing returns to scale, learning-by-doing and positive externalities (Auty & Gelb, Citation2001; Manzano & Rigobon, Citation2001; Sachs, & Warner, Citation1995). In the case of Saudi Arabia, some researchers have found positive effects of non-oil exports on the country’s economic growth (Al-Dakhil, Citation2019; Alhajhoj, Citation2007; Aljebrin, Citation2017; Altaee et al., Citation2016). Subsequently, the real non-oil GDP is an important factor that affects Saudi non-oil exports (Al-Bassam , Citation2009). Moreover, others have not found cointegration of oil price shocks in the manufacturing sector of Saudi Arabia (Mahboub & Ahmed, Citation2017). Therefore, “non-oil exports” are important for sustainable and stable economic growth.
Previous studies have empirically examined the determinants of non-oil exports of the Saudi economy. Al-Bassam (Citation2009) have found that relative price, real effective exchange rate (REER), and non-oil real GDP are the most important determinants of non-oil exports in Saudi Arabia. Bamakhramah et al. (Citation1994) have found that relative price is a major determinant, in addition to income, time trends, and domestic demand. Aljebrin (Citation2019) have argued that the REER is an important component supporting the Saudi non-oil trade deficit and recommended the management of real exchange rates.
Particularly, the competitiveness of prices has been evaluated using the REER index. Mahmood et al. (Citation2017) have estimated a NARDL model for 1970–2015 using the determinants of industrial disaggregated exports and found long-run negative effects of REER on industrial exports, except in the foodstuffs and mineral industries. Using disaggregate data, Bamakhramah et al. (Citation1994) have found that the local export price relative to the foreign export price is negative for all industries. However, the determination of symmetric relationships using aggregate data has rarely been tested.
Other determinants have been selected and evaluated in global studies. Uysal and Mohamoud (Citation2018) have evaluated the determinants of export performance in East African countries for 1990–2014. On the one hand, the study has found that labour force, industrialisation, foreign direct investment, and exchange rates have positive impact on export value. On the other hand, it has suggested that inflation negatively impacts export performance, whereas GDP growth is the only variable that does not affect the export value of East African countries. A panel of 181 countries found that the effect of currency undervaluation on growth is larger and more robust for developing economies (Rapetti et al., Citation2012). In Azerbaijan, Fakhri Hasanov and Samadova (Citation2010) have investigated the impact of the real exchange rate on non-oil exports by applying the Vector Error Correction Model and indicated that the real exchange rate has a negative impact on non-oil exports. Among the 75 developing countries, the most effective factors that can promote exports are sustainable growth, communication facilities, a stable exchange rate policy, the replacement of agricultural exports with industrial exports, and stable prices in world markets (Majeed et al., Citation2006).
The production capacity examined in this study is an important determinant in the literature. For instance, domestic products and nominal exchange rates had positive effects on Algeria’s industrial exports (Scheherazade, Citation2018). Additionally, prices and domestic production capacity are significant determinants of export supply functions in Turkey and Morocco (Faini, Citation1988). Another study has demonstrated the positive impact of domestic production capacity in Pakistan (Atique & Ahmad, Citation2003).
Previous studies have also examined private sector credit. Aljebrin (Citation2018) have showed its effects on Saudi non-oil trade openness; it has a positive effect over the long term but a negative effect in the short term. Sarwar et al. (Citation2021) have found that financial development, defined as the ratio of private sector credit to GDP, is significant and positive for Saudi economic growth. Mohamed and El-Tayeb (Citation2019) have found that human capital and level of financial development are the most influential variables in the Saudi export services sector.
The supportive role of merchandise imports in exports is consistent with the results of previous studies. According to the literature, imports have a negative long-term association with Saudi economic growth (Altaee et al., Citation2016; Sultan & Haque, Citation2018). Specifically, a study on African countries has found that imports of machinery have induced non-oil exports across 60 developing countries (Elbadawi, Citation1998). Al Bakr (Citation2015) suggested importing merchandise and equipment to support the competitiveness of local Saudi industries. A descriptive study has showed that the Saudi manufacturing sector is becoming increasingly dependent on imports of capital and intermediate goods, and appreciation could provide a net subsidy to manufacturing owners (Looney, Citation1988). Sarwar et al. (Citation2021) have found that after Vision 2030, trade openness has a significant and positive coefficient in the export sector. Using deviations in the export sector, industrial imported goods are found to be positive for the textile and wood- and metal-exporting industries (Bamakhramah et al., Citation1994)
The effect of oil revenue comes from government expenditure. On the one hand, increasing government expenditure can expose the economy to increasing income levels and aggregate demand, which can increase price levels and subsequently lead to real appreciation (an increasing REER). On the other hand, oil revenue abundance helps provide infrastructure, education, health, and security, which can enhance the investment and production environment that generally encourages production and creation, representing the positive effects of oil revenues. Therefore, the quality of governance is important when evaluating the effects of oil revenue.
The quality of governance has been evaluated in several studies. Emara and Jhonsa (Citation2014) have studied the bidirectional relationship between quality of governance and per capita income using panel data from 197 developing countries. Using two-stage least squares, the results support the bidirectional relationship in the following two ways: the quality of governance positively affects per capita income and per capita income positively affects the quality of governance. The main finding is that increasing income requires improvements in governance and vice versa. However, despite the prevalence of poor governance in the Middle East and North Africa (MENA), an increase in resources has led to an increase in welfare (Emara & Jhonsa, Citation2014). Thus, governments with increasing external revenues provide a high standard of living for their populations. One of the most important external revenue sources is oil reserves, such as those found in Saudi Arabia. Thus, the quality of governance is in its best condition among MENA countries and governance supports the growth of industrial sectors.
Improving governance by increasing oil revenues is consistent with the findings of previous studies. Using a panel of 33 oil-exporting countries, Rickne (Citation2009) have suggested that strong institutions insulate real exchange rates from oil price volatility by generating a smooth pattern of fiscal spending over the price cycle. Habib and Kalamova (Citation2007) have found virtually no impact of real oil prices on the real exchange rates in Norway and Saudi Arabia during 1980–2006. Conversely, Saudi Arabia’s terms of trade and the real exchange rate are driven by real oil prices and domestic aggregate demand shocks (Dibooğlu & Aleisa, Citation2004).
Sophisticated research studies have been conducted in recent years, providing more information on the Saudi economy, in addition to the aforementioned variables. Mohamed and El-Tayeb (Citation2019) have used multiplied ordinary least squares from 1975 to 2014. Their study has found that the export services sector is positively affected by financial development, domestic investment, value added by agriculture and services, and human capital and infrastructure development. Furthermore, the export services sector is found to be negatively affected by oil revenues and saving.
Fakhri Hasanov et al. (Citation2022) have separated the years before and after COVID-19 to analyse and estimate the demand and supply models of Saudi Non-Oil Exports from 1980 to 2018, and simulated the coefficients for 10 years until 2030. The authors have used linear cointegration methods (Johansen’s reduced rank method, ARDL, Engle-Granger, and dynamic ordinary least squares (DOLS)) and found that the appreciation of REER has a negative effect of 1.2% to 1.4%. Foreign GDP of MENA countries have positive effects of 0.6% and 0.9%. Saudi non-oil GDP, as a measure of production capacity, leads to a 1% increase in non-oil exports. Finally, 63% of the deviation from the long-run equilibrium relationship is corrected after one year. Regarding the policy simulation analyses, the results have indicated that Saudi non-oil exports are more responsive to shocks in the REER than to other determinants. Additionally, non-oil manufacturing contributes more than agriculture to the export sector, and infrastructure is an important determinant of the future.
Sarwar et al. (Citation2021) have used the monthly data from 1990 to 2020. The dependent variable is economic growth and the independent variables are value-added tax, labour, capital, oil price, financial development, defined using the ratio of private sector credit to GDP, and trade openness. The authors have used two dummy variables to examine the impact of tax and Vision 2030 and used the asymmetric ARDL for estimation. For labour and capital, the results are significantly positive for the full-sample analysis. After value-added tax, the effect of labour is insignificantly negative and capital positively affects economic growth. The coefficients of oil prices for the positive and negative shocks are significantly and negative and become insignificant after the value-added tax estimation. Positive shocks to financial development and trade openness show that negative coefficients become highly significant and positive after introducing value added tax and Vision 2030.
Tuama (Citation2018) has assessed the efforts of Gulf Cooperation Council (GCC) countries in making their economies independent of oil revenues and discussed their challenges. The author has recommended incentives to limit the role of the government and transform production activities in the private sector, in addition to stimulating exports through the establishment of banks for development, providing finance, and supporting business facilities. Sultan and Haque (Citation2018) have applied the Johansen cointegration method and found that Saudi economic growth has a positive long-run relationship with oil exports and government consumption expenditure. Furthermore, they have found a negative long-run association with imports and recommended regulating imports and encouraging import-substituting industries.
Globally, the benefits of non-oil exports, especially for the Saudi economy, are represented by sustainable growth and favour the environment. Particularly, non-oil exports, besides tourism production, are some of the most important tools that can enhance sustainable growth while positively affecting Saudi economic growth, as documented by Waheed et al. (Citation2020) using quarterly data from 1980 to 2017. Non-oil exports also include blue and green products. According to Sarwar (Citation2022), labour and marine trade are important factors supporting the economic growth of GCC countries. After the 2030 Vision, the positive movement of renewable energy, grants, marine trade, and marine tourism will have a greater impact on economic growth.
Moreover, according to Waheed et al. (Citation2021), high-tech manufacturing exports improve energy efficiency, including energy consumption, energy intensity, and carbon intensity, especially in GCC countries. Non-oil exports are industrial goods produced away from the oil sector, and mostly include production based on scientific research, such as technology goods. Consequently, technology production can reduce energy efficiency and oil usage, thereby reducing CO2 emissions. As one of the top oil exporters, Saudi Arabia can mitigate climate change by supporting non-oil exports, specifically industrial technology production.
In summary, previous studies have used various determinants, conducted different methodologies, and approved the use of selected variables in this study. To the best of our knowledge, REER and foreign income are the most important determinants in the literature. Moreover, using human and physical stock variables is required in theories when the production function is based on two variables that are supposed to have a positive effect. Moreover, a few studies have used production capacity to examines the case of Saudi non-oil exports, although they can detect the participation of exports in domestic production. Other variables include policy evaluations that are assessed in particular studies, whereas government expenditure is an important channel that transfers the influence of oil to the domestic economy. The development of the financial sector also represents a monetary policy in which the extent to credits provided to the private sector and imports represent an openness degree that relies on tariff and quota policies. These important determinants have been separated in different studies and alternatively used in the literature. Additionally, a few studies have examined the nonlinear style of methodology to clarify the positive and negative shocks in the relationship. Therefore, combining all these features in an original study can enrich the knowledge that can support policymakers and add empirical studies to the body of research on oil-rich exporting countries.
3. Methodology
3.1. Functions under research
An analysis is conducted on the demand and supply functions of non-oil exports (NXg_Y). On the demand side, according to the conventional demand theory of exports (Goldstein & Khan, Citation1978), exports manifest as imperfect substitutes for domestically traded goods; thus, consumers maximise their utility depending on the budget constraint. According to this assumption, export demand is primarily affected by prices and income. Furthermore, the quantity and price indicators in the function help avoid spurious results. Previous studies have indicated that prices are represented by various indicators (domestic and world price,
) based on the purpose of the study, and the real effective exchange rate is one of the variables used. The nominal exchange rate is also included in the REER to compute the effect of the difference between foreign exchange rates on output, and the REER ratio can exhibit price competition in international trade. The income of the potential imported region (YF) can take the form of real global GDP. Therefore, on the demand side, the expected sign of the REER is negative and that of YF is positive.
Export supply is a function of the price of exports relative to foreign export prices (XP_XPF) and the country’s productive capacity (DPC) (Goldstein & Khan, Citation1978; Koshal et al., Citation1992). In contrast to the demand function, the expected sign of the relative price is positive, where as long as the price of exports is higher than foreign export prices, the supply of exports will increase as it becomes more profitable. Logically, an increase in a country’s production capacity increases exports. Furthermore, according to the simultaneous estimation of supply and demand functions, the lag of the dependent variable must be added because the responses of foreign consumers and domestic suppliers to price changes are not in the same period. Therefore, the demand and supply of non-oil exports are determined as follows:
Alternatively, previous studies have referred to other variables with an important impact on non-oil exports, which can help enhance the robustness of the results of Equation 2 and simultaneously contribute to the second objective. Capital (INVT_Y) and labour (HCI) have long been discussed in the literature because they are considered the main production factors. The Saudi Economy has a prolonged reliance on labour, especially foreigners in industrial production (Looney, Citation1988), which are supposed to have a positive effect. This effect is more obvious after imposing a tax on foreign labour (Sarwar et al., Citation2021). Domestic credit to the private sector is one of the financial development indicators that positively affects it, as asserted by Sarwar et al. (Citation2021). Moreover, imports of merchandise (IM_Y) are supposed to represent input goods imported from other countries; in the case of Saudi Arabia, domestic production increasingly relies on materials and intermediate goods, and is supposed to have a positive effect in the long and short run (Ibrahim, Citation2015). Lastly, the openness rate (OPNX) is also considered as a variable that eases the transformation of production techniques to the local market. (GOV_Y) Government consumption is supposed to have a positive effect, but considering DD and the crowding-out theories, it is supposed to have a negative sign. Therefore, including these variables in Equation 2 yields the following equation:
3.2. Data and variable description
Definitions, sources, data covered, and symbols for the variables are provided in Table . The dependent variable, non-oil exports, has two measurements based on the variable calculation method. Non-oil exports are calculated by subtracting the value of exported goods from the value of oil exports. However, one of the measurements is real non-oil exports (divided by the non-oil deflator) divided by real GDP at a constant price in 2010 (NXg_YD). The next measurement is the current value of non-oil exports divided by the current value of GDP (NXg_Y), considering that the deflator underwent a division process.
Table 1. Variables Description
The descriptions of independent variables are provided in Table . REER is the index of the real effective exchange rate consonant in 2010. YF is the gross domestic product of the rest of the world, calculated at the constant price index of 2015 and multiplied by 100 (%100). XP_XPF is the Saudi export unit value index in 2015 over the export unit value index of the top 10 trade partners of Saudi Arabia in 2015 (%100). DPC represents Saudi real GDP at the constant prices in 2010. OPNX is the non-oil openness index, calculated as the sum of the constant value of non-oil exports and the value of imports divided by real GDP (%100). IM_Y represents the total value of imports, except for army goods, divided by current GDP (%100). CR_Y represents the sum of bank claims in the private sector and investments in private securities divided by the current GDP at the current price. GOV_Y is the final consumption of the general government as a percentage of the current GDP. NVT_Y represents gross fixed capital formation divided by current GDP. IHC indicates the Index of Human Capital per person, as developed by Feenstra et al. (Citation2015).
The data are retrieved from international and domestic sources. Foreign indices and REER data are obtained from the World Bank (WB) to unify the data sources. The remaining variables are calculated using Saudi Arabian Monetary Authority (SAMA) data. The IHC is extracted from the Penn World Table (Feenstra et al., Citation2015). The time period under research is selected to be from 1984 to 2020 depending on the extent of data availability of these sources.
3.3. Stability of the time series and technique of the estimation
This study examines the stationarity of the time series based on the Augmented Dickey—Fuller (ADF) and ADF breakpoints for the demand function variables only. Prior to proceeding with the test, all variables are transformed to have a logarithmic form to reduce the margin between variables. Transforming to log is denoted by adding “L” to the variables symbol. As shown in Table , the variables have a mixed order of stability between I(0) and I(1).
Table 2. Stability test of variables
In addition to the purpose of this study, the estimation technique chosen depends on the data structure. The technique used in EquationEquation 1(1)
(1) (demand function for non-oil exports) depends on the selected dependent variable (LNXg_Y or LNXg_YD). To investigate the asymmetric relationship, LNXg_Y (current term) is integrated in the order of zero similarity with LREER in both ADF and ADF breakpoints, but LYF is integrated in the order of one (Table ). Therefore, for more justification, threshold OLS estimation (Bai & Perron, Citation1998)Footnote1 is adopted for the stationary time series of LNXG_Y and LREER to enable comparison and verify results. Additionally, the specification of the model is examined based on Ramsey (Citation1969), coefficient stability is evaluated using the CUSUM test (Brown et al., Citation1975), and the parameter or variance stability is examined using the CUSUM of squares test (Brown et al., Citation1975). Therefore, the underestimation equation is expressed as follows:
OLS Regression:
Threshold Regression:
In OLS Regression, is the intercept,
is the coefficient of
and expected to have a negative sign.
is the coefficient of
and expected to have positive sign.
In Threshold Regression, represents the threshold variable and
is the threshold variable. The remaining control variables are included in the
items, which are foreign income
and the lag-dependent variable (
).
performs the idiosyncratic error term of time
that contains the ordinary assumptions of the linear equation (
) and
, which is the most important part of the equation. It represents the dummy variable of the regime, regardless of whether it is an upper or lower
. Thus, this equation can be written as follows:
Below the threshold level (), the indicator function is
, and the estimated parameters are
in the first regime. Above the threshold level (
), the indicator function is
, and the estimated parameters are
in the second regime. Threshold estimation helps show the extent to which the relationship is converted, for example, from negative to positive, or vice versa.
Using the second index of the dependent variable, LNXg_YD (real term), which is stable in the first order in Equation 1 (Table ), the variables become integrated in different orders (based on the ADF and ADF breakpoint tests, LNXG_YD and LYF are integrated I(1) and LREER is integrated I(0)). Therefore, the cointegration of ARDL, as developed by Pesaran and Shin (Citation1998), is more suitable for the estimation. Based on the Akaike Information Criterion for selecting the proper lag length (i), the ARDL short-run regression can be expressed as follows:
The parameters indicate the short-run coefficients, and
are long-run coefficients.
is the error term with zero mean and constant variance. If a long-run relationship is confirmed using a Bound test, it represents the following model:
The error correction equation is represented as follows:
Parameter bi where i = 1,2,3 are short-run relationships. ECT is the lag of the condition or error correction terms and should be negative and significant to represent the adjustment process in the long-run relationship.
To detect the asymmetric relationship between the dependent and independent variables in EquationEquation 1(1)
(1) , the cointegration relationship is estimated based on nonlinear ARDL (NARDL) (Shin et al., Citation2014). The NARDL model measures the long- and short-run performance and shows the effect of positive and negative shocks (changes) on the relationship, helping to clarify the transmission mechanism of independent variables. Thus, each variable has two variables in negative movements (
) and positive movements (
, and the error correction model is as follows:
Regarding the supply function of non-oil exports in EquationEquation 2(2)
(2) , based on Table , the ADF of the unit root test shows that LNXg_Yd, LXP_XPF, and LDPC are integrated in order one; therefore, the relationship between the variables can be shaped by the cointegration relationship. Thus, the ARDL is also applicable in this situation. Similar to Models 7, 8, and 9, we can express the ARDL short-run regression for EquationEquation 2
(2)
(2) as follows:
The long run regression is as follows:
The error correction function is as follows:
In EquationEquation 3(3)
(3) , the variables are stationary in different orders. LHIC, LCR_Y, and LIM_Y are integrated in the order of zero I(0), and LNXg_Y, LOPNX, LGOV_Y, and LINVT_Y are integrated in the order of one I(1). Therefore, ARDL is a suitable estimation method, and its equations are as follows:
The long run regression is as follows:
The error correction function is as follows:
4. Results
4.1. Analysis and estimation of the demand function of exports, EquationEquation 1 (1) (1)
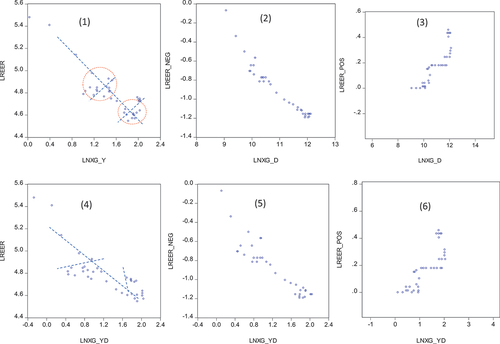
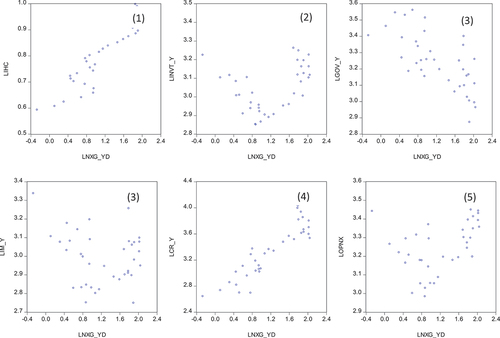
First glance at the time series using the scatter plot between LREER and LNXY reveals a semilinear relationship between the variables. As shown in Figure and Plots 1 and 6, the relationship is sometimes negative and otherwise positive. The scatter plot (Figure and Plot 3) between positive shocks of LREER (LREER_POS) and LNXg_Y seems to be positive (Plots 3 and 6), while the scatter plot between negative shocks of LREER (LREER_NEG) and LNXg_Y seems to be negative (Plot 2). Furthermore, using LNXg_YD, scatter plots show similar patterns (Plots 4,5,6). Therefore, both symmetric and asymmetric models can provide more detail on this relationship.
Figure 2. Scatter plot of the relationships between LNXG and LREER, LREER_NEG and LREER_POS.
4.1.1. OLS and threshold estimation
The results of the symmetric OLS in Column 1 of Table seem unreliable, and the estimated model suffers from misspecifications. The LREER is not significant, and the results of the Breusch-Godfrey serial correlation LM reject the null hypothesis, which supports the existing serial correlation in the regression. Moreover, the probability value of the Ramsey test is lower than 5%, which rejects the null hypothesis of model asymmetry. Therefore, we acknowledge the inefficiency of the OLS estimation.
Table 3. OLS and threshold regression of equation 1 (demand function of exports)
The estimation using one threshold estimation (Table , Column 2) yields better results. The serial correlation problem is resolved, but it suffers from the problem of heteroskedasticity of the error term (P value equal to 0.0597); however, the null hypothesis can be accepted at a 10% significance level with no existing heteroskedasticity problem. The threshold value is 4.91, which corresponds to 136.08 in 1988, when the relationship is generally negative; however, above 4.91, the negative value increases.
For samples taken after 1988 and in accordance with the smooth threshold estimation in Column 3, the effect of LREER becomes a scroll shape. LREER coefficients rise with increasing threshold values, although they turn positive above 4.82. This threshold in Column 2 is the most highlighted compared to other thresholds in Column 3 because all the thresholds in Column 3 are lower than 4.91. This is the reason that Figure of the CUSUM and CUSUM of Squares tests, Column 2, Table , demonstrates the existence of the coefficient’s instability after 1990, which indicates three thresholds for the years 1990–2019. The blue lines of the CUSUM and CUSUM of Squares tests return to be within 5% of the two limits for the remainder of the period, therefore the coefficients can still be trusted. The spike of the blue lines may actually be caused by the likelihood of existing structural breaks, although including trend in regression is designed to correct for the temporal effect. In fact, the probability of existing structural breaks could be behind this surge of the blue lines, but including trend in regression is supposed to adjust the time effect.
Figure 3. CUSUM and CUSUM of squares tests of OLS regression of equations 1, table 3, Column 2.
4.1.2. ARDL and NARDL estimation
Using the real term (LNXg_YD), the regressions of the ARDL and NARDL are displayed in Table and the lag order is selected based on AIC and SH. The REMSY test (Column 1) confirms that the ARDL model is well-specified and the prop value (0.3603) is higher than 5%. However, to provide more details regarding the relationship in this research, NARDL is estimated in Column 2. Both models ARDL and NARDL are reliable and free of serial correlation (Breusch-Godfrey serial correlation LM test) and heteroscedasticity (Breusch—Pagan LM test). Moreover, the probability value of the Bound test is higher than the upper and lower Bound values, which is in accordance with the cointegration in the relationships.
Table 4. ARDL and NARDL regression of the demand function of non-oil exports (equation 1)
In the ARDL model, long- and short-term results are significant. The condition term is significantly negative; thus, the shock in the independent variables in the short-run is corrected based on the rate of speed 52.9, which takes 1.89 years to return to the long-run equation. Moreover, all variables are significant in the long run and consistent with expectations. The coefficient of LREER is negative. In other words, increasing LREER at one point leads to a reduction in NXG_YD by 1.63%. Additionally, the coefficient of LFY is significantly negative, meaning that increasing foreign income at one point leads to an increase of 1.62% in NXG_YD.
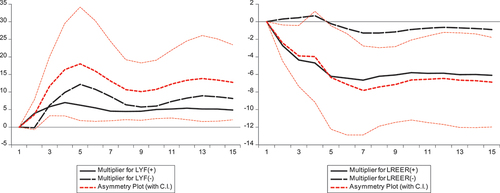
The results of the NARDL model are robust, and the results of ARDL model have more details. At the 5% significance level, the coefficient of LREER_POS (a positive shock of LREER) is negative, indicating that increasing LREER by one rate leads to a 5.94% reduction in LNXg_Yd. However, the coefficient of LREER _NEG (a negative shock of LREER) is insignificant on the right side, where decreasing LREER leads to an increase in LNXg_Yd of 0.86. These results are consistent with those of the ARDL model with regards to LREER _POS, but the insignificant effect of LREER _NEG carries additional information. Thus, LNXg_Yd is more sensitive to REER appreciation.
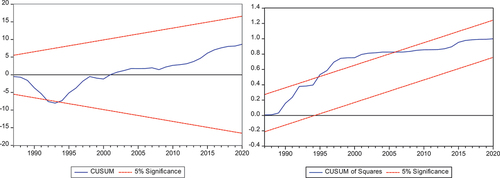
Graphically, the model’s and coefficients’ stability were indicated graphically using the CUSUM and CUSUM of Squares tests. The stability of the coefficients and the model is indicated by the blue lines in Plots 1 and 2 Figures as well as Plot 1 Figure . Despite the blue line’s tiny deviation within the 5% border in CUSUM of Squares Plot 2 Figure , it returns to being within the boundary. This deviation started in 2014 and continued through the middle of 2019, and it occurred at the same time that oil prices fell, reducing the economy’s reliance on oil and raising tax revenues in addition to the COVED 19 pandemic. Accordingly, these occurrences had an impact on the structural point’s relationship, but it eventually reverted to its normal path. Similar to the asymmetric NARDL plot in Figure , the LREER_NEG shows a slight structural alteration before reducing back to within 5% of the limits. In the case of LYF, the plot of asymmetric is inside the two boundaries. Therefore, it can be said that the models are reliable.
Figure 4. CUSUM and CUSUM of squares tests of ARDL regression of equation 1, table 4.
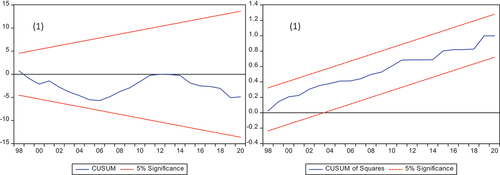
Figure 5. CUSUM and CUSUM of squares tests of NARDL regression of equation 1, table 4.
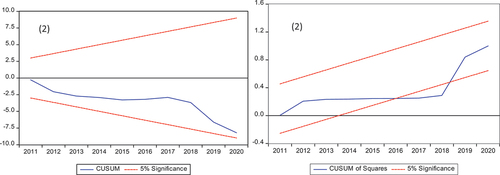
Figure 6. Asymmetric plot of NARDL regression of equation 1.
4.2. Estimation of the supply function of exports, EquationEquation 2(2) (2)
The scatter plots of LNXg_y and logarithms of LXP_XPF (LXP_XPF) and DPC (LDPC) are shown in Figure . As shown in Plot 1, the relationship between LNXg_y and LXP_XPF is positive. Clearly, Plot 3 shows that increasing LXP_XPF leads to an increase in LNXg_y, which is in line with Plot 1. Plot 2 shows that increasing the negative sign of LXP_XPF leads to an increase in LNXg_y, which implies a positive relationship. We examine these initial results using the ARDL estimation shown in Table .
Figure 7. Relationship between LNXg_y and LXP_XPF.
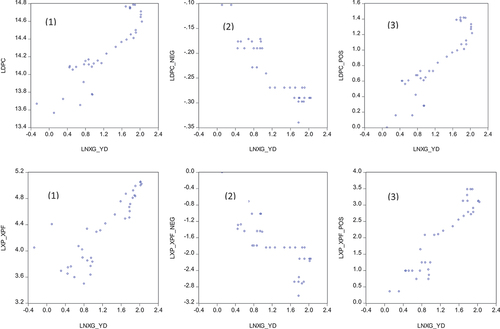
Table 5. Estimation of the supply function of non-oil exports (equation 2)
The estimation of EquationEquation 2(2)
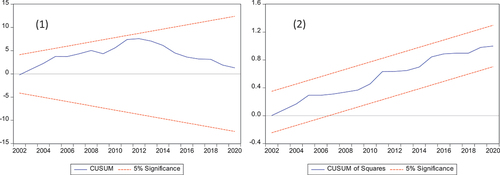
(2) based on the ARDL model is shown in Table . The probability value of the Ramsey test in the ARDL model is lower than 5%, which indicates acceptance of the null hypothesis and acknowledges the specification of the model well. The model is also free of serial correlation and heteroscedasticity under the 5% level significance in the Breusch-Godfrey serial correlation LM and Breusch—Pagan LM tests. Moreover, under the 5% level, both the CUSUM test and CUSUM of squares (Figure ) refer to the stability of the model and coefficient in the long run with no structural breaks.
Figure 8. CUSUM and CUSUM of squares tests of ARDL regression of equation 2, table 5.
The estimation of the ARDL provides a useful interpretation of the parameters of LXP_XPF and LDPC. In the long run, the coefficient of LXP_XPF is positive and statistically significant at the 1% level, indicating that increasing export prices encourages the production of non-oil exports in the international market. In other words, increasing LXP_XPF by one point leads to an increase in LNXg_Y of 0.79 point, at one-point of significant. For LDPC, the results are consistent with expectations and the coefficient is positive and statistically significant.
4.3. Estimation of the alternative function of exports; EquationEquation 3(3) (3)
Scatter plots between LNXg_Y and the independent variables in EquationEquation 3(3)
(3) are shown in Figure . Plots 1,2,3,4,5, and 6 show a positive relationship with the logarithms of labour (LHIC, LLP) and credit (LCR_Y) and a negative relationship with the logarithm of government expenditure (LGOV_Y); the logarithms of import of merchandise (LIM_Y) and openness (lOPNX) are not clear. Therefore, confirming these relationships requires an estimation of the equation.
Figure 9. Scatter plots of LNXg_Y and LHIC, LINVT, LCR_Y, LGOV_Y, LIM_Y, OPNX.
To avoid serial correlations between the variables in EquationEquation 3(3)
(3) , the estimation is conducted in three forms. The first estimation includes LCR_Y, LGOV_Y, and OPNX. Next, OPNX is replaced by LIM_Y; subsequently, all independent variables are replaced by LHIC and LINVT. The rate of openness is related to import value, and there are probability relationships in bidirectional labour, capital, and other independent variables. Therefore, separating the six variables into three groups is preferable to obtain more reliable results.
The results of the ARDL model in EquationEquation 3(3)
(3) are shown in . The ARDL estimation confirms the existence of a co-integration relationship between the independent and dependent variables. As the probability value of the Bound test is higher than the lower and upper Bounds in Columns 1 and 2 (Table ) and Column 1 in Table , the null hypothesis is rejected, and has been acknowledged for existing cointegration in the long run. Under the CUSUM and CUSUM of Squares tests, show that the blue line is within the 5% boundary, which refers to the stability of the model and coefficient in the long run with no structural breaks. The model is also free of the problems of serial correlation and heteroskedasticity, according to both the Breusch-Godfrey and serial Breusch—Pagan LM tests. More importantly, the condition terms in the model are negative and statistically significant, indicating that the short-run relationship converges in the long run.
Figure 10. CUSUM and CUSUM of squares tests of ARDL regression of equation 3, Column 1, table 6.
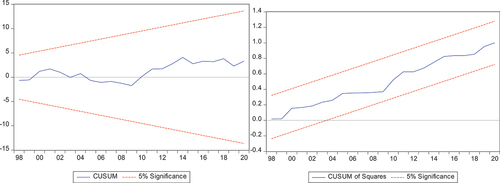
Figure 11. CUSUM and CUSUM of squares tests of ARDL regression of equation 3, Column 2, table 6.
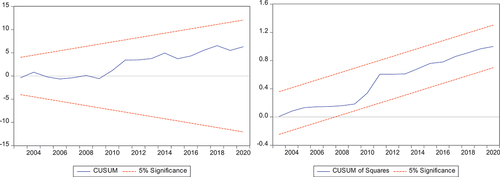
Figure 12. CUSUM and CUSUM of squares tests of ARDL regression of equation 3, table 7.
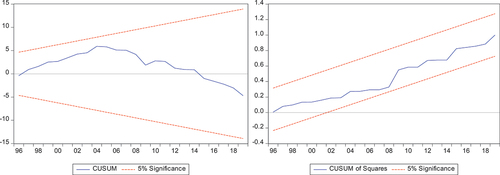
Table 6. ARDL estimating the supply function of non-oil exports in equation 3
Table 7. ARDL estimation of the supply function of non-oil exports in equation 3 with LINV and LIHC
The estimation results are consistent with expectations. According to the results in Table Columns 1 and 2, the coefficient of LXP_XPF supports the results in Table by changing the other independent variables. In Column 1 (Table ), OPNX has a positive effect on LNXg_Y in the short and long run. Thus, increasing openness in one presence leads to an increase of 0.59 in LNXg_Y. LCR_Y has a negative effect in the short run, but is positive in the long run, where an increase in the credit to the private sector by one point leads to an increase of 0.62% in LNXg_Y present. Similar to LIM_Y in Column 2, increasing marchland imports at one point, which subsequently leads to an increase of 0.83% in LNXg_Y.
In Column 2 of , EquationEquation 3(3)
(3) is re-estimated taking LINV and LIHC as independent variables, in addition to LXP_XPF. The coefficient of LXP_XPF is consistent with the previous results. LINV and LIHC are positive and statistically significant at the 1% level and consistent with economic theory in the long run; however, they are insignificant in the short run.
5. Discussion of the results
To investigate the asymmetric effect of REER on non-oil exports, the study extracts results based on two indicators of the dependent variable; one of them is (NXg_Y) with REER that is stationary at a level, which is why they are estimated using OLS and threshold regression. Another indicator (NXg_YD) with REER is stationary at first; it is differently estimated using ARDL and NARDL for the purpose of comparison and more robust results.
The results of the threshold regression can be summarised as follows. On the demand side of exports, the results indicate that, for the entire time period, the threshold regression indicates a main threshold value that leads to a deviation in the effect of REER on NXg_y; namely, at 136.08. Generally, REER negatively affects NXg_y, where increasing the REER beyond 136.08 by one point leads to a reduction of 0.66 % in NXg_y. However, beyond this rate of 136.08, the negative sign becomes more intense, where increasing the REER by one-point leads to a reduction of more than one in NXg_y, approximately by 1.22%. These results provide additional contributions to the literature. This negative effect is consistent with that demonstrated in previous studies of (Aljebrin, Citation2019; Bamakhramah et al., Citation1994; Edwards & Alves, Citation2006; Elbadawi, Citation1998). Note that an empirical study search for the threshold value of the REER effect could not be found. Threshold regression rearranges observations from the highest to the lowest value and then cuts from the upper and lower tail of the observations to avoid the smallest and highest values. Subsequently, threshold regression splits the regression based on the highlighted change in the relationship. Therefore, threshold regression is not typical of structural regression because it does not use the same order of observations. Thus, the determined threshold value is reliable.
The ARDL results support the co-integration of the REER and YF on NXg_YD. The effect of REER on NXg_YD in the short run is consistent with that in the long run, but it has a higher negative value. Specifically, in the long run, increasing the REER by one point will decrease NXg_YD by 1.63%, and in the short run, increasing the REER by one point will decrease the difference in NXg_YD in the current by 1.20%. This negative sign is consistent with studies that have found an effect on non-oil trade deficits (Aljebrin, Citation2019) and industrial exports (Bamakhramah et al., Citation1994; Mahmood et al., Citation2017).
Elaborating on the REER effect on negative and positive shocks (NARDL) yields surprising results. Positive shocks to the REER have a negatively significant effect in the long run, where NXg_YD decreases by 5.94 point. In the short run, this negative effect is distributed from the current year to the next two years, with a greater impact in the current year, which is around 3.12. Thus, NXg_YD in the current year bears the burden of REER appreciation in the same year. While the negative movement of the REER has been positive but insignificant, it negatively affected it in the short run in the two previous years. These results are consistent with those of previous studies with additional information. Mahmood et al. (Citation2017) have found a negative effect of Saudi riyal on both positive and negative industrial exports, except in some industries (foodstuffs and mineral industries). Using disaggregated data, Bamakhramah et al. (Citation1994) have found a negative effect of the relative local price on foreign export prices in most industrial exports.
The contribution in this regard can be summarised by supporting previous studies in the form of total indicators of non-oil exports and using nonlinear methods. The study reveals that this effect is converted at 136.08 to a higher-intensity effect. Moreover, this study discovers a difference between the positive and negative movements of the REER. While positive shocks have the same direction as the effect, which is the reduction of non-oil exports with real appreciation, negative shocks have no impact in the long run. This refers to other ways to support the export sector away from competitiveness in the international market, and the role of competitiveness is concentrated on avoiding real exchange appreciation.
To achieve the second aim of the study, ARDL was conducted on the selected independent variables, and the results are discussed as follows. Relative price (value of exports to imports) has a long-run positive effect on non-oil exports. Clearly, increasing export revenues induces production in the sector, which persists in the long and short run. This finding is consistent with those of Edwards and Alves (Citation2006), Atique and Ahmad (Citation2003), and Koshal et al. (Citation1992). According to the supply function theory, increasing the price of a country’s exports encourages firms to move into the export market. According to Faini (Citation1988), export prices and production capacity have positive effects on Turkish export production.
Foreign income and production capacity are significant and have a positive effect. Consistent with Mahmood et al. (Citation2017), both variables are supposed to support export production, where the main reason for increasing exports is increased demand, subsequently increasing its share of GDP.
The openness rate and imports of intermediate goods are positively similar to those of Elbadawi (Citation1998) for 60 developing countries, which is the opposite of Altaee et al. (Citation2016) and Al Bakr (Citation2015) for Saudi Arabia. This study evaluates a portion of the imports used for local production, such as textiles, raw materials, equipment, and machines, allowing these imports to afford prices that can enhance the quality and quantity of non-oil exports. However, openness to the world provides access to goods, technology, and knowledge from around the world. Therefore, in the case of Saudi Arabia, non-oil openness helps support non-oil exports. The contradiction of Sarwar et al. (Citation2021) is that openness has a negative effect on economic growth, whereas total openness implies that oil exports can carry the DD effect.
Private sector credit represents financial development and has a positive effect on non-oil exports. According to Sarwar et al. (Citation2021), the positive movement of credit to the private sector can have a positive effect in the long run after considering value-added tax and Vision 2030. Additionally, credit has a positive effect on Saudi industry (Bamakhramah et al., Citation1994). According to Aljebrin (Citation2018), considering the credit to the private sector and non-oil trade, Saudi openness has a positive long-term effect on economic growth. Therefore, this study is supported by theory and consistent with previous studies.
Contrary to expectations, government expenditures appear to have a negative effect on non-oil exports. In fact, government expenditure favour production. According to Alodadi and Benhin (Citation2015) and Sultan and Haque (Citation2018), government spending positively affects growth. For example, the government usually spends on education, health, infrastructure, security, goods consumption, and jobs. Conversely, government consumption comes at the expense of increasing taxes as a source of revenue. In the case of the Saudi economy, most government revenues are financed by oil revenues; however, as a result of value-added taxes, investment taxes, and new regulations in the private sector, the effect of government revenues comes at the expense of reducing non-oil exports. However, this was from 2018, which represents the last year of the study time series; therefore, the results cannot be covered for two years.
Another reason for the negative effect of government spending is associated with the DD theory because government expenditure is the unique channel affecting oil resources on shrinking non-resource exports; thus, increasing government spending leads to increasing aggregate demand, appreciation of the real exchange rate, and deterioration of price competition. Mahboub and Ahmed (Citation2017) have used a vector autoregressive (VAR) model and found that oil price shocks have no effect on manufacturing sector products, but positively affect government spending.
6. Conclusion
This study had the following two aims: first, to investigate the asymmetric effect of the real exchange rate on non-oil exports and second, to shed light on the effect of specific determinants on the supply side of exports, apart from relative price and production capacity, which bring domestic credit to the private sector, import of machinery, and the openness rate. The first aim was addressed using symmetric and asymmetric estimations, considering dynamic regression. Symmetric estimation was conducted using OLS and ARDL techniques. Asymmetric estimation was conducted using the Threshold and NARDL techniques. The second aim was to evaluate the variables in long and short runs. The period under analysis was from 1984 to 2020.
Regarding the first aim of this study, two major conclusions were drawn. First, the effect of the REER on non-oil exports follows an asymmetric relationship in the shape of the degree of the intensity of the effect and type of shock. REER negatively affects non-oil exports, but the negative effect increases after the REER rate reaches 136.08, from 0.66 to 1.22 points. Moreover, positive REER shocks have an important influence on non-oil exports, but non-oil exports do not benefit from negative shocks. Clearly, because of positive shocks, non-oil exports decrease by 1.63. Thus, by comparing these results with those of previous studies, the results are found to be consistent with previous literature on the effect of non-oil trade deficit (Aljebrin, Citation2019) on industrial exports (Bamakhramah et al., Citation1994; Mahmood et al., Citation2017). The contribution of the study represents the elaboration of the influence of REER.
Regarding the second aim, the results indicate that non-oil exports are significantly affected by other factors. Human and physical capital, along with production capacity, have positive long-term effect in the long run. Foreign income has a positive impact in both the long and short run. Credit to the private sector and merchandise imports have a positive impact in the long run and a negative impact in the short run. Openness has a positive impact in both the long and short terms. Government expenditure is significant in the short run but has a negative impact in the long run. The relative prices of domestic and foreign exports are mixed in the short term and positive in the long run. Deviations in these relationships in the short term are significantly adjusted for in the long term. Finally, the results are consistent with those of previous studies, except for the effect of government expenditure, which provokes research regarding policy implications and the effect of the DD phenomenon.
7. Recommendations
Based on the conclusion, this study advises to support export diversification in several ways. Policymakers are recommended to avoid appreciation of the REER and keep it below 136.08 to prevent the adverse effects of real appreciation. REER can be controlled by affecting the inflation rate, Saudi riyal, and production costs. According to Mahmood et al. (Citation2017), REER has a negative long-run effect on industrial exports, except in the food and mineral industries. Furthermore, policymakers are advised to maintain REER stability because it can reduce uncertainty, which can affect export industries in the future. It is also preferable to support exporting industries by providing special tariffs on imports that are relied upon for the production process, such as intermediate goods, raw materials, and capital goods. Moreover, considering the importance of credit provided to the private sector, facilitating this factor under appropriate conditions is required to support investment in the export sector.
Policymakers are also advised to consider government consumption in favour of non-oil exports. This should create an attractive environment for investors to work in industries and the agricultural export sector, which can be achieved by offering facilities with regard to institutions, regulations, and tax exemptions. Additionally, this study suggests encouraging technological research and adoption of new Saudi inventions in production.
Finally, the study suggests further research in the field of disaggregating government consumption to determine the reason for this negative association. Government consumption contains many elements, some of which have positive effects, such as spending on education, healthcare, security, and infrastructure. However, other elements of government consumption may have negative effects, such as the effect on price levels and financing expenditure through taxes. Therefore, such net effects should be evaluated in future studies.
Acknowledgments
The author would like to thank Deanship of Scientific Research at Majmaah University for supporting this work under Project Number NO. R-2023-537.
Disclosure statement
No potential conflict of interest was reported by the author.
Additional information
Funding
Notes
1. All regressions are estimated using EViews 9.
2. Threshold type: Threshold type: Bai-Perron tests of L + 1 vs. L sequentially determined thresholds.
3. Threshold type: Compare info. criteria for 0 to M globally determined thresholds.
References
- Al Bakr, A. (2015). Challenges to production base diversification in Saudi Arabia. Saudi Arabia Monetary Agency Working Paper WP/15/8. Saudi Arabia Monetary Agency, Riyadh.
- Al-Bassam, K. A. R., (2009). Determinants of non-oil exports to the Kingdom of Saudi Arabia: A standard study for the period 1980-2006. Federation of Chambers of Commerce and Industry Research and Documentation Center, 38. https://ddl.mbrf.ae/book/5347323
- Al-Dakhil, S. M. (2019). The impact of non-oil exports in economic growth in the Kingdom of Saudi Arabia from 1988 to 2017. Journal of Applied Sciences, 7(13), chrome-extension://efaidnbmnnnibpcajpcglclefindmkaj/https://www.eimj.org/uplode/images/photo/%D8%A3%D8%AB%D8%B1_%D8%A7%D9%84%D8%B5%D8%A7%D8%AF%D8%B1%D8%A7%D8%AA_%D8%A7%D9%84%D8%BA%D9%8A%D8%B1_%D9%86%D9%81%D8%B7%D9%8A%D8%A9_%D8%B9%D9%84%D9%89_%D8%A7%D9%84%D9%86%D9%85%D9%88_%D9%81%D9%8A_%D8%A7%D9%84%D9%85%D9%85%D9%84%D9%83%D8%A9_%D8%A7%D9%84%D8%B9%D8%B1%D8%A8%D9%8A%D8%A9_%D8%A7%D9%84%D8%B3%D8%B9%D9%88%D8%AF%D9%8A%D8%A9_.pdf
- Alhajhoj, H. (2007). Exports and economic growth in Saudi Arabia: A VAR model analysis. Journal of Applied Sciences, 7(23), 3649–29. https://doi.org/10.3923/jas.2007.3649.3658
- Aljebrin, M. (2017). Impact of non-oil export on non-oil economic growth in Saudi Arabia. International Journal of Economics and Financial Issues, 7(3), 389–397. https://dergipark.org.tr/en/pub/ijefi/issue/32021/354264
- Aljebrin, M. (2018). Non-oil trade openness and financial development impacts on economic growth in Saudi Arabia. International Journal of Economics and Financial Issues, 8(5), 251–260. https://ideas.repec.org/a/eco/journ1/2018-05-32.html
- Aljebrin, M. (2019). The non-oil trade deficit in Saudi Arabia: How can it be managed? Academy of Strategic Management Journal, 18(2). https://ksascholar.dri.sa/en/publications/the-non-oil-trade-deficit-in-saudi-arabia-how-can-it-be-managed-4
- Alodadi, A., & Benhin, J. (2015). Long term economic growth in oil-rich Saudi Arabia: What is the role for non-oil sectors. Economic Issues, 20(1), 109–129. https://doi.org/10.3727/108354215X14464845877995
- Altaee, H. H. A., Al-Jafari, M. K., & Khalid, M. A. (2016). Determinants of economic growth in the kingdom of Saudi Arabia: An application of autoregressive distributed lag model. Applied Economics and Finance, 3(1), 83–92. https://doi.org/10.11114/aef.v3i1.1200
- Atique, Z., & Ahmad, M. H. (2003). The supply and demand for exports of Pakistan: The polynomial distributed lag model (PDL) approach. The Pakistan Development Review, 42(4), 961–972. https://doi.org/10.30541/v42i4IIpp.961-972
- Auty, R., & Gelb, A. (2001). Political Economy of Resource-Abundant States. In Resource Abundance and Economic Development (p. 28750). Oxford University Press. https://doi.org/10.1093/0199275785.003.0008 .
- Bai, J., & Perron, P. (1998). Estimating and testing linear models with multiple structural changes. Econometrica, 66(1), 47–78. https://doi.org/10.2307/2998540
- Bamakhramah, A. S., Al-Nofaie, M. I., & Felimban, F. H. (1994). محددات الصادرات الصناعية في المملكة العربية السعودية. Economics and Management Journal, 7(1), 3–34. https://doi.org/10.4197/Eco.7-1.2
- Brakni, S., & Azzazi, F. (2021). Real equilibrium exchange rate modeling: Econometric study using the ARDL methodology over the period (1986-2018). Revue Organisation & Travail, 10(2), 308–319. https://www.asjp.cerist.dz/en/article/159945
- Brown, R. L., Durbin, J., & Evans, J. M. (1975). Techniques for testing the constancy of regression relationships over time. Journal of the Royal Statistical Society Series B: Statistical Methodology, 37(2), 149–163. https://doi.org/10.1111/j.2517-6161.1975.tb01532.x
- Dibooğlu, S., & Aleisa, E. (2004). Oil prices, terms of trade shocks, and macroeconomic fluctuations in Saudi Arabia. Contemporary Economic Policy, 22(1), 50–62. https://doi.org/10.1093/cep/byh005
- Edwards, L., & Alves, P. (2006). South Africa’s export performance: Determinants of export supply. South African Journal of Economics, 74(3), 473–500. https://doi.org/10.1111/j.1813-6982.2006.00087.x
- Elbadawi, I. (1998). Real exchange rate policy and non-traditional exports in developing countries (p. 57). UNU-WIDER. https://doi.org/10.22004/ag.econ.295341
- Emara, N., & Jhonsa, E. (2014). Governance and economic growth: The case of middle Eastern and North African countries. Governance and Economic Growth: The Case of Middle East and North African Countries 2014, with Eric Jhonsa, Journal of Development and Economic Policies, 16(1), 47–71. https://ssrn.com/abstract=3810359
- Faini, R. (1988). Export supply, capacity, and relative prices. Journal of Development Economics, 45(1). https://doi.org/10.1016/0304-3878(94)90060-4
- Feenstra, R. C., Inklaar, R., & Timmer, M. P. (2015). The next generation of the Penn World Table. American Economic Review, 105(10), 3150–3182. https://doi.org/10.1257/aer.20130954
- Goldstein, M., & Khan, M. S. (1978). The supply and demand for exports: A simultaneous approach. The Review of Economics and Statistics, 60(2), 275–286. https://www.jstor.org/stable/1924981?read-now=1&seq=9#page_scan_tab_contents
- Habib, M. M., & Kalamova, M. M. (2007). Are there oil currencies? The real exchange rate of oil exporting countries. SSRN Electronic Journal. https://doi.org/10.2139/ssrn.1032834
- Hasanov, F., Javid, M., & Joutz, F. L. (2022). Saudi non-oil exports before and after COVID-19: Historical impacts of determinants and scenario analysis. Sustainability, 14(4), 2379. https://www.mdpi.com/2071-1050/14/4/2379
- Hasanov, F., & Samadova, I. (2010). The impact of real exchange rate on non-oil exports: The case of Azerbaijan. SSRN Electronic Journal. https://doi.org/10.2139/ssrn.1784286
- Ibrahim, M. (2015). Merchandise import demand function in Saudi Arabia. Applied Economics and Finance, 2(1). https://doi.org/10.11114/aef.v2i1.626
- Koshal, R. K., Shukla, V. S., & Koirala, G. P. (1992). Demand and supply of Indian exports: A simultaneous equation approach. Journal of Asian Economics, 3(1), 73–83. https://doi.org/10.1016/1049-0078(92)90005-J
- Looney, R. E. (1988). Oil revenues and viable development: Impact of the Dutch disease on Saudi Arabian diversification efforts. American Arab Affairs, 17(1), 25–35. https://doi.org/10.1016/0301-4207(91)90024-P
- Mahboub, A. A., & Ahmed, H. E. (2017). The effect of oil price shocks on the Saudi manufacturing sector. Economics, 5(3), 230–238. https://doi.org/10.17265/2328-7144/2017.03.005
- Mahmood, H., Al Khateeb, T. T. Y., & Ahmad, N. (2017). Impact Of Devaluation On Industrial Exports In Saudi Arabia: J-Curve Analysis. Actual Problems of Economics, 189(3), 331–341. https://mpra.ub.uni-muenchen.de/109455/
- Majeed, M. T., Ahmad, E., & Khawaja, M. I. (2006). Determinants of exports in developing countries [with comments]. The Pakistan Development Review, 45(4II), 1265–1276. https://doi.org/10.30541/v45i4IIpp.1265-1276
- Manzano, O., & Rigobon, R. (2001). Resource curse or debt overhang?. NBER Working Papers, No 8390. https://doi.org/10.3386/w8390
- Mohamed, N. M. A., & El-Tayeb, M. K. E.-D. (2019). Determining the determinants of service exports in the Kingdom of Saudi Arabia using factor analysis. Jordanian Journal of Economic Sciences, 6(2), 177–197. https://archives.ju.edu.jo/index.php/jjes/article/view/104792/10396
- Pesaran, H. H., & Shin, Y. (1998). Generalized impulse response analysis in linear multivariate models. Economics Letters, 58(1), 17–29. https://doi.org/10.1016/S0165-1765(97)00214-0
- Ramsey, J. B. (1969). Tests for specification errors in classical linear least-squares regression analysis. Journal of the Royal Statistical Society. Series B, Statistical Methodology, 31(2), 350–371. h t tps://d o i.org/1 0.1111/j.2517/6161.1969.tb00796.x
- Rapetti, M., Skott, P., & Razmi, A. (2012). The real exchange rate and economic growth: Are developing countries different? International Review of Applied Economics, 26(6), 735–753. https://doi.org/10.1080/02692171.2012.686483
- Rickne, J. (2009). Oil prices and real exchange rate movements in oil-exporting countries: the role of institutions, IFN Working Paper No. 810. http://hdl.handle.net/10419/81425.
- Sachs, & Warner. (1995). Natural resource abundance and economic growth. NBER working paper series, 5398. doi:10.3386/w5398.
- Sarwar, S. (2022). Impact of energy intensity, green economy and blue economy to achieve sustainable economic growth in GCC countries: Does Saudi Vision 2030 matters to GCC countries. Renewable Energy, 191, 30–46. https://www.sciencedirect.com/science/article/abs/pii/S0960148122004062
- Sarwar, S., Streimikiene, D., Waheed, R., Dignah, A., & Mikalauskiene, A. (2021). Does the Vision 2030 and value added tax leads to sustainable economic growth: The case of Saudi Arabia? Sustainability, 13(19), 11090. https://doi.org/10.3390/su131911090
- Scheherazade, B. (2018). Determinants of industrial exports - an empirical study of the case of Algeria: 1980 1980 [ Doctoral Degree]. University of Abu-Bakcer Blkaid. http://bibfac.univ-tlemcen.dz/bibcentrale/opac_css/doc_num.php?explnum_id=1491.
- Shin, Y., Yu, B., & Greenwood-Nimmo, M. (2014). Modelling asymmetric cointegration and dynamic multipliers in a nonlinear ARDL framework In Sickles, R., & Horrace, W. (Eds), Festschrift in honor of Peter Schmidt (pp. 2813–14). Springer. https://doi.org/10.1007/978-1-4899-8008-3_9
- Sultan, Z. A., & Haque, M. I. (2018). Oil exports and economic growth: An empirical evidence from Saudi Arabia. International Journal of Energy Economics & Policy, 8(5), 281–287. https://ksascholar.dri.sa/en/publications/oil-exports-and-economic-growth-an-empirical-evidence-from-saudi--4
- Tuama, H. H. (2018). Economic diversification and oil revenues in the Arab Gulf countries-the case of Saudi Arabia. Journal of Economics, 6(4), 122–130. https://doi.org/10.15640/jeds.v6n4a15
- Uysal, Ö., & Mohamoud, A. S. (2018). Determinants of export performance in East Africa countries. Chinese Business Review, 17(4), 168–178. https://doi.org/10.17265/1537-1506/2018.04.002
- Waheed, R., Sarwar, S., & Dignah, A. (2020). The role of non-oil exports, tourism and renewable energy to achieve sustainable economic growth: What we learn from the experience of Saudi Arabia. Structural Change and Economic Dynamics, 55, 49–58. https://www.sciencedirect.com/science/article/abs/pii/S0954349X20303842
- Waheed, R., Sarwar, S., & Mighri, Z. (2021). Role of high technology exports for energy efficiency: Empirical evidence in the context of Gulf Cooperation Council countries. Energy & Environment, 32(5), 803–819. https://journals.sagepub.com/doi/10.1177/0958305X20954196
