
Abstract
The overarching aim of this study was to validate the Afrikaans version of Snyder’s (1997) Children’s Hope Scale in a sample of children from Cape Town, South Africa. Within this process, the study aimed to test the measurement invariance across the English and Afrikaans language versions. The study used a cross-sectional survey design, with a two-stage stratified random sample of 1022 children between the ages of 11- to 12-years-old. We selected the participants from 15 schools located in low and middle socio-economic status communities in the Cape Town Metropole. We used confirmatory factor analysis to analyse the data. The results indicated a good fit for the overall model using the pooled sample (X2 = 35.692; df = 7; p =.00; CFI =.984; RMSEA =.063; SRMR =.023). Multi-group confirmatory factor analysis further demonstrated the tenability of metric and scalar invariance. This indicates that the items on the scale has the same meaning across the two languages, and that the scores on the English and Afrikaans versions of the scale are comparable by correlations, regression coefficients, and means. The overall findings suggest that the Afrikaans translated version of the Children’s Hope Scale is an appropriate measure for use in the South African context.
PUBLIC INTEREST STATEMENT
In this study we aimed to test the suitability of the Afrikaans version of the Children’s Hope Scale developed by Snyder et al. (Citation1997), with children in Cape Town, South Africa. We further aimed to ascertain the comparability of the English and Afrikaans language versions of the scale. Our sample included 1022 children between the ages of 11- to 12-years-old selected from schools located in different socio-economic status communities in Cape Town. Using advanced statistical modeling techniques, we found that the Afrikaans translated version of the scale is appropriate for use in the South African context, and that the English and Afrikaans language versions have the same meaning and are comparable.
1. Introduction
Research endeavours exploring and assessing children’s hope has proliferated substantially in the last two decades. Studies from diverse global contexts have sought to unearth the key drivers behind hope in children. A seminal landmark theory in the field is Snyder’s (Citation2002) Hope theory. Snyder et al. (Citation1991) advanced hope “as a positive motivational state that is based on an interactively derived sense of successful (a) agency (goal-directed energy), and (b) pathways (planning to meet goals)” (p. 287). Hope encompasses relatively stable subjective evaluations of goal-oriented competencies. In describing Hope theory, Snyder (Citation2002) further delineated “the trilogy—goals, pathways, and agency—of concepts in this definition.” Goal directed thinking and behaviour are the foundation of this theory and can be either short-term or long-term. Snyder (Citation2003, p. 4) eloquently notes that:
“ … pathways thinking involves the perceptual recognition of external stimuli, the acquisition of temporal linkages between events, and the formation of goals. Acquired somewhat later temporally, agency thinking reflects the child’s recognition of him- or herself, along with the recognition of the self as the source of actions, and the formation of goals. When aggregated, these goal-directed pathways and agency thoughts define hope in this model.”
The theory advances the view that individuals with high levels of hope are motivated in their pursuit of goals, and usually experience increased positive emotions (Snyder, Citation2002). Alternatively, those with low levels of hope are likely to face challenges in goal attainment and may experience more negative emotions (S. J. Lopez et al., Citation2003; Snyder, Citation2002).
In children, Hope Theory is premised on the notion that goal-directed hopeful thinking develops in the formative years and is a requisite for the child’s development and survival (Savahl, Citation2020). Children’s perceptions and evaluations of their capacity to activate resources to respond to challenges and barriers are important considerations for hope in children. Snyder et al. (Citation1997) developed the Children’s Hope Scale (CHS) based on the conceptualisation of hope as a positive motivational construct, diverging from earlier conceptualisations that focused on negative aspects; such as Kazdin et al.’s (Citation1983) Hopelessness Scale. The CHS is a six-item dispositional self-report scale developed for 8- to 16-year-olds that evaluates the components of pathways and agency—with three items tapping each component.
The CHS has demonstrated Cronbach’s alpha estimates of .83 and .84, and item-total correlations of .51—.69 and .55—.68 (Valle et al., Citation2004). The scale authors further established satisfactory test-retest reliability of .71—.73 (Snyder et al., Citation1997). Validation studies of the CHS in the South African context by Savahl et al. (Citation2016), Guse et al. (Citation2016), Manuel et al. (Citation2020), and Savahl (Citation2020) have also demonstrated acceptable reliability coefficients of .82, .73, .86 and .80 respectively.
Along with the considerable reflection and engagement concerning conceptual definitions of hope, there has been an increasing investment in empirical studies exploring children’s hope using the CHS across low and middle, and high-income contexts (Savahl, Citation2020).
In high-income contexts, Ciarrochi et al. (Citation2007) conducted a study among 784 high school students in Australia. This study supported a two-factor structure of the CHS and reported an alpha coefficient of .82. In the USA, Dixson (Citation2017) investigated the psychometric properties of the CHS among a sample of 905 high school students. Students were categorised into three groups namely, academically gifted, general education, and academically at risk. The CHS presented with acceptable alpha coefficients of greater than .70 for the various groups and supported a two-factor model. In another study in the USA, Dew-Reeves et al. (Citation2012) utilised an adapted version of the CHS with a sample of 356 clinically referred youth between 11- and 18-years-old. The study findings supported a one-factor model and reported adequate psychometric properties for the scale, with an alpha coefficient of .87. Marques et al. (Citation2009) validated the Portuguese version of the CHS with a sample of 367 students between the ages of 11- to 16-years. They reported appropriate psychometric properties, with an alpha coefficient of .81, and acceptable test-retest reliability and criterion validity. The study further supported the two-factor model of the CHS. Pulido-Martos et al. (Citation2014) conducted a validation study among a sample of 388 Spanish adolescents between the ages of 12- and 18-years. The CHS presented with adequate construct validity and an alpha coefficient of .76. While the study supported a two-factor structure, the authors reported a cross-loading of Item 5 (“I think the things I have done in the past will help me in the future”).
Considering the use of the CHS in low- and middle-income contexts, the study by Atik and Kemer (Citation2009) explored the psychometric properties of the scale with 758 children across grades 6–8. The study found the CHS to be reliable and valid, and supported the two-factor structure of the original CHS. Jovanović (Citation2013) examined the psychometric properties of the CHS in Serbia among 936 secondary school students. The study found an alpha coefficient greater than .70 for the CHS and supported a two-factor structure.
From the South African context, four studies are notable—that of Savahl et al. (Citation2016), Savahl (Citation2020), Guse et al. (Citation2016), Manuel et al. (Citation2020), and Savahl et al. (Citation2016) aimed to validate the CHS among a sample of 1022 children aged 13- to 16-years in Cape Town. Using confirmatory factor analysis, the study confirmed a one-factor structure of hope, akin to findings by other authors (see Bickman et al., Citation2010; Dew-Reeves et al., Citation2012). The study demonstrated good cross-cultural adaptation of the CHS across low, medium, and high socio-economic status (SES) groups. Savahl (Citation2020) conducted a study on children aged 10- to 12-years using a population-based sample of 7067 children. The study found an appropriate fit for a one-factor structure and confirmed scalar invariance across the country’s nine provinces. Guse et al.’s (Citation2016) validation study comprised a sample of 1062 children between the ages of 13- to 16-years of age in Johannesburg. The study found that the CHS was reliable and valid for the sample and supported the two-factor structure of hope. Similar to the findings of the study by Pulido-Martos et al. (Citation2014), the study found that item 5 “I think the things I have done in the past will help me in the future” cross-loaded on the two latent constructs. Manuel et al. (Citation2020) aimed to provide a preliminary structural validation of the Afrikaans version of the CHS amongst a sample of South African adolescents; this study represents the first validation of the Afrikaans translated version of the Children’s Hope Scale. The study found an appropriate fit for a one-factor model and reported an acceptable reliability coefficient. In a cross-cultural study by Haroz et al. (Citation2017), the construct validity of the CHS was assessed with samples of children from Burundi, Nepal, and Indonesia (n = 1057) who were subject to armed conflict. The study confirmed an appropriate fit for a two-factor structure of hope, and supported the use of the CHS within various sociocultural settings and across gender. However, the authors caution against making direct comparisons of the CHS scores across countries.
Taken together, all of the aforementioned studies delineate the CHS as a reliable and valid measure with samples of children ranging in age from 8- to 18-years. Of particular note and significance are the languages into which the CHS has been translated, and cultures to which it has been applied. A recent seminal reliability generalisation study by Hellman et al. (Citation2018) examined 225 studies that employed the CHS across various cultural contexts. The review acknowledged the CHS to be the most widely used scale to evaluate children’s hope in the substantive literature, and more so accentuated the reliable nature of the scale across contexts and cultures (Hellman et al., Citation2018). Of the total sample, 164 studies demonstrated reliability coefficients using Cronbach’s alpha ranging from .54 to .95. The study further found that 15 studies employed test-retest reliability, with scores ranging from .45 to .95. Hellman et al. (Citation2018) note that while translated versions of the CHS are limited, they have shown acceptable psychometric properties across studies (Haroz et al., Citation2017; Pulido-Martos et al., Citation2014; Savahl et al., Citation2016). Here it is important to note the complexity of the adaptation and translation process, especially in relation to ensuring equivalence and comparability. This is particularly critical to ensure that the meaning of the items is retained across different language versions. The current study makes a contribution to the adaptation and further translation of the CHS.
2. Aim of the study
The overarching aim of this study was to validate the Afrikaans translated version of the CHS among a sample of children in the Western Cape province of South Africa. The study further aimed to test the measurement invariance of the CHS across English and Afrikaans language groups.
3. The context of language diversity in South Africa
South Africa is characterised as a multi-ethnic society, constituted by a number of different population groups with 11 official languages. In the Western Cape in particular, Afrikaans (49.7%) is the most widely spoken language, followed by isiXhosa (24.7%), and English (20.3%). The contested nature of language challenges in South Africa can be traced to the domination of colonial languages (De Klerk, Citation2002). Against this background, language was used as a tool to subjugate and classify people in terms of culture and ethnicity, with colonial languages given a higher status than indigenous languages. Afrikaans became synonymous with the Nationalist apartheid government, and was thus vehemently repudiated as the language of the liberation movement, with English considered ‘more’ neutral. The development of Afrikaans was disparate among various racial groups owing to the use of Anglicisms. This gave rise to the various dialects of the language. In the context of language skills assessment in South Africa, Southwood (Citation2013) notes the problematic nature of assessing children from differing backgrounds who do not speak mainstream dialects of Afrikaans. Most often, instruments are designed for and standardised on speakers of mainstream dialects. It is crucial to consider the contestation around the history and use of Afrikaans when conducting adaptation and translation of instruments into Afrikaans in the South African context.
4. Cross-cultural testing in South Africa
The challenges facing test adaptation are broad, and include restricted vocabulary or concepts with no equivalence in the target language, as well as the difficulties in translating literal idiomatic expressions and negative form items that often confuse test-takers (De Kock et al., Citation2013). Even more vexing are the differences in expressions and dialects within sub-groups, compounding the challenge of ensuring the accuracy of the measurement translation (Steele & Edwards, Citation2008).
In addition to converting an assessment measure from one language to another, test adaptation aims to change aspects such as words, examples, and contexts to be more applicable and relevant to a specific culture or language group (De Kock et al., Citation2013). Test adaptation facilitates comparative studies between dissimilar cultures and language groups; including comparing newly developed measures to current interpretations, norms, and other well-established and respected assessment measures (Brislin, Citation1986; De Kock et al., Citation2013).
Bias, which influences the language of the test, the culture of the participants, and the context in which the test is taken, are key considerations when validating adapted scale versions (De Klerk, Citation2008). The aforementioned factors can lead to misinterpretation of the construct being measured; when bias arises while using cross-cultural tests, the fairness and equivalence of the test is called into question. Thus, researchers apply the theory of bias and equivalence (invariance) to ensure fairness in the development and application of tests (Van de Vijver & Tanzer, Citation2004). Using this framework, the current study assesses the measurement invariance of the English and Afrikaans versions of the CHS for use with South African children in the Western Cape Province.
5. Method
5.1. The dataset
The current study uses data from the first wave of the Children’s Worlds: International Survey on Children’s Well-Being (see www.isciweb.org). The Children’s Worlds Study represents the largest multinational collaborative study aimed at measuring children’s subjective well-being across a range of domains and aspects of life (Rees & Main, Citation2015; Rees et al., Citation2020). In South Africa, the first wave of the Children’s Worlds study was conducted in the Cape Town Metropole and included a sample of 1022 children.
5.2. Research design
This study used a cross-sectional survey design. We performed confirmatory factor analysis (CFA) to test the overall fit structure, and multi-group CFA (MGCFA) to test measurement invariance across the English and Afrikaans language versions of the CHS.
5.3. Sampling
We selected the sample using a two-stage stratified random sampling procedure to ensure the selection of children from various SES groups. We accessed children (Grade 6), between the ages of 11–12-years old, from 15 schools within the Western Cape Education Department (WCED) Metropole (urban) school system in Cape Town, South Africa. In the first phase, we stratified the schools according to their location within the specific Education Management District Councils (EMDCs). Thereafter, we randomly selected schools from each of these EMDCs utilising SES as a stratifying variable. We envisaged obtaining an equal number of participants from low and middle SES groups. While we randomly selected two classes per school, in schools with a dual language medium, we selected one English and Afrikaans class. The final sample comprised 1022 children (males = 43.9%, females = 56.1%; English = 44.8%, Afrikaans = 55.2%) between the ages of 11- to 12-years (Mage = 11.78, SD = 1.68).
5.4. Instrumentation
5.4.1. Children’s Hope Scale (CHS)
The study employed Snyder et al.’s (Citation1997) CHS to evaluate children’s dispositional hope. Snyder et al. (Citation1997) developed the CHS to measure goal directed hopeful thinking in children and adolescents (aged 8- to 16-years-old). The CHS is a six-item scale, comprising six response options on a continuum of ‘1ʹ = ‘None of the time’ to ‘6ʹ = ‘All of the time’; with three items (2, 4, and 6) assessing pathways thinking and three items (1, 3, and 5) assessing agency thinking. The scale total is computed by summing the item scores. Higher scores on the CHS reflect higher levels of hope (Snyder et al., Citation1997). Ensuing validation research has provided evidence for both a two-factor model (for e.g., Guse et al., Citation2016; Pulido-Martos et al., Citation2014; Valle et al., Citation2004), and a one-factor model (see Bickman et al., Citation2010; Dew-Reeves et al., Citation2012; Manuel et al., Citation2020; Savahl, Citation2020). While the scale developers did not endorse any cut-scores, some authors (see Bickman et al., Citation2010) have delineated clusters of low (< 3.0), medium or average (3.0–4.67), and high hope (> 4.67) categories.
5.5. Scale adaptation into Afrikaans
For the present study, the original CHS underwent a process of translation and adaptation into Afrikaans following the procedure recommended by the International Test Commission (ITC) (International Test Commission, Citation2017). We used the backward-translation approach, followed by an expert panel review, and finally cognitive testing with the target population of children to resolve any discrepancies. The translated Afrikaans version of the CHS was then pilot tested. We provide further details of this process below.
First, we employed the back-translation approach to translate the CHS into Afrikaans. This encompassed translating the CHS from English to Afrikaans by one group of selected translators, which was subsequently ‘back-translated’ to English by a second group of translators. This was to ensure the comparability and consistency of the translated version. We addressed the limitation of using a single translation approach by convening an expert panel to determine any inconsistencies between the two versions and to reach consensus on the final Afrikaans translated version (International Test Commission, Citation2017).
Thereafter, we cognitively tested the Afrikaans version of the CHS using two focus group interviews, each comprising 10 children selected purposively from schools within the sampling frame. The aim of the group discussion was to assist in ensuring the appropriate wording and sequencing of the items, use of language, and ultimately that the accurate meaning of the items was conveyed.
Finally, the English and Afrikaans language versions were pilot tested with a random sample of 100 children. The purpose of the pilot testing was to identify potential inconsistencies between the two language versions of the questionnaire. This process further afforded the collection of information on how the participants responded to the scale items, including the wording and subtleties thereof. The pilot test informed the final revisions to the translated CHS. The final translated Afrikaans version of the CHS that was adapted and employed in the current study is available as an appendix (Appendix 1). However, we advise users of the scale to consider the different dialects of the Afrikaans language when administering this language version of the CHS.
5.6. Procedure and ethics
We obtained ethics clearance from the University of the Western Cape and the Western Cape Education Department. Further to that, we sought permission from the school principals of the participating schools. The study followed an active consent process. We provided information sheets and consent forms to potential participants and their parents/guardians. Prior to the administration of the questionnaire, we discussed the purpose of the study, and highlighted the key ethics principles of informed consent, anonymity, privacy, the right to withdraw, and the use of the data. The data were collected following a researcher-administered protocol wherein the research team administered the questionnaire in a group setting to the participants by reading and explaining each question and response option. This took place during an administration period at the beginning of the school day, with an average administration time of 30 minutes.
5.7. Data analysis
Given that the aim of the study is rooted in psychological measurement theory, we located the study within the theory of model fit, with a focus on ‘goodness-of-fit’ and ‘fit indexes’. We tested the fit indexes of the CHS by means of CFA to ascertain the appropriateness of using the Afrikaans version of the CHS in a South African context. The data were analysed using the Statistical Package for the Social Sciences (SPSS 25) and AMOS 25.
The theory of model fit aligns with the analysis techniques of CFA and Structural Equation Modelling (SEM). SEM is a general data modelling technique that is a combination of factor, path, and regression analyses (Hox & Bechger, Citation1999). It provides a framework for specifying the theoretical relationship between observed and unobserved variables. Thus, the interest is in ascertaining the extent to which theoretically hypothesised models fit the observed data (Savahl & Adams, Citation2019). SEM consists of two components, namely a measurement model and a structural model. The measurement model ascertains the extent to which the observed variables contribute toward the latent factor; while the structural model determines the interrelationships between two or more latent factors. CFA is the prime methodological technique for developing and refining measurement instruments, determining construct validity, and assessing measurement invariance across groups. Essentially, the assessment of model fit of the hypothesised models and the estimation of parameters are the two primary goals of SEM and CFA (Hu & Bentler, Citation1999).
Within SEM, the most widely used procedures to determine model fit are ‘goodness-of-fit’ statistics and approximate fit indexes (Hu & Bentler, Citation1999; Kline, Citation2011). ‘Goodness-of-fit’ statistics determine the degree to which the model covariance matrix significantly differs from the observed covariance matrix. The Chi-Square goodness-of-fit statistic is the most widely used and accepted ‘goodness-of-fit’ statistic. A lower chi-square value represents a non-significant difference, and a higher degree of correspondence between the specified models and the data (Kline, Citation2011); this represents a good fit of the hypothesised model to the observed data (Marsh & Hocevar, Citation1985). It is, however, important to note that the Chi-Square statistic is sensitive to sample size and tends to increase with larger samples (Hu & Bentler, Citation1999). Therefore, researchers using SEM and CFA recommend the consideration of supplementary fit indexes, of which the two most widely used are absolute fit indexes and incremental fit indexes. Absolute fit indexes assess the extent to which a hypothesised model fits the sample data without the consideration of a baseline model, while incremental fit indexes are concerned with fitting a hypothesised model to a baseline model; the null hypothesis indicates that the variables in the model are uncorrelated (Savahl, Casas et al., Citation2017). It is recommended that more than one fit index is used to overcome the limitations of using a single index (Casas et al., Citation2013). If the specified models present with a good fit (there is no significant difference between the hypothesised model and the observed data), the estimates of the path parameters can be used to determine the extent to which the latent construct loads onto the scale items.
In the current study, we used the Comparative Fit Index (CFI), the Root Mean Square Error of Approximation (RMSEA), and the Standardised Root Mean Square Residual (SRMR) to determine model fit. Following recommendations by Jackson et al. (Citation2009) and Kline (Citation2011), threshold scores of >.95 for the CFI, and <.05 for the RMSEA and the SRMR were used. These recommendations have been used in a range of studies focusing on the validation of child subjective well-being instruments used in international and cross-cultural (see e.g., Casas, Citation2017; Casas & Rees, Citation2015; Savahl, Casas et al., Citation2017), and South African (see e.g., Adams et al., Citation2016; Savahl et al., Citation2016) contexts. It is worth noting that when working with large samples, some authors (Browne & Cudeck, Citation1993; Byrne, Citation2010; Marsh et al., Citation2010) distinguish between ‘acceptable’ or ‘excellent’ fit, advocating, for example, that threshold scores of <.8 be regarded as ‘acceptable’ for RMSEA and >.90 for CFI (see Casas, Citation2017).
To compare the results across the English and Afrikaans language groups, we considered measurement invariance, which represents the degree to which items in the measure have the same meaning between groups (Meredith, Citation1993). Measurement invariance is a pre-requisite for meaningful group comparisons; if it is not met group then group comparisons would yield unreliable interpretations (Millsap & Olivera-Aguilar, Citation2012). We assessed measurement invariance through the application of MGCFA across the two language groups (English and Afrikaans). This process comprised three sequential steps wherein we applied incrementally restrictive constraints. In the first step, we tested configural invariance with unconstrained loadings and intercepts—this represents the baseline model. Thereafter, we tested metric invariance by constraining the factor loadings. Finally, we tested scalar invariance by constraining the factor loadings and intercepts. We regarded each subsequent constrained model as tenable if the model fit did not worsen by more than .01 on the CFI (Cheung & Rensvold, Citation2002) and by .015 on the RMSEA and SRMR (Chen, Citation2007).
6. Results
6.1. Descriptive statistics
Skewness values of the items ranged from −.290 to −.523, while values on kurtosis ranged from −560 to −1.020. We handled these departures from normality using the bootstrap method (500 samples) in AMOS 25. The Cronbach’s alpha for the overall scale was acceptable (.82). presents the mean and standard deviations for all the items in terms of language for the sample. The mean scores for both language versions fall within cut-scores proposed by Bickman et al. (Citation2010), denoting ‘medium’ hope.
Table 1. Item mean scores by language group
6.2. Confirmatory factor analysis
CFA (maximum likelihood estimation) was utilised to test the fit of the overall model and multi-group models by language group. The initial tests to fit a two-factor model as proposed by the original scale theory (see Snyder et al., Citation1997) presented with acceptable fit statistics, with the addition of one error co-variance (X2 = 40.689, df = 7, p = .000, CFI = .981, RMSEA = .069 [.049—.090], SRMR = .0249). However, it presented with a high correlation (.96) between the two latent factors (Agency and Pathways). A single-factor model presented with a reasonable fit (Model 1 in ). Modification indices, however, showed high parameters between the residual co-variances of the items measuring ‘agency’ (Hope 1: “I think I am doing well” and Hope 3: “I am doing just as well as other adolescents my age”) and ‘pathways’ (Hope 4: “When I have a problem, I can come up with many ways to solve it” and Hope 6: “Even when others want to quit, I know I can find many ways to solve the problem”). The inclusion of these co-variances improved the model substantially (Model 2 in ; ). Upon closer inspection there appeared to be a semantic overlap in the content of the items with residual co-variances. While the model did not meet the cut-score threshold for RMSEA, at .063, the fit can be considered acceptable.
Figure 1. Overall model (pooled sample)
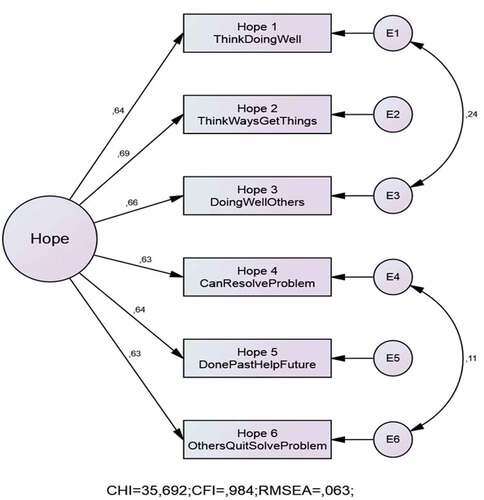
Table 2. Standardised regression weights for items on the CHS (Pooled sample)
Table 3. Fit statistics for the overall pooled sample and multi-group constrained models
presents the standardised regression weights for the overall model. Standardised estimates show adequate loadings for all items on the overall model ranging between .63 (Hope 4 and Hope 5) and .69 (Hope 2). These loadings suggest adequate contributions to the higher-order construct of hope by both agency (Hope 1, 3, 5) and pathways (Hope 2, 4, 6). The overall result of the CFA suggests that the scale is a satisfactory measure of a single higher order construct of hope.
6.3. Multi-group confirmatory factor analysis
We used MGCFA to test measurement invariance across language groups (English and Afrikaans). We tested measurement invariance through three steps. In the first step, we tested configural invariance with an unconstrained multi-group model (Model 3 in ). In the second step, we tested metric invariance by constraining the factor loadings across language groups (Model 4 in ). Finally, we tested scalar invariance by constraining the factor loadings and intercepts (Model 5 in ). We regarded each subsequent constrained model as tenable if the model fit did not worsen by more than .01 on the CFI (Cheung & Rensvold, Citation2002) and by .015 on the RMSEA and SRMR (Chen, Citation2007). represents the fit statistics for the various models.
The fit indexes for the multi-group models suggest a good fit structure for both constrained factor loadings (Model 4) and intercepts (Model 5), suggesting the tenability of scalar invariance. This indicates that the English and Afrikaans language groups are comparable by correlations, regression coefficients, and mean scores. presents the standardised regression weights and the significant mean differences. The overall mean score of the English language group presented as significantly higher than that of the Afrikaans group (see ).
Table 4. Standardised regression weights factor loadings and intercepts (Language)
7. Discussion and conclusion
This study presents the first translation and subsequent validation of the Afrikaans version of the CHS with a sample of children in the Cape Town Metropole, South Africa. The study found an acceptable reliability coefficient of .82, which is consistent with the original study by Snyder et al. (Citation1997) and subsequent validation studies conducted in South Africa (see Guse et al., Citation2016; Manuel et al., Citation2020; Savahl, Citation2020; Savahl et al., Citation2016). Snyder et al.’s (Citation1997) initial conceptualisation of the CHS presented a two-factor model. However, in the current study a two-factor model presented with a high correlation between the latent factors (.96). This raises a concern about multicollinearity, which could lead to large standard errors, and suggests that the two factors are indistinguishable from one another (Savahl, Citation2020). One of the original scale authors (S.J. Lopez et al., Citation2000) acknowledged the supposition of a one-factor model and recommended further exploration of the structure of the CHS (Savahl, Citation2020). In the current study, our findings do not support the supposition of a two-factor model. A single factor model presented with an excellent fit which resonates with recent validation studies indicating good scale characteristics for a single factor model (see Bickman et al., Citation2010; Dew-Reeves et al., Citation2012; Savahl, Citation2020; Savahl et al., Citation2016), which means that the scale is a satisfactory measure of a unidimensional first-order construct of hope.
Confirmatory factor analysis demonstrated an appropriate fit structure for the overall pooled sample with the addition of two error co-variances. We supported the inclusion of these error co-variances given the semantic overlap between the correlated items. Multi-group confirmatory factor analysis demonstrated the tenability of scalar invariance across the English and Afrikaans language groups. This points to the equivalence of the items across the language groups, and suggests that the scores on the English and Afrikaans versions of the CHS are comparable across correlations, regression coefficients, and means. While the mean scores of both language versions fell within Bickman et al.’s (Citation2010) proposed cut-score categorisation of ‘medium hope’, it is lower than the standardised mean score of 4.781 reported by Savahl (Citation2020) in a recent population-based study conducted in South Africa. An important finding of the current study is that the overall mean score of the Afrikaans participants was significantly lower than that of their English-speaking counterparts. A plausible explanation of this finding is the likelihood that the Afrikaans-speaking participants attended schools that were located in low SES communities and typically present with lower levels of hope (see Savahl et al., Citation2016). We speculate that this finding is a residual outcome of the apartheid system, wherein Afrikaans first language speakers represent cohorts of the population that were subject to more extreme forms of marginalisation and social exclusion. Afrikaans first language speakers in Cape Town are therefore more likely to be located in low-SES communities. It is, therefore, less about the language and more about the constrained social conditions associated with being an Afrikaans first-language speaker from historically disenfranchised contexts. Here it is important to note that Afrikaans is also the first language of privileged South African citizens of European (Dutch) descent. This cohort represents a much smaller proportion of the population and have historically been afforded access to opportunities and resources. This sub-set of the population typically resides in well-resourced communities characterised by low levels of crime, high employment, access to good municipal services and well-resourced schools (Adams et al., Citation2019).
Given the linguistic and cultural diversity in South Africa, we recommend conducting further research to assess the validity of the CHS across other language groups and populations in this context. Noting the socio-economic diversity of first-language Afrikaans speakers in South Africa, it would be revealing to ascertain the level of hope of Afrikaans speakers from more privileged contexts. Researchers and practitioners should also take cognisance of the diverse dialects of Afrikaans. Finally, while the Afrikaans translated version that we provide presented with appropriate structural validity and measurement invariance, we recommend pre-testing the instrument in the specific context in which it is intended for use.
Appendix 1. Vertel vir ons asseblief hoe jy oor die volgende voel
Additional information
Funding
Notes on contributors
Donnay Manuel
Shazly Savahl is a registered research psychologist and associate professor based at the Department of Child and Family Studies at the University of the Western Cape. His research interests include the study of childhood, children’s subjective well-being, child well-being indicators and social psychology. Currently, he is the principal investigator of the Children’s Worlds International Survey of Children’s Well-Being, and the Multinational Qualitative Study on Children’s Understanding of their Well-Being. The research reported in the current study forms part of the Children’s Worlds Survey, which is the largest multinational study that aims to collect children’s subjective perceptions and evaluations of their well-being across different contexts and domains.
References
- Adams, S., Savahl, S., & Casas, F. (2016). The relationship between children’s perceptions of the natural environment and their subjective well-being. Children’s Geographies, 14(6), 641–16. https://doi.org/10.1080/14733285.2016.1157571
- Adams, S., Savahl, S., Florence, M., & Jackson, K. (2019). Considering the natural environment in the creation of child-friendly cities: Implications for children’s subjective well-being. Child Indicators Research, 12(2), 545–567. https://doi.org/10.1007/s12187-018-9531-x
- Atik, G., & Kemer, G. (2009). Psychometric properties of Children’s Hope Scale: Validity and reliability study. Elementary Education Online, 8(2), 379–390. http://ilkogretim-online.org.tr
- Bickman, L., Athay, M. M., Riemer, M., Lambert, E. W., Kelley, S. D., Breda, C., Tempesti, T., Dew-Reeves, S., Brannan, A., & de Andrade, A. R. V. (2010). Manual of the Peabody Treatment Progress Battery (2nd Ed ed.). Vanderbilt University. http://peabody.vanderbilt.edu/ptpb/
- Brislin, R. W. (1986). The wording and translation of research instruments. In W. J. Lonner & J. Berry (Eds.), Field methods in cross-cultural psychology (pp. 137–164). Sage.
- Browne, M. W., & Cudeck, R. (1993). Alternative ways of estimating model fit. In K. A. Bollen & J. S. Long (Eds.), Testing structural equation models. Sage.
- Byrne, B. M. (2010). Structural equation modelling with AMOS: Basic concepts, applications and programming (2nd ed. ed.). Routledge.
- Casas, F. (2017). Analysing the comparability of 3 multi-item subjective well-being psychometric scales among 15 countries using samples of 10 and 12-year-olds. Child Indicators Research, 10(2), 297–330. https://doi.org/10.1007/s12187-015-9360-0
- Casas, F., Bălţătescu, S., Bertran, I., González, M., & Hatos, A. (2013). School satisfaction among adolescents: Testing different indicators for its measurement and its relationship with overall life satisfaction and subjective well-being in Romania and Spain. Social Indicators Research, 111(3), 665–681. https://doi.org/10.1007/s11205-012-0025-9
- Casas, F., & Rees, G. (2015). Measures of children’s subjective well-being: Analysis of the potential for cross-national comparisons. Child Indicators Research, 8(1), 49–69. https://doi.org/10.1007/s12187-014-9293-z
- Chen, F. F. (2007). Sensitivity of goodness of fit indexes to lack of measurement invariance. Structural Equation Modeling: A Multidisciplinary Journal, 14(3), 464–504. https://doi.org/10.1080/10705510701301834
- Cheung, G. W., & Rensvold, R. B. (2002). Evaluating goodness-of-fit indexes for testing MI. Structural Equation Modelling,9(2), 235–255. https://doi.org/10.1207/S15328007SEM0902_5
- Ciarrochi, J., Heaven, P. C., & Davies, F. (2007). The impact of hope, self-esteem, and attributional style on adolescents’ school grades and emotional well-being: A longitudinal study. Journal of Research in Personality, 41(6), 1161–1178. https://doi.org/10.1016/j.jrp.2007.02.001
- De Klerk, G. (2002). Mother-tongue education in South Africa: The weight of history. International Journal of Sociological Language, 154, 29–46. https://doi.org/10.1515/ijsl.2002.011
- De Klerk, G. 2008. Cross-cultural testing. M. Born, C. D. Foxcroft, & R. Butter, Eds. Online readings in testing and assessment. 1–14. International Test Commission. http://www.intestcom.org/Publications/Publications/ORTA.php
- De Kock, F., Kanjee, A., & Foxcroft, C. (2013). Cross-cultural test adaptation, translation and tests in multiple languages. In C. Foxcroft & G. Roodt (Eds.), Introduction to psychological assessment in the South African context (4th ed ed., pp. 83–106). Oxford University Press.
- Dew-Reeves, S. E., Athay, M. M., & Kelley, S. D. (2012). Validation and use of the Children’s Hope Scale-Revised PTPB Edition (CHS-PTPB): High initial youth hope and elevated baseline symptomatology predict poor treatment outcomes. Administration and Policy in Mental Health, 39(1–2), 60–70. https://doi.org/10.1007/s10488-012-0411-2.
- Dixson, D. D. (2017). Hope across achievement: Examining psychometric properties of the Children’s Hope Scale across the range of achievement. SAGE Open, 7(3), 1–11. https://doi.org/10.1177/2158244017717304
- Guse, T., de Bruin, G. P., & Kok, M. (2016). Validation of the Children’s Hope Scale in a sample of South African adolescents. Child Indicators Research, 9(3), 757–770. https://doi.org/10.1007/s12187-015-9345-z
- Haroz, E. E., Jordans, M., de Jong, J., Gross, A., Bass, J., & Tol, W. (2017). Measuring hope among children affected by armed conflict: Cross-cultural construct validity of the Children’s Hope Scale. Assessment, 24(4), 528–539. https://doi.org/10.1177/1073191115612924
- Hellman, C. M., Munoz, R. T., Worley, J. A., Feeley, J. A., & Gillert, J. E. (2018). A reliability generalization on the Children’s Hope Scale. Child Indicators Research, 11(4), 1193–1200. https://doi.org/10.1007/s12187-017-9467-6
- Hox, J. J., & Bechger, T. M. (1999). An introduction to structural equation modelling. Family Science Review, 11, 354–373.
- Hu, L., & Bentler, P. M. (1999). Cutoff criteria for fit indexes in covariance structure analysis: Conventional criteria versus new alternatives. Structural Equation Modeling: A Multidisciplinary Journal, 6(1), 1–55. https://doi.org/10.1080/10705519909540118
- International Test Commission. (2017). The ITC Guidelines for Translating and Adapting Tests (Second edition ed.). [www.InTestCom.org]
- Jackson, D. L., Gillaspy, J. A., Jr, & Purc-Stephenson, R. (2009). Reporting practices in confirmatory factor analyses: An overview and some recommendations. Psychological Methods, 14(1), 6–23. https://doi.org/10.1037/a0014694
- Jovanović, V. (2013). Evaluation of the Children’s Hope Scale in Serbian adolescents: Dimensionality, measurement invariance across gender, convergent and incremental validity. Child Indicators Research, 6(4), 797–811. https://doi.org/10.1007/s12187-013-9195-5
- Kazdin, A. E., French, N. H., Unis, A. S., Esveldt-Dawson, K., & Sherick, R. B. (1983). Hopelessness, depression, and suicidal intent among psychiatrically disturbed inpatient children. Journal of Consulting and Clinical Psychology, 51(4), 504–510. https://doi.org/10.1037/0022-006X.51.4.504
- Kline, R. B. (2011). Principles and practice of structural equation modelling (3 ed.) ed.). Guilford Press.
- Lopez, S. J., Gariglietti, K. P., McDermott, D., Sherwin, E. D., Floyd, R. K., Rand, K., & Snyder, C. R. (2000). Hope for the evolution of diversity: On leveling the field of dreams. In C. R. Snyder (Ed.), Handbook of hope: Theory, measures and applications (pp. 223–240). Academic Press.
- Lopez, S. J., Snyder, C. R., & Pedrotti, J. T. (2003). Hope: Many definitions, many measures. In S. J. Lopez & C. R. Snyder (Eds.), Positive psychological assessment: A handbook of models and measures (pp. 91–106). American Psychological Association.
- Manuel, D., Florence, M., Adams, S., Mpilo, M., Delport, A., Pienaar, M., Sinclair, D., & Savahl, S. (2020). Preliminary structural validation of the Afrikaans version of the Children’s Hope Scale. Journal of Psychology in Africa, 30(2), 162–165. https://doi.org/10.1080/14330237.2020.1746568
- Marques, S. C., Pais-Ribeiro, J. L., & Lopez, S. J. (2009). Validation of a Portuguese version of the Children’s Hope Scale. School Psychology International, 30(5), 538–551. https://doi.org/10.1177/0143034309107069
- Marsh, H. W., & Hocevar, D. (1985). Application of confirmatory factor analysis to the study of self-concept: First- and higher-order factor models and their invariance across groups. Psychological Bulletin, 97(3), 562–582. https://doi.org/10.1037/0033-2909.97.3.562
- Marsh, H. W., Lüdtke, O., Muthén, B., Asparouhov, T., Morin, A. J. S., Trautwein, U., & Nagengast, B. (2010). A new look at the big five factor structure through exploratory structural equation modeling. Psychological Assessment, 22(3), 471–491. https://doi.org/10.1037/a0019227
- Meredith, W. (1993). Measurement invariance, factor analysis, and factorial invariance. Psychometrika, 58, 525–542.
- Millsap, R. E., & Olivera-Aguilar, M. (2012). Investigating measurement invariance using confirmatory factor analysis. In R. H. Hoyle (Ed.), Handbook of Structural Equation Modeling (pp. pp. 380–392). Guilford.
- Pulido-Martos, M., Jiménez-Moral, J. A., Lopez-Zafra, E., & Ruiz, J. R. (2014). An adaptation of the Children’s Hope Scale in a sample of Spanish adolescents. Child Indicators Research, 7(2), 267–278. https://doi.org/10.1007/s12187-013-9223-5
- Rees, G., & Main, G. (eds). (2015). Children’s views on their lives and well-being in 15 countries: A report on the Children’s Worlds survey, 2013-14. Children’s Worlds Project (ISCWeB.
- Rees, G., Savahl, S., Lee, B. J., & Casas, F. (eds). (2020). Children’s views on their lives and well-being in 35 countries: A report on the Children’s Worlds project, 2016–19. Children’s Worlds Project (ISCWeB). https://isciweb.org/wp-content/uploads/2020/08/Childrens-Worlds-Comparative-Report-2020.pdf
- Savahl, S. (2020). Children’s hope in South Africa: A population-based study. Frontiers in Psychology, 11, 1023. https://doi.org/10.3389/fpsyg.2020.01023.
- Savahl, S., & Adams, S. (2019). The relation between children’s participation in daily activities, their engagement with family and friends, and subjective well-being. Child Indicators Research. https://doi.org/10.1007/s12187-019-09699-3.
- Savahl, S., Casas, F., & Adams, S. (2016). Validation of the Children’s Hope Scale amongst a sample of adolescents in the Western Cape region of South Africa. Child Indicators Research, 9(3), 701–713. https://doi.org/10.1007/s12187-015-9334-2.
- Savahl, S., Casas, F., & Adams, S. (2017). Children’s subjective well-being: Multi-group analysis among a sample of children from two socio-economic status groups in the Western Cape, South Africa. Child Indicators Research, 10(2), 473–488. https://doi.org/10.1007/s12187-016-9392-0
- Snyder, C. R., Irving, L., & Anderson, J. R. (1991). Hope and health: Measuring the will and the ways. In C. R. Snyder & D. R. Forsyth (Eds.), Handbook of social and clinical psychology: The health perspective (pp. 285–305). Pergamon Press.
- Snyder, C. R. (2002). Hope theory: Rainbows in the mind. Psychological Inquiry, 13(4), 249–275. https://doi.org/10.1207/S15327965PLI1304_01
- Snyder, C. R. (2003). Measuring hope in children. Paper presented at the Indicators of Positive Development Conference, March. Washington, DC.
- Snyder, C. R., Hoza, B., Pelham, W. E., Rapoff, M., Ware, L., Danovsky, M., et al. (1997). The development and validation of the Children’s Hope Scale. Journal of Pediatric Psychology, 22, 399–421. https://doi.org/10.1093/jpepsy/22.3.399
- Southwood, F. (2013). Towards a dialect-neutral assessment instrument for the language skills of Afrikaans-speaking children: The role of socioeconomic status. Journal of Child Language, 40(2), 415–437.
- Steele, G., & Edwards, D. (2008). Development and validation of the isiXhosa translations of the Beck inventories: 2 item analysis and internal consistency. Journal of Psychology in Africa, 18, 217–226. https://doi.org/10.1080/14330237.2008.10820189
- Valle, M. F., Huebner, E. S., & Suldo, S. M. (2004). Further evaluation of the Children’s Hope Scale. Journal of Psychoeducational Assessment, 22(4), 320–337.
- van de Vijver, F. J. R., & Tanzer, N. K. (2004). Bias and equivalence in cross-cultural assessment: An overview. Revue Européenne de Psychologie Appliquée, 54(2), 119–135. https://doi.org/10.1016/j.erap.2003.12.004