
 ?Mathematical formulae have been encoded as MathML and are displayed in this HTML version using MathJax in order to improve their display. Uncheck the box to turn MathJax off. This feature requires Javascript. Click on a formula to zoom.
Abstract
A practical way to evaluate drying in porous building materials is through environmental conditioning drying curve where drying is influenced by external factors such as environmental conditions and by the material properties. However, attaining drying curves can be an extremely slow process, which can be unsuited with the schedule and the available resources. This work describes the drying process in porous building materials using the simulation tool “TRHumidade” for the determination of water content profiles inside those materials and comparing with the well-known simulation tool “WUFI Pro” and experimental results obtained by gamma ray. One of the main goals is to validate the use of TRHumidade and evaluate the better tool (TRHumidade vs. WUFI Pro) to describe liquid phase drying processes, to evaluate if the water content potential describes better the drying phenomenon. The numerical results obtained with TRHumidade and WUFI simulation tools are similar to the experimental ones obtained by gamma ray. In the surfaces, TRHumidade reveals better results than WUFI Pro. Those results means that the TRHumidade can easily be used to study the drying process of the porous building materials.
Public interest Statement
Drying control is essential to the correct performance of any building. Controlling it is important to safeguard inhabitants from adverse health effects and to protect the building itself.
A practical way to evaluate drying in porous building materials is through environmental conditioning drying curve where drying is influenced by external factors such as environmental conditions and by the material properties. However, attaining drying curves can be an extremely slow process, which can be unsuited with the schedule and the available resources.
This work describes the drying process in porous building materials using a new simulation tool “TRHumidade” for the determination of water content profiles inside those materials and comparing with the well-known simulation tool “WUFI Pro” and experimental results obtained by gamma ray.
The good results means that the TRHumidade can easily be used to study the drying process of the porous building materials.
1. Introduction
Drying can be defined as the process by which water leaves a porous building material being its understanding and knowledge necessary to predict the performance of those materials in service (Guiné, Citation2010; Maroulis & Saravacos, Citation2005).
When a saturated porous building material is in contact with an environment with constant temperature and relative humidity, it is possible to identify three drying phases with different drying speeds as can be seen in Figure (Berthier, Citation1980).
Figure 1. Different drying phases of a porous material.
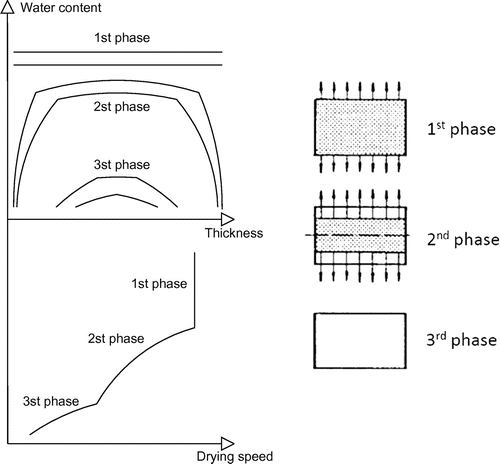
The first phase occurs when the capillary forces can feed the material surface in liquid water. It was possible to experimentally determinate, in the Building Physics Laboratory (LFC) of the University of Porto, Faculty of Engineering (FEUP), the period of that first phase that corresponds to 150 h for the autoclaved cellular concrete ACC (Freitas, Citation1992).
During this first phase the drying process is absolutely uniform, i.e. the water content is constant in the material interior.
When the water at the surface is scarce the wet front travels to the interior and the drying process becomes by diffusion at the wet front. A dried layer each time thicker is crossed and the flow becomes lower. This second phase stretched till both wet fronts turn out to be together (for materials drying in two parallel surfaces).
The third and last phase is extremely slower and corresponds to the hygroscopic steadiness. The drying speed is hardly influenced by the hygrothermal characteristic of the environment.
When considering the real variation of the environmental conditions like temperature, relative humidity, precipitation, solar radiation and wind pressure (that are the boundary conditions) and the material properties, the analysis of the drying process becomes too complicated (Karoglou, Moropoulou, Maroulis, & Krokida, Citation2005).
To solve that problem several authors have been presented numerical determination of water content profiles inside building materials, when in absorption or drying processes in accordance with Luikov and Philip-De Vries proposal. Great part of that studies are based on the relative humidity potential (as the WUFI Pro simulation tool is an example) instead of another possibility here studied based on the water content potential (TRHumidade) able to suitably simulate the drying process along a porous building material (Darolles, Citation1987; Sandelberg, Citation1973; Werner & Gertis, xxxx).
When in liquid phase, the water content potential can describe the water transport phenomenon giving very good approximations as can be seen in Section 3. The most common simulation tools, as is example WUFI Pro, usually represent the water transport phenomenon by the relative humidity potential. However the water content potential is more suitable for liquid water as a very short relative humidity variation corresponds on a great water content variation (Matiasovsky & Koronthalyova, Citation2006).
In this paper the authors intend to validate the numerical simulation program TRHumidade to be used for the evaluation of the water content, relative humidity and/or temperature inside building materials, in drying processes and to compare with another simulation tool, the WUFI Pro.
With the TRHumidade numerical results obtained for the drying simulations with ACC, it was possible to perform the validation of that tool, comparing them with the experimental test records (using real properties experimentally taken as inputs) and matching then with the WUFI Pro results too.
2. Material properties and hydric diffusivity importance
For the drying simulations the model’s needs, as input, several properties that depends on temperature and relative humidity. To guarantee correct inputs it was experimentally measured some necessary hygrothermal properties and detailed analyzed all hygrothermal properties of the ACC required by the simulation models.
The measured hygrothermal properties, used as inputs in the TRHumidade model, are bulk density (ρ → kg/m3), bulk porosity (ε → %), specific heat capacity (C → J/(kg K)), adsorption and desadsorption curves, water content (w → kg/kg), hydric diffusivity (Dw → m2/s), thermal diffusivity (Dt → m2/s) and thermal conductivity (λ → w/(m K)). For each material, all the properties depending on moisture content or temperature must be provided to the program according to the same set of moisture content values in the shape of a matrix. Table shows the hygrothermal properties (Freitas, Citation1992) that were used in the TRHumidade simulations.
Table 1. ACC hygrothermal properties used in the TRHumidade simulations
Each WUFI simulation involved the introduction of the following material properties: dry bulk density (ρ → kg/m3), specific heat capacity (C → J/kg K), porosity (ξ → m3/m3), adsorption and desadsorption curves, thermal conductivity (λ → W/m K), liquid transport suction coefficient (DWS → m2/s) and finally the water vapour diffusion resistance factor (μ → −). Table shows the hygrothermal properties that were used in the WUFI simulations.
Table 2. ACC hygrothermal properties used in the WUFI Pro simulations
In the drying simulations with the TRHumidade model, some sensitivity analyses were done and it was possible to notice that the hydric diffusivity (Dw → m2/s) has a massive importance in the obtained results. The hydric diffusivity, in isothermal conditions, can be defined as the parameter that link the gradient of the water content at the moisture flow (liquid phase to vapor phase). This parameter depends on the temperature but especially on the water content (Barreira, Delgado, & de Freitas, Citation2014).
Crausse (Citation1983) analyzed the hydric diffusivity possible determination techniques and concluded that they can be grouped into three families: hydric diffusivity direct calculation by experimental determination of the involved functions in the transference equations in isothermal conditions (De Vries, Citation1958); application of the full equations system validating the model with the experimental results in transient conditions; hydric diffusivity determination using the moisture transference equation in transient conditions by evaluation of the flow and the water content local gradients (Daian, Citation1986; Perrin, Citation1985).
All the methodologies can provide good results however, considering the possibility of quantifying water content profiles using the gamma ray device available in the LFC/FEUP, this last technique was here used for the determination of the hydric diffusivity values of the ACC with the difference of using one profile by the Boltzman variable.
It was only possible to do the experimental campaigned for the absorption but if the determination were done in the drying process the obtained results could be quite different. Some other materials with non-isotropic behavior can also present different hydric diffusivity in different directions (Gonçalves, Brito, Vidigal, Matias, & Faria, Citation2015).
So, it can be said that there are some important elements that can influence the hydric diffusivity values in a porous building material such us the determination technique, the difference between the absorption and the drying determination possible values, the non-isotropic properties and the possible bulk density different values between different samples (Èerný, Maděra, Kočí, & Vejmelková, Citation2009).
In Figure it is possible to see the Dw variation in the water content function for ACC and the values obtained by different authors are not the same. However must be renowned that the ACC considered by Kooi (Citation1971) is denser than Quenard, Salee, and Cope (Citation1989) and less dense that the one here studied.
Figure 2. Autoclaved cellular concrete (ACC) hydric diffusivity (Dw → m2/s) coefficient (Freitas, Citation1992).
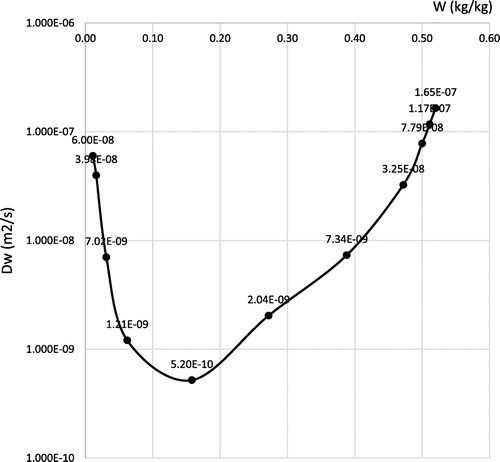
In the hygroscopic domain the ACC presented a decrease in the hydric diffusivity whenever water content grows in the opposite of the behaviour identified in the capillary domain as for the ACC Wcr = 0.278 kg/kg and Wsat = 0.680 kg/kg (De Freitas, Abrantes, & Crausse, Citation1996; Freitas, Citation1992).
3. Trhumidade and hydric diffusivity influence
The nonlinear transfer equations, which describe the drying liquid water transfer process in porous building materials, are presented in this section. Some simplifications such as restricting the model to a 1D dimension, disregarding the evaporation-condensation phenomenon and considering the weight moisture content are taking into account. The first simplification imposes that the transfer equations are in one state variable, x (only variations in x-direction in the element are considered and the properties in the other directions are assumed to be constant), vs. time t. Thus, the partial differential equations (PDE) that characterize this phenomenon can be presented as:(1)
(1)
(2)
(2)
where : moisture content (kg/kg);
: temperature (ºC); Dw (W, T): hydric diffusivity (m2/s); Dt (W, T): thermal diffusivity (m2/s); λ (W, T): Thermal conductivity (W/m K); C (W): specific heat (J/kg K); and ρ (W): bulk density(kg/m3).
In order to solve the PDEs above mentioned an implicit method called Crack Nicolson Algorithm is used (Becker & Kaus, Citation2014; Crank & Nicolson, Citation1997; Implicit methods: The crank-nicolson algorithm, Citation2015). In short, this method is numerically stable and it only requires the solution of a very simple system of linear equations (namely, a tridiagonal system) at every time level (Landman, Pel, & Kaasschieter, Citation2001).
Although mathematically, the parameters of hydric (Dw) and thermal (Dt) diffusivity have the same weight in Equation (1), the order of magnitude of these parameters that is assumed is very different, as can be seen in Figure .
Figure 3. Hydric and thermal diffusivity for autoclaved cellular concrete (ACC).
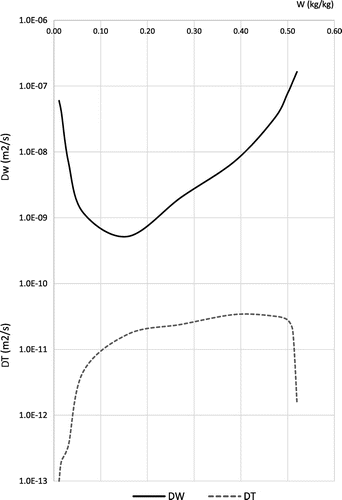
Considering that in the drying process the water content values are between Wcr = 0.278 kg/kg and Wsat = 0.680 kg/kg, the Dt variation is almost insignificant although the Dw variation becomes relevant as can be seen in the subsequent results.
4. Gamma ray drying water hydric profiles
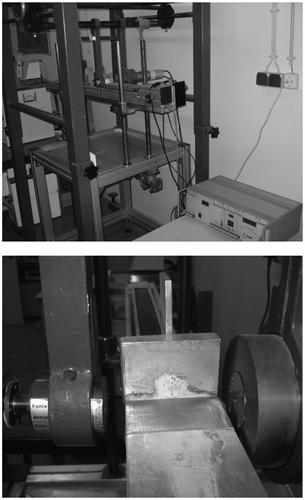
To the non easy determination of water content profiles for the ACC, was used a gamma ray equipment and was measure the water content hydric profiles of each specimen during the drying process—Figure .
Figure 4. Gamma ray equipment (left side); radioactive protected source, automatic ruler and detector (right side).
Before drying specimens were saturated by total immersion in water. To guarantee that those specimens were saturated serial weights were done till mass equilibrium.
The working principle of this technique is based on a radioactive source, gamma photons, which crosses the material with a certain thickness and suffer an attenuation, allowing the measurement of the material moisture content.
It is a non-destructive technique, which allows the measurement of moisture content of near-continuous form attended by a good accuracy of results. However, it is an expensive equipment, difficult to find in research laboratories.
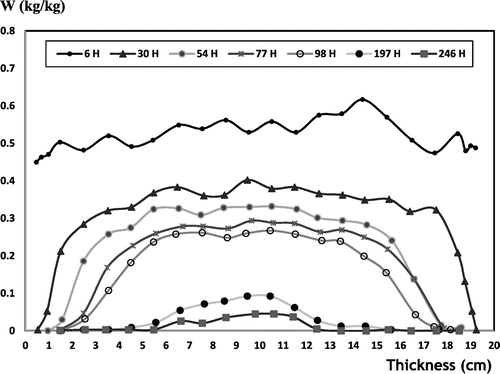
It was decided to dry some samples in laboratory natural conditions and others in an oven as the drying speed is hardly influenced by the hygrothermal characteristics of the environment.
For the ACC when the drying occurred in laboratory permanent natural conditions (at 20–25°C of temperature and with 40–60% of relative humidity) it is not so evident the identification of the transition between the first and the second phase (Figure ) as is if the temperature is higher using the oven (Figure ).
Figure 5. Autoclaved cellular concrete (ACC) water content gamma ray hydric profiles in laboratory “natural” drying (Freitas, Citation1992).
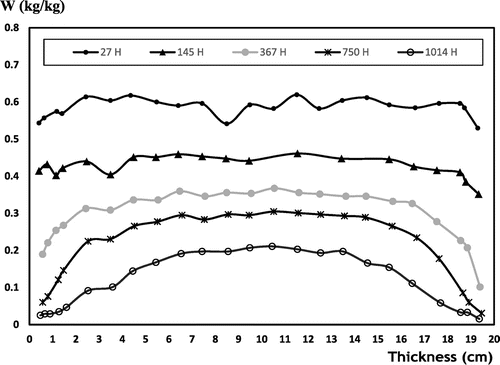
Figure 6. Autoclaved cellular concrete (ACC) water content gamma ray hydric profiles when drying in an oven at 75°C and 5% of relative humidity (Freitas, Citation1992).
Though when the drying process of the autoclaved cellular concrete (ACC) occurs in the oven at 75°C of temperature and with less than 5% of relative humidity, it can be perfectly seen the indentation of the wet front and the second phase of the drying process (Figure ).
The third phase of hygroscopic equilibrium can be verified when the water content are, far and wide, lower than the critical value which means that for the ACC should be lower than Wcr = 0.278 kg/kg. Regarding the experimental results the beginning of the third phase can be consider when it started to be difficult to identify an inflection between the dry area and the central landing.
For the ACC it was impossible to obtain, in the timetable, the maximum water content Wmax >> Wsat = 0.680 kg/kg, so the drying process started for values between 0.6 kg/kg and 0.8 kg/kg without a homogeneous distribution. Only at approximately 0.5 kg/kg could be obtained that uniformity without punctual variations as can be seen in Figure .
This ACC behavior can be addressed to the porous structure where exists a massive big porous that state the homogeneous behavior of the material.
5. Trhumidade drying water hydric profiles
5.1. Drying water simulations hydric profiles in autoclaved cellular concrete (ACC)
It was proposed to reproduce the experimental scenarios in laboratory natural conditions previously presented to evaluate the reproducibility of the results and to validate the model/tool for the drying process. The drying process in the oven at 75°C was not simulated as this program just allow temperatures between 10 and 50°C. In the future it is pretended to remove this limitation. The ACC properties and the boundary conditions (temperature and relative humidity) considered in each simulation as inputs were the ones that were measured and untaken in the experimental study (Cussler, Citation1997; Hall, Hoff, & Nixon, Citation1984; Mukhopadhyaya, Goudreau, Kumaran, & Normandin, Citation2002; Shyy, Citation1985; Spalding, Citation1972).
In the performed simulations the boundary conditions considered were 20°C for the temperature and 60% for the relative humidity, stables as medium values obtained in the experimental study.
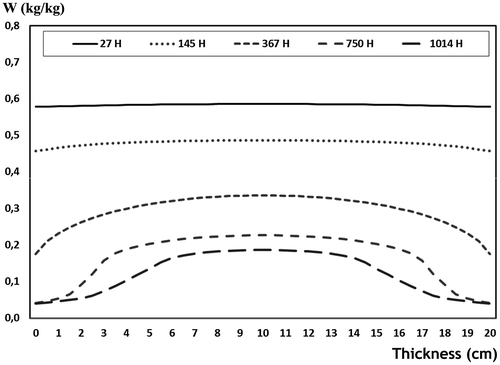
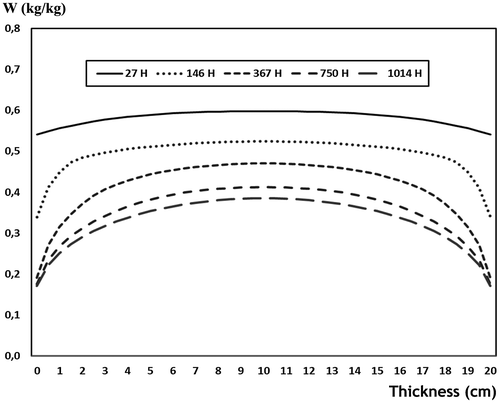
Autoclaved cellular concrete (ACC) water content drying simulation hydric profiles are presented in Figure .
Figure 7. Autoclaved cellular concrete (ACC) water content drying simulation hydric profiles.
5.2. Drying water simulations hydric profiles with different hydric diffusivity values
When several hydric diffusivity values, obtain by different authors, are compared it is possible to notice significant variations, as an important example is the ACC (Kooi, Citation1971; Quenard et al., Citation1989).
As previously stated, in the drying simulations, some sensitivity analyses were done and it was possible to sign that the hydric diffusivity (Dw → m2/s) has a great importance in the obtained results.
Considering that, it was done simulations with 10 × Dw and with Dw/10 to analyse the drying process using high and low Dw values.
In order to analyse the drying process using high and low Dw values, simulations with 10 × Dw and with Dw/10 were performed. The obtained results were completely different as can be seen in Figures and .
Figure 8. Autoclaved cellular concrete (ACC) water content drying simulation hydric profiles with 10 × Dw.
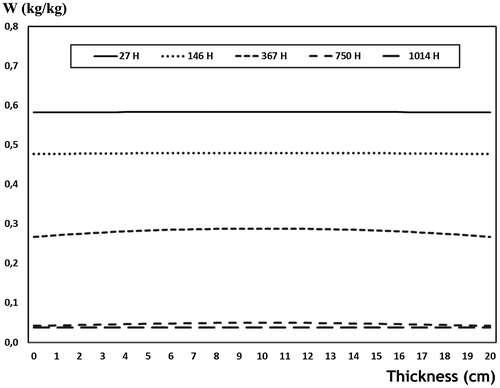
Figure 9. Autoclaved cellular concrete (ACC) water content drying simulation hydric profiles with Dw/10.
Although the small magnitude of the hydric diffusivity coefficient (10−6 to 10−9) this parameter is essential to the accuracy of the acquired results. It can be said that in each simulation it is crucial to analyse the hydric diffusivity (Dw → m2/s) correct value to introduce as an input.
Several other simulations were done to analyse the drying process using more than a few Dw values. The obtained results allow the definition of a specific behaviour of those materials when changing the Dw value. When the Dw grows the drying process becomes faster even in the surfaces. When Dw is lower the drying process reduces much more in the interior and reduces a little in the surfaces.
6. Wufi pro drying water hydric profiles
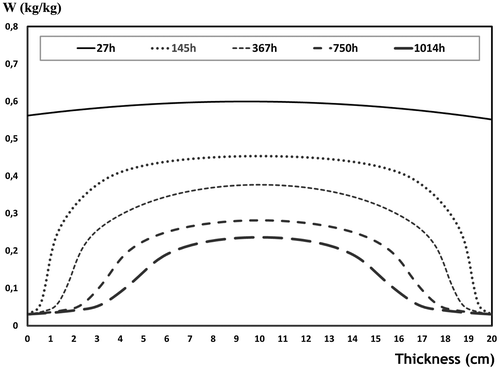
It was again reproduced the experimental scenarios previously presented to evaluate the reproducibility of the results and to compare with the model/tool TRHumidade the drying process.
In the performed simulations the boundary conditions considered were the same as in TRHumidade, i.e. 20°C for the temperature and 60% for the relative humidity, stables as medium values obtained in the experimental study.
Autoclaved cellular concrete (ACC) water content drying simulation hydric profiles are presented in Figure .
Figure 10. Autoclaved cellular concrete (ACC) water content drying simulation hydric profiles.
7. Results comparison and discussion
With the goal of validating the simulation tool TRHumidade to predict drying liquid water in porous building materials it is important to compare the measured values with the calculated ones. The comparison between those results and the ones obtained by a well know and validated tool as is the case of WUFI Pro is also a goal as TRHumidade is based on water content potential and WUFI Pro in relative humidity potential.
Autoclaved cellular concrete (ACC) comparison between water content gamma ray hydric profiles experimentally measured and water content simulation hydric profiles obtained with TRHumidade during the drying process for the same time are presented in Figure . Autoclaved cellular concrete (ACC) comparison between water content simulation hydric profiles obtained with TRHumidade and WUFI Pro during the drying process for the same time are presented in Figure .
Figure 11. Autoclaved cellular concrete (ACC) water content hydric profiles results comparison (gamma ray vs. TRHumidade).
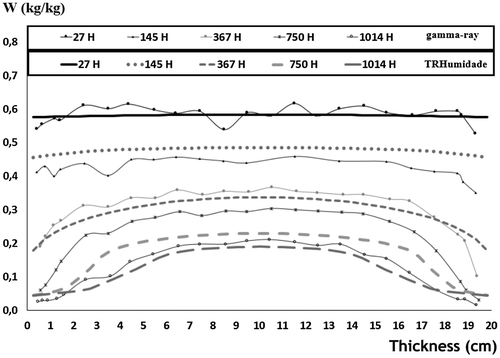
Figure 12. Autoclaved cellular concrete (ACC) water content hydric profiles results comparison (TRHumidade vs. WUFI Pro).
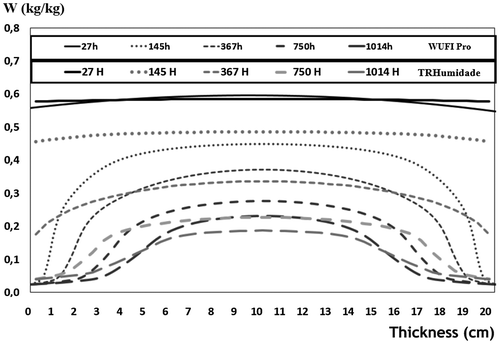
Having in mind the parameters involved and the complexity of the phenomenon it is considered that the results are alike all along the time using TRHumidade and also with WUFI Pro.
It is important to say that TRHumidade results for water content profiles, during the drying process of the ACC, were obtained considering the hydric diffusivity (Dw → m2/s) experimentally measured without any adjustment. It will be possible to obtain a better approximation between the numerical and the experimental results if the hydric diffusivity and the surface moisture transfer coefficients were adjusted. As was seen the hydric diffusivity has a great influence in the water transport process.
Water content simulation hydric profiles comparison between gamma ray experimental results and simulation results indicates a good accordance which allow to say that the numerical 1D model TRHumidade can be used to study the drying process of different building materials and components.
It is interesting to notice that using WUFI Pro, when near surfaces, the program consider equilibrium with the outside climate conditions. In the experimental study the results, near the surface, are quite different and the TRHumidade in this context presents interesting results. Should be curious to better analyse this phenomenon in the next future and better understand if the TRHumidade can be a better tool for this studies.
Another curious remark that can be stretched is that the predictions of the TRHumidade model overestimated the results in higher water contents (=0.5) and underestimated in lower water contents (<0.3). This means that during the drying first phase, where the drying process is uniform (the water content is constant inside the material) the model overestimate. When the water at the surface is scarce and the wet front travels to the interior (the drying process becomes by diffusion at the wet front), in the second phase, the model underestimated. As the TRHumidade model consider the water content potential instead of relative humidity potential as is done in WUFI Pro it is expected different behaviour in liquid and vapour phases.
8. Conclusions
The drying process is a very complex phenomenon defined as the process by which water leaves a porous building material being its understanding and knowledge necessary to predict the performance of those materials in service.
As the experimental evaluation of the drying process in porous building materials is an extremely slow process and difficult to experimentally obtain it was intended to use a simulation tool to predict it.
The simulation of water content drying profiles inside building materials can be obtained for different materials and environmental conditions being only necessary the knowledge of those materials properties and conditions.
Water content simulation hydric profiles comparison between experimental results and simulation results indicates a good accordance all along the time which allow to say that the numerical 1D model TRHumidade can be used to study the drying process of different building materials and components as is used the WUFI Pro.
Using WUFI Pro, when near surfaces, the program consider equilibrium with the outside climate conditions but in the experimental study the results, near the surface, are quite different and the TRHumidade in this context presents better results.
The predictions of the TRHumidade model overestimated the results in higher water contents (=0.5) and underestimated in lower water contents (<0.3). This means that TRHumidade model overestimate during the drying first phase (liquid water) and underestimated in the second phase (vapour).
Several simulations were also done to analyse the influence of the hydric diffusivity coefficient in drying process using more than a few Dw values. The obtained results allow the definition of a specific behaviour of those materials when changing the Dw value. When the Dw grows the drying process becomes faster even in the surfaces. When Dw is lower the drying process reduces much more in the interior and reduces a little in the surfaces.
It is proposed in the next future to hardly analyse the influence of each parameter involved in the simulation to evaluate the importance of getting a very precise value. The idea is to understand if each parameter is essential to the accuracy of the acquired results.
| Notations | ||
| = | Moisture content (kg/kg) | |
| = | Temperature (ºC) | |
| Dw (W, T) | = | Hydric diffusivity (m2/s) |
| Dt (W, T) | = | Thermal diffusivity (m2/s) |
| λ | = | Thermal conductivity (W/m K) |
| C | = | Specific heat (J/kg K) |
| ρ | = | Bulk density (kg/m3) |
Cover image
Source: Authors
Additional information
Funding
Notes on contributors
A.S. Guimarães
Our research group work on Building Physics, Technology, Pathology and Rehabilitation (Building Physics Laboratory-LFC, Porto University, Faculty of Engineering-FEUP). At the present moment we are working on material hygrothermal properties of building materials; comfort and energy efficiency; hygrothermal building performance; assessment of moisture migration through materials interface; study of materials drying process; buildings degradation by salts attach; treatment of rising damp (hygro-regulated wall base ventilation system); establishment of procedures for building assessment with infrared thermography for building diagnosis; proposal of a Predicted Human Life Quality Index; study of overheating problems in buildings; characterization of museums hygroscopic inertia; establishment of a benchmark for School Buildings; study of hygrothermal pathologies and use of ICT for the dissemination of knowledge.
Related Research Data
References
- Barreira, E., Delgado, J. M. P. Q., & de Freitas, V. P. (2014). Wetting and drying kinetics of building materials. Drying and wetting of building materials and components. Part of building pathology and rehabilitation book series (BUILDING, Vol 4, pp. 51–69). Switzerland: Springer.
- Becker, T. W., & Kaus, B. J. P. (2014). Numerical modeling of earth systems, An introduction to computational methods with focus on solid Earth applications of continuum mechanics (Lecture notes for USC GEOL557). Los Angeles, CA: University of Southern California
- Berthier, J. (1980). Diffusion de vapeur au travers des parois–Condensations (REEF, Vol. II, Sciences Bâtiment). Paris: CSTB.
- Crank, J., & Nicolson, P. (1997). A practical method for numerical evaluation of solutions of partial differential equations of the heat-conduction type. Advanced Computational Mathematics, 6, 207–226.
- Crausse, P. (1983, January). Étude fondamentale des transferts couplés de chaleur et d’humidité en milieux poreux non saturé (Thèses d’État). Institut National Polytechnique de Toulouse, Toulouse.
- Cussler, E. L. (1997). Diffusion: Mass transfer in fluid systems (2nd ed.). Cambridge: Cambridge University Press.
- Daian, J. (1986). François – Processus de condensation et transfert d′eau dans un matériaux meso et macro poreux. Étude expérimentale du mortier de ciment (Thèse). Institut National polytechnique de Grenoble, Grenoble.
- Darolles, D. (1987). Couplages transferts de chaleur e de masse à la surface de matériaux poreux utilisés en génie civil lor du séchage en ecoulements turbulents (Thèse). Université Paul Sabatier, Toulouse III.
- De Freitas, V. P., Abrantes, V., & Crausse, P. (1996). Moisture migration in building walls—Analysis of the interface phenomena. Building and Environment, 31, 99–108.10.1016/0360-1323(95)00027-5
- De Vries, D. A. (1958). Simultaneous transfer of heat and moisture in porous media. Eos, Transactions American Geophysical Union, 39, 909–916.10.1029/TR039i005p00909
- Èerný, R., Maděra, J., Kočí, J., & Vejmelková, E. (2009). Heat and moisture transport in porous materials involving cyclic wetting and drying. WIT Transactions on Modelling and Simulation, 48, 3–12.
- Freitas, V. P. D. (1992). Moisture transfer in building walls–Interface phenomenon analysis (PhD Thesis). FEUP, Porto (in Portuguese).
- Gonçalves, T. D., Brito, V., Vidigal, F., Matias, L., & Faria, P. (2015). Evaporation from porous building materials and its cooling potential. Journal of Materials in Civil Engineering, 27(8), 04014222.10.1061/(ASCE)MT.1943-5533.0001174
- Guiné, R. (2010). Analysis of the drying kinetics of S. Bartolomeu pears for different drying systems. EJournal of Environmental, Agricultural and Food Chemistry, 9, 1772–1783.
- Hall, C., Hoff, W. D., & Nixon, M. R. (1984). Water movement in porous building materials-VI. Evaporation and drying in brick and block materials. Building and Environment, 19, 13–20.
- Implicit methods: The crank-nicolson algorithm. (2015, June). Retrieved from https://www.dynamicearth.de/compgeo/Tutorial/Day2/cranknicholson.pdf
- Karoglou, M., Moropoulou, A., Maroulis, Z. B., & Krokida, M. K. (2005). Drying kinetics of some building materials. Drying Technology, 23, 305–315.10.1081/DRT-200047926
- Kooi, V. D. (1971). Moisture transport in cellular concrete roofs (Thesis). Delft: Eindhoven University of Technology, Waltman.
- Landman, K. A., Pel, L., & Kaasschieter, E. F. (2001). Analytic modelling of drying of porous materials. Mathematical Engineering in Industry, 8, 89–122.10.1163/156856401316891916
- Maroulis, Z. B., & Saravacos, G. D. (2005). Drying kinetics of some building materials. Brazilian Journal of Chemical Engineering, 22, 203–208.
- Matiasovsky, P., & Koronthalyova, O. (2006). Critical moisture contents for water and air transport in case of imbibition and drying tests. Proceedings of the 3rd International Building Physics Conference on Research in Building Physics and Building Engineering (pp. 43–48), Montreal.
- Mukhopadhyaya, P., Goudreau, P., Kumaran, K., & Normandin, N. (2002). Effect of surface temperature on water absorption coefficient of building materials, institute for research in construction (Report NRCC-45369). Ottawa: National Research Council.
- Perrin, B. (1985, January). Etude des transferts couplés de chaleur et de masse dans les matériaux poreux consolidés non saturés utilisés en Génie Civil (Thèse d’Etat). Université Paul Sabatier, Toulouse.
- Quenard, D., Salee, H., & Cope, R. (1989). Caractérisation microstructurale et hygrothermique des matériaux de constrution. CIB89: Paris.
- Sandelberg, I. (1973). Byggnadsdelars Fuktbalans naturligt Klimat (PhD dissertation, Report 43). Lund Institute of Technology, Lund.
- Shyy, W. (1985). A study of finite difference approximations to steady-state, convection-dominated flow problems. Journal of Computational Physics, 57, 415–438.10.1016/0021-9991(85)90188-3
- Spalding, D. B. (1972). A novel finite-difference formulation for differential expressions involving both first and second derivatives. International Journal for Numerical Methods in Engineering, 4, 551–559.10.1002/(ISSN)1097-0207
- Werner & Gertis. (1976). Energetische Kopplung von Feuchte und Warmeubertragung an Aubenflachen. In Hygrische Transportphänomene in Baustoffen, Deutscher AusschuB für Stahlbeton, Heft 258, Berlin.