
 ?Mathematical formulae have been encoded as MathML and are displayed in this HTML version using MathJax in order to improve their display. Uncheck the box to turn MathJax off. This feature requires Javascript. Click on a formula to zoom.
Abstract
The contributions of Moringa to the livelihoods of smallholder farmers in developing countries were massive. Its production has to be more than increased to maintain its potential role in-curving food and nutrition insecurity sufferings in these areas. However, empirical researches evaluating its impact at smallholder farmer level were missing to confirm. The current research aims to add to fill the missing literature gaps through a survey study on selected 464 producer and non-producer smallholder farmers from Wolaita and Gamo Gofa zones, southern Ethiopia. The Propensity to Score Matching (PSM) model was used to estimate the impact of Moringa production on household food and nutrition security. The validity of the model was checked and found binding to observe the causal effect of dependent and outcome variables in controlling selection bias. The finding indicated positive and significant differences among Moringa producer and non-producer smallholder farmers in selected food and nutrition security proxy variables, weekly calorie intake and food consumption score (FCS). Farmers producing Moringa were found more food and nutritionally secure than non-producers. It requires policies and development actions to perform on ways to advance the production and intensification of Moringa production in dry parts of the country.
PUBLIC INTEREST STATEMENT
The contributions of the Moringa tree to the Ethiopian economy remain largely untapped and underutilized. Every part of Moringa (such as roots, fruits, leaves, or seeds) is beneficial. It has socio-economic, medicinal, industrial and environmental values. In recent times Moringa has got a glimpse of attention from governmental and non-governmental sides. However, Moringa still needs massive consideration for its nutritional or economic values. It is highly required to invest in mechanisms to strengthen production and marketing on the benefits of indigenous tree species. Increased utilization of Moringa thus can contribute to food and nutrition security, health, livelihood, environment, and industries. This study confirmed the food and nutrition impact of Moringa. It informs policymakers to act on the possible means and interventions which can be employed to improve production and commercialization of the indigenous Moringa tree.
Competing interests
The authors declare that they have no competing interests.
1. Introduction
There are about 13 species of Moringa trees in the family Moringaceae (Ebert, Citation2014). They are native to India, the Red Sea area and/or parts of Africa including Madagascar. From these species, Moringa oleifera and Moringa stenopetala are the most commonly grown Moringa species in the tropics and subtropics (Melesse, Tiruneh, & Negesse, Citation2011).
Moringa oleifera is massively known and utilized in Asia. It has been accorded research and development attention. Moringa oleifera is native to sub-Himalayan tracts of northern India and is commonly referred to as “horseradish tree” or “drumstick tree” (Foidl, Makkar, & Becker, Citation2001; Jahn, Citation1991). This multipurpose tree has been introduced to Ethiopia over the last few years and is grown on nursery sites parallel to Moringa stenopetala in southern parts of the country (Melesse et al., Citation2011). Moringa stenopetalaon the other side is a multipurpose tree, native to the East African lowlands, that has been shown to be an even more promising coagulant crop for water clarification in the tropics than the “pan-tropical” horseradish tree Moringa oleifera (Melesse et al., Citation2011).
Historically, Moringa was highly valued in the ancient world. According to Fuglie (Citation1999) the Romans, Greeks, and Egyptians extracted edible oil from the seeds and used it for perfume and skin lotion. In the 19th century, plantations of Moringa in the West Indians exported the oil to Europe for perfumes and lubricants for machinery. People in the Indian sub-continent have long used Moringa pods for food. It is indicated that the edible leaves are eaten throughout West Africa and in parts of Asia (Fuglie, Citation1999).
It is mainly grown in the Southern part of Ethiopia. It grows in Konso,Gamo Gofa, Wolaita, Sidamo, Kaffa administrative regions and other parts of southern Ethiopia. Moringa is the cultural food for 14 nationalities in the south region and constitutes 50% of their food intake (Seifu, Citation2015).
The studies in nutritional aspects indicated the exciting benefits of Moringa. Its fresh leaves have 4 times the vitamin A of Carrots, 7 times the vitamin C of Oranges, 4 times the Calcium of Milk, 3 times the Potassium of Bananas, 3/4 times the Iron of Spinach, and 2 times the protein of Yogurt (Gopalan, Sastri, & Balasubramanian, Citation1989). Dried leaves contain 10 times the Vitamin A of Carrots, the 1/2 times Vitamin C of Oranges, 17 times the Calcium of Milk, 15 times the Potassium of Bananas, 25 times the Iron of Spinach, 9 times the Protein of Yogurt (Fuglie, Citation1999). In Ethiopia and other developing countries, with its rich essential nutrients, it is believed to play a vital role in curbing malnutrition problems persistent in many parts of the country (Desalegn, Tadesse, & Yirgu, Citation2012; Seifu, Citation2015).
Although it has a higher potential role to play incurving food insecurity, developing countries are suffering the challenge which is amongst the great problems in the areas (Fuglie, Citation2005).Malnutrition causes a great deal of human suffering and is associated with more than half of all deaths of children worldwide. Malnutrition severely impacts on the socio-economic development of a nation because a workforce that is stunted both mentally and physically may have a reduced work capacity. The interaction of poverty, poor health, and poor nutrition has a multiplier effect on the general welfare of the population and also contributes significantly towards keeping a population in a downward trend of poverty and nutritional insecurity. Thus, nutrition plays an important role in the reproduction of poverty from one generation to the next.
In countries like Ethiopia, Moringa has a great role in food security and improve the livelihoods of smallholder farmers (Desalegn et al., Citation2012; Ethiopian Public Health Institute [EPHI], Citation2014; Melesse et al., Citation2011; Seifu, Citation2015). It is also perceived as a source of food, medicinal, nutritional, industrial and environmental benefits (Baba, Yakubu, Yelwa, & Haruna, Citation2015; EPHI, Citation2014; Melesse et al., Citation2011). Despite its significant economic contributions to the livelihood of millions of people in southern Ethiopia, Moringa has not been given due research and development attention.
Therefore, there is a need to conduct an empirical study to confirm the significant socio-economic contributions of Moringa to the livelihood of millions of people in the country. More specifically, it requires scientific researches to evaluate its impact on food and nutrition security. Considering this fact current study perceived as a shred of good scientific evidence for communities and policymakers aiming to enhance the role of Moringa to the countries food sector.
2. Methodology
2.1. Description of the study area
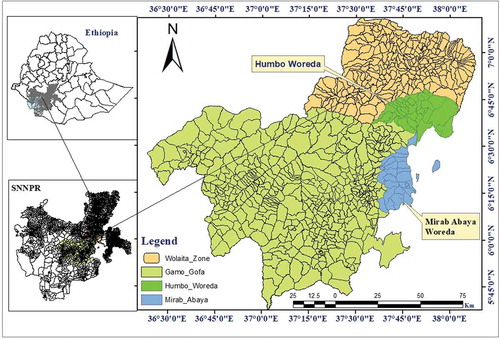
Wolaita and Gamo Gofa zones are two adjacent zones among the 13 zones in the Southern Nations Nationalities and Peoples Regional State (SNNPR) of Ethiopia where Moringa is extensively produced. Wolaita Sodo is an administrative center of the Wolaita zone. Arba Minch is an administrative center of the Gamo Gofa zone. Wolaita and Gamo Gofa zones are located in between 350–500 km south of Addis Ababa on the Sodo-Gamo Gofa main road. Wolaita zone is subdivided into 12 districts. The zone has a total area of 4512 km2, administratively divided into 12 districts (locally termed woredas). Based on the 2007 census conducted by the Central Statistical Agency of Ethiopia, the total population of the zone is nearly 2,473,190. Gamo Gofa zone has a total area of 18,010.99 km2, administratively divided into 18 districts (locally termed woredas). Based on the 2007 census conducted by the Central Statistical Agency (CSA) of Ethiopia, the zone has a total population of 1,593,104. Figure below demonstrates the study area setting.
Figure 1. The study area setting
2.2. Sampling design
Based on the actual production potential of Moringa the data was collected from Southern Nations Nationalities and Peoples Regional state (SNNPR) of Ethiopia. Among various Moringa growing zones in the region, the data was collected from two randomly selected zones, Wolaita and Gamo Gofa. From these zones, based on personal observation Humbo district (Wolaita zone) and Mirab Abaya district (Gamo Gofa zone) have a relatively higher potential of Moringa growing than other districts in these zones. Thus, these districts were selected. The total amount of sample respondents selected from each district was determined by using the probability proportional to size method. The study used a multistage sampling technique. That is first, two Moringa growing districts from two randomly selected zones were identified based on their potential to grow Moringa, one from each zone. Then based on actual production potential, four Moringa growing kebeles from each district were selected among other Moringa growing kebeles.Footnote1 In the third stage, based on proportional to the total sizes of households in each kebele, respondents were selected from respective kebeles. Finally, simple random sampling was used to select respondents in the sampled kebeles. For determination of the total sample size the Kothari formula below was used as described in the EquationEquation (1)(1)
(1) (Kothari, Citation2004);
Where; n is the sample size; Z is the standard cumulative distribution that corresponds to the level of confidence with the value of 1.96; e is desired level of precision; p is the estimated proportion of an attribute present in the population with the value of 0.5 as suggested by Israel (Citation1992) to get the desired minimum sample size of households at 95% confidence level and ± 5% precision; q = 1-p; and N is the size of the total population from which the sample is drawn.
Based on the above total sample size determination formula the minimum sample size is 359. However, with a non-response rate of about 29% and the aim of making current research more reliable the total sample size was set to 464. To make the control group compared to the treatment group 232 from Moringa producer (treated) households and 232 from non-producer (control) households were selected. As it has described in Table below the sizes of Moringa producing (treated) and non-producing (control) household on districts and kebele administrations were determined based on proportional to total size of Moringa producing (treated) and non-producing (control) households living in selected districts and kebele administrations.
Table 1. Sampled households based on districts and Kebele administrations
2.3. Measurement approachesto food and nutrition security
The complex issue in measuring food security is selecting the best indicator. The current study used one of the indicators mentioned in Lele et al. (Citation2016) that grouped indicators into eight different categories based on the underlying data source, and each of them might be used in various ways. The assessments provided in the study were for a total of 33 types of indicators, drawn from the growing universe of over 100 measures in current use. The indicators based on sources of data are national observations, market observations, household or individual recall, anthropometric measures, prevalence and depth of undernourishment, biomarkers and clinical data, breastfeeding and sanitation, composite indexes and multidimensional measures.
Among the above-mentioned indicators household or individual recall indicators considered to be the easiest way to get relevant data from households using questionnaires. The number of total calories from each food item intake per household is among the most useful household-level indicators of food security. Additionally, the Food Consumption Score (FCS) of food groups or prevalence of low diversity is another important indicator to measure food and nutrition security (Berry, Dernini, Burlingame, Meybeck, & Conforti, Citation2015; Lele et al., Citation2016).
In the current research, the difference in calorie intake between the treated and the control group was estimated. Moreover, the difference in FCS was used to evaluate the nutritional security impact of Moringa which is based on the food groups proposed by (Vhurumuku, Citation2014).
2.4. Analytical approach
In this part, various approaches to analyze food and nutrition security impact of specific intervention/exposure are discussed. As described that traditionally, researchers have tried to address the issue of confounding using multivariate matching methods, regression adjustment or stratification (Manca & Austin, Citation2008). These approaches though have limitations. Multivariate matching is impractical and often impossible when there are a large number of covariates. Regression adjustment requires the joint distribution of the covariates to be approximately the same between treatment groups. Stratification has limitations in that as the number of covariates increases the number of subclasses increases exponentially, making it difficult to create strata that contain both treated and untreated subjects.
An approach found convincing to current research is the Propensity Score Matching (PSM) model. PSM model is an important model in an observational study to estimate the effect of treatment on outcomes (Rosenbaum & Rubin, Citation1983).
The problem of biases from simple regression or logistic models made PSM a good option to look at causal effects in observational studies. As mentioned in Abate, Francesconi, and Getnet (Citation2014) PSM model used in this research has also the following three expected biases. The “selection on observables” which may arise due to sampling bias, the selection of a comparison group in the presence of externalities and lastly ‘selection on unobservable rising due to differences between producers and non-producers in the distribution of their unobserved characteristics. The third bias will not be removed but the quality of the data collection method, identification of relevant variables and the evaluation of matching quality used expected to reduce it (Abate et al., Citation2014)
Simple regression or logistic models also did not adjust for the distribution between the treated and control groups, the models suffer the problems of endogeneity and used to adjust for confounding covariates, but such models rely on assumptions regarding functional form.
According to Li PSM model is advantageous in computation of the causal effect, it is less susceptible to the violation of model assumptions (Li, Citation2013); it eliminates two sources of bias (Heckman, Ichimura, Smith, & Todd, Citation1998),the bias from non-over-lapping supports and different density weighting; if treatment assignment is strongly ignorable, in observational studies it estimates an Average Treatment Effect on Treated (ATT) close to the ATT calculated from experiments; the matching technique in PSM is nonparametric (not suffer from problems that are prevalent in most parametric models); it is much easier to understand than the interpretation using “control all other variables at mean” or “ceteris paribus.” in regression models.
Despite many advantages, PSM faces limitations on drawing statistical inferences, it has no established procedures to investigate whether treatment assignment is strongly ignorable, it cannot deal with unobservable variables, it depends on the quality of the observational data and little guidance in selected propensity score matching techniques (Li, Citation2013).
There is almost no technique perfect in drawing an unbiased causal inference. The research has tried to minimize limitations through quality data collection, the inclusion of most relevant variables and using recommended matching techniques. Therefore, PSM found as the best potential option for this study to observe the causal effect of Moringa production on food and nutrition security.
2.5. Methods of data analysis
The descriptive statistics and inferential and econometric methods of data analysis were used. The Data collected on demographic and household characteristics analyzed using descriptive and inferential statistics like means, standard deviation and mean differences. The econometric model Propensity to Score Matching (PSM) was used to evaluate the impact of Moring production on food and nutrition security of smallholder farmers. It is the most developed and popular strategy for causal analysis in observational studies (Rosenbaum & Rubin, Citation1985). It minimizes the effects of confounding and provides some of the advantages of a randomized study. The theoretical foundation for propensity score methods is based on the causal effect model introduced by (Rubin, Citation1974). Many non-experimental studies used propensity-score methods to estimate causal effects by balancing treatment and control groups on a set of observed baseline covariates. Full matching on the propensity score has emerged as a particularly effective and flexible method for utilizing all available data and creating a well-balanced treatment and comparison groups (Rubin, Citation1974). It attempts to simulate the conditions of an experiment in which recipients and non-recipients are randomly assigned, allowing for the identification of a causal link between treatment and outcome variables. For outcome variables, household calorie intake per week for food security and Food Consumption Score (FCS) including Moringa leaf intake per household for nutrition security were used as proxies.
The propensity score is the probability of receiving the treatment of interest conditional on measured baseline covariates: where X denotes the vector of measured control covariates and Z denotes treatment status (e = 1 for treated and Z = 0 for control). Let’s say
be the probability of producing Moringa where Z is a vector of observed control variables (socioeconomic/demographic). Propensity score matching constructs a statistical comparison group by matching individual treatment households with control households based on similarities in P (Z). Basically, there are two fundamental assumptions of these models which pertain to the estimation of the propensity model. As Rosenbaum and Rubin (Citation1983) defined treatment assignment to be strongly ignorable if the following two conditions hold: (I)
and (II)
the first condition says that treatment assignment is independent of the potential outcomes (food and nutritional security) conditional on the observed baseline covariates (demographic and other variables). The second condition says that every subject has a nonzero probability to receive either treatment (common support). This demonstrated that if treatment assignment is strongly ignorable, conditioning on the propensity score allows one to obtain unbiased estimates of average treatment effects. Assuming that both the conditional independence and common support conditions hold, the propensity score matching estimator for ATT can be expressed as follows:
This equation depicts that the propensity score matching estimator which is simply the mean food and nutritional security difference between producers and non-producers of Moringa over the common support area. The four major steps in propensity score analysis in observational studies are propensity score estimation, propensity score matching, matching quality evaluation and outcome analysis after matching.
For estimation of propensity scores, Logit and Probit are standard approaches mostly used with limited dependent variables (Greene, Citation2003), in current case producer or non-producer. Even if they provide almost similar output the current study has used the Logit regression model to estimate the propensity score, with the propensity scores being the predicted probabilities generated.
For propensity score matching several matching algorithms, such as nearest-neighbor matching (NNM), radius matching and kernel matching and others have been suggested (Heckman et al., Citation1998; Smith & Todd, Citation2005). In theory, all approaches should yield the same results when applied to large datasets. However, it is reassuring that in practice; the choice of matching method often appears to make little difference (Smith, Citation2000). Pragmatically, it seems sensible to try a number of approaches since the performance of different matching estimators varies case-by-case and depends largely on the data structure at hand (Zhao, Citation2003). Hence, the three mentioned algorithms were used to evaluate the food and nutritional security impact of Moring production.
For matching quality evaluation because of the matching procedure conditions on the propensity score and does not condition on individual covariates, one must check whether the distribution of variables is “balanced” across the producer and non-producer groups (Wu, Ding, Pandey, & Tao, Citation2010). The t-test for differences was used here (Rosenbaum & Rubin, Citation1985).
For outcome analysis after matching there are four ways to conduct. The outcome analysis on the matched data after propensity score matching, entire original data after subclassification, entire original data with propensity score weighting and entire original data with propensity score adjustment (Pan & Bai, Citation2015). This research used the first one from the above list.
Lastly, regarding variable choice statistical significance was used in relying on statistical significance. To do so first starts from parsimonious model specification and then `test up’ by iteratively adding variables to the specification. A newly added variable is kept if it is statistically significant at conventional levels (Heckman et al., Citation1998). Nevertheless, the identification of important independent variables was first made based on reviewing works of literature concerned with Moringa production and food security. Therefore, Table below shows the hypothesized relations ofindependent variables with dependent and outcome variables, respectively.
Table 2. Description of the variables
3. Results and discussion
3.1. Demographic and socio-economic characteristics
In this part, the results of the demographic and socio-economic characteristics of sampled households were presented and discussed. As it is displayed in the statistical summary provided in Table below, the equal proportion of Moringa producing 232 (50%) and non-producing 232 (50%) households were selected.
Table 3. Statistical summary of sampled Moringa producer and non-producer households
In some specified covariates Moringa producer and non-producer households are not different. The level of education, distance to the main road, access to irrigation and credit in the two groups are not significantly different. Moreover, the number of off-farm participants and non-participants are not significantly different between Moring producers and non-producer groups.
However, there is a significant mean difference in other variables. The outcome variables such as weekly calorie intake and FCS; and in the covariates like age, family size, type of housing, numbers of livestock and equines holding, per capita income, land size, farming experience and distance to market there is the significant mean difference between Moringa producers and non-producers.
The two outcome variables, weekly food calorie intake and FCS of Moringa producers are higher than non-producer households. The mean weekly calorie intake of producers (74,114.96) is greater than that of non-producers (68,619.3). Additionally, FCS of producers (49.73) is greater than non-producers (43.87).
Similarly, the covariate such as the mean age of Moringa producers (48.77) is greater than the non-producers (44.28). Moreover, the producer’s mean amount of family size (3.94 adult equivalent) is also higher than non-producing (3.50 adult equivalent) households. There are also a higher number of producers (0.97) living in iron-roofed houses than non-producers (0.91). Producers own more livestock (2.54 TLU) than none producers (1.93TLU). They also own more equines (0.19TLU) on average than non-producers (0.07 TLU). Additionally, the mean per capita income of producers (3994.75 ETB) is higher than the non-producers (3361.82 ETB). The landholding of producers (1.56 ha) is also higher than non-producers (1.25 ha). In average producers (25.39) stayed more year in farming than non-producers (21.72). When comparing the living distance of producers (0.62 km) from the nearest market with non-producers (0.37 km) producers live longer distances from the market.
However, for the purpose of controlling the confounding factors, the above results should not be used for inferring the impact of Moring production on household food and nutrition security. Thus, there is a need to conduct PSM for more reliable data.
3.2. Propensity score analysis and matching quality tests
As it is discussed in the methodology part there are four major steps in propensity score analysis, propensity score estimation, propensity score matching, matching quality evaluation and outcome analysis after matching. The propensity score estimation was conducted using a Logit regression model (Appendix ) on the chosen covariates in Table to obtain each individual’s propensity score. The identification of covariates was made using reviews of works of literature in previous studies related to the current study. The covariates predictive about the dependent variable, participation in Moring production and the outcome variables, food, and nutrition security were selected. Then the choice of identified variables was made using statistical significance relying on the statistical significance of each variable. The overall model fitness (Appendix ) and sensitivity and specificity report (Appendix ) of the model also show its good fitness. After estimation of the Propensity score (Appendix ) for each individual’s three algorithms of propensity score matching such as the nearest neighbor, radius (caliper = 0.005) and the kernel were implemented. The fulfillment of balancing properties for each matching algorithm Table was then checked.
Table 4. Matching quality tests
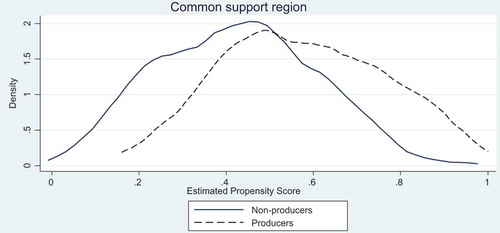
Before implementing outcome analysis after matching to evaluate the impact of Moringa production on food and nutrition security on households matching quality tests was performed. This part discusses some of these tests implemented in the study to check for the fulfillment of PSM assumptions of strongly ignorable conditions, the common support, and conditional independence or balancing property. The common support or overlap condition as shown in Figure below was satisfied. It indicates that an adequate common support region was created in between treated and control groups. The propensity score lies strictly between 0 and 1 is a good indicator of it. Therefore, it shows that there is sufficient overlap in the distribution of the estimated probability of Moringa production.
Figure 2. The density distribution of propensity scores for treated and control groups
The above steps were repeated multiple times to achieve the mentioned satisfactory balance. Lastly, to evaluate the impact of Moringa production on food and nutrition security the estimation of ATT is performed on 387 (192 treated and 195 controlled) (Appendix ) samples remained after removing observation which is out of support region.
As it is indicated in Table below that the other assumption conditional independence or balancing property is also satisfied. After performing the three matching algorithms nearest neighbor, kernel and radius the test for balancing property was made. It has indicated that the mean differences for the above-mentioned covariates were significantly smaller after matching when compared with before matching. The mean standard bias and median bias after matching were reduced to the level below 5%. The p-value of the likelihood ratio tests after matching shows that the covariates are not significantly different between treated and control groups. This is the best quality indicator for the fulfillment of the PSM assumption of conditional independence. Thus, if these two conditions are satisfied PSM model can be used as a good method for inferring the impact of Moring production on household food and nutrition security.
3.3. Food and nutritional security impacts of Moringa
As proxy variables for food and nutrition security weekly calorie intake and FCS were used to evaluate the impact of Moringa production on food and nutrition security. The estimated results of PSM using three (five nearest, kernel and radius) matching algorithms are displayed in Table below.
Table 5. PSM results: Average impact of producing Moringa on food and nutrition security (FNS)
The estimation results of ATT are obtained for weekly calorie intake and FCS using above mentioned matching algorithms. The five nearest neighbor, radius (caliper = 0.005) and kernel ATT results of weekly calorie intake are 5122.29, 4868.64 and 4425.20, respectively. Similarly, ATT results obtained from five nearest neighbors, radius and kernel matching algorithms for FCS are 6.21, 6.16 and 4.71, respectively. These estimations were made by using the “psmatch2” command in STATA 14. The standard error results were obtained by a bootstrap of 100 replications. The Z and P values of each matching algorithms show the positive and significant difference of ATT results of weekly calorie intake and FCS in between treated and controlled groups.
Consequently, based on observable covariates listed in Table above and controlling them the PSM estimation result obtained from the three (nearest neighbor, radius (caliper = 0.005) and kernel) matching algorithms in Table , indicate the positive and statistically significant impact of Moringa production on household food and nutrition security, as measured by weekly calorie intake and FCS. The ATT results indicate that Moringa producer households significantly on average receive 4425 up to 5122.29 more weekly calories than if they had not been Moringa producers and non-producers would have even received higher calorie intake than producers if they had produced Moringa. It also indicates that Moringa producer households on average receive 6.21 up to 4.71 significantly more weekly FCS than if they had not been Moringa producer and non-producers would have even received higher FCS than producers if they had produced Moringa.
Generally, the above PSM result shows that producing Moringa positively and significantly contributes to food and nutrition security than not producing Moringa. The result complies with findings of Seifu (Citation2015); Thurber and Fahey (Citation2009); Yisehak, Solomon, and Tadelle (Citation2011) and others. Nevertheless, these authors used different analytical methods. These studies used a review, qualitative and experimental methods to show the food security contribution of Moringa production in various parts of the world. The positive and significant effect of Moringa should not be considered only due to its direct contribution to food and nutrition security rather its possible multiplier effects in other livelihood issues, environment, health, and industry.
4. Conclusions and policy implications
The current study focused on the evaluation of food and nutrition security impacts of Moringa production in Wolaita and Gamo Gofa zones of Southern Nation Nationalities and the Peoples Regional State of Ethiopia. To achieve the main aim of the study PSM model was used to estimate the impact. The descriptive and inferential analysis results showed a positive and significant mean difference between Moringa produces and non-producers groups in observed outcome variables and covariates. The weekly calorie intake, FCS, age, family size, type of housing, numbers of livestock and equines holding, per capita income, land size, farming experience and distance to market are in mean significantly different between producer and non-producer groups. Before implementing PSM analysis it has checked the fulfillment of the two important assumptions of PSM estimation, the assumptions of strongly ignorable conditions or the common support and conditional independence or balancing property. The tests for assumptions of the PSM model and the main result found to be valid.
The PSM results indicated that based on observable covariates Moringa production is positively and significantly associated with the household’s food and nutrition security. The ATT results of household food and nutrition security proxy variables, weekly calorie intake and FCS are higher in amount for Moringa producer households than non-producers. Thus, it shows that producing Moringa positively and significantly contributes to food and nutrition security than not producing it.
It needs policy agents, the office of agricultural and rural development and administrates to work out on the mechanisms that may help to develop and maximize the benefits to be generated from Moringa production. Future activities to improve Moringa production should consider important demographic characteristics variables such as age, farming experience, distance to market, family size, income, livestock ownership, infrastructural access and extension access to farmers. In general, apart from food and nutrition security contributions, Moringa has benefits such as environmental, medicinal and industrial. Therefore, it needs activities to work on a means to increase the amount of Moringa production in dry parts of the country.
Lastly, future research works on measuring the level of farmer’s efficiency and factors determine production efficiency is found important to boost Moringa productivity in the area. It also needs further qualitative studies comparing Moringa based diets with other cultural meals in the Wolaita and Gamo Gofa Zones.
Authors’ contributions
The authors contributions are for Conceptualization: Alula Tafesse and Degiye Goshu; Methodology: Alula Tafesse, Degiye Goshu, Fekadu Gelaw; and Alelign Ademe; Software: Alula Tafesse; Validation:Degiye Goshu, Fekadu Gelaw and Alelign Ademe; Formal Analysis: Alula Tafesse; Investigation: Alula Tafesse, Degiye Goshu, Fekadu Gelaw and Alelign Ademe; Resources: Alula Tafesse.; Data Curation: Alula Tafesse, Degiye Goshu, Fekadu Gelaw and Alelign Ademe; Writing – Original Draft Preparation: Alula Tafesse; Writing – Review & Editing: Alula Tafesse, Degiye Goshu, Fekadu Gelaw, and Alelign Ademe; Visualization: Alula Tafesse; Supervision: Degiye Goshu, Fekadu Gelaw, and Alelign Ademe; Project Administration: Alula Tafesse; Funding Acquisition: Alula Tafesse.
Acknowledgements
Above everything, thanks to Almighty God for all unconditional support from start to end of this research. The authors would like to thank the Ministry of Education, Haramaya University and Wolaita Sodo University for provisions of an educational chance for the corresponding author. Moreover, the authors would like to thank staff members of Humbo and Mirab Abaya district level Agricultural office for providing the required data to the study beginning from the district experts to agricultural DA’s in each of the study Kebeles.The authors would like to thank two anonymous reviewers for constructive comments and suggestions in an earlier version of the article.
Data availability statement
Data that support the findings of this study are available upon request through the corresponding author.
Additional information
Funding
Notes on contributors

Alula Tafesse
Alula Tafesse is a Ph.D. scholar at Haramaya University, School of Agricultural Economics and Agribusiness. He is an Assistant Professor at the Department of Agricultural Economics, College of Agriculture, Wolaita Sodo University. His research interests include themes on natural resource and environmental economics, food and nutrition security, agricultural value chain analysis, impact analysis, agricultural productivity, and marketing.
Degye Goshu
Degye Goshu (Ph.D.) is an Associate Professor at the Department of Economics, Kotebe Metropolitan University.
Fekadu Gelaw
Fekadu Gelaw (Ph.D.) is Assistant Professor of Agricultural Economics, Institutional and Behavioral Economics, School of Agricultural Economics and Agribusiness, College of Agriculture and Environmental Sciences, Haramaya University.
Alelign Ademe
Alelign Ademe (Ph.D.) is Assistant Professor, Department of Agricultural Economics and Management, University of Swaziland.
Notes
1. The smallest administrativeunit in Ethiopia.
References
- Abate, G. T., Francesconi, G. N., & Getnet, K. (2014). impact of agricultural cooperatives on smallholders’technical efficiency: Empirical evidence from Ethiopia. Annals of Public and Cooperative Economics, 85(2), 257–16. doi:10.1111/apce.2014.85.issue-2
- Baba, M. D., Yakubu, G., Yelwa, J. M., & Haruna, L. (2015). Costs and returns of Moringa (Moringa oleifera) production in Zara local government area of Kebbi state, Nigeria. New York Science Journal, 8(1), 36–40.
- Berry, E. M., Dernini, S., Burlingame, B., Meybeck, A., & Conforti, P. (2015). Food security and sustainability: Can one exist without the other? Public Health Nutrition, 18(13), 2293–2302. doi:10.1017/S136898001500021X
- Desalegn, G., Tadesse, W., & Yirgu, A. (2012). Forestry and forest products in Ethiopia: Technologies and issues. Addis Ababa, Ethiopia: Ethiopian Institute of Agricultural Research.
- Ebert, A. (2014). Potential of underutilized traditional vegetables and legume crops to contribute to food and nutritional security, income and more sustainable production systems. Sustainability, 6(1), 319–335. doi:10.3390/su6010319
- EPHI. (2014, May 22–23). Paper presented at the Consultative Workshop on Moringa stenopetala to Maximize Its Potential Uses, Bishoftu, Ethiopia.
- Foidl, N., Makkar, H., & Becker, K. (2001). The potential of Moringa oleifera for agricultural and industrial uses. The Miracle Tree: the Multiple Attributes of Moringa, 45–76.
- Fuglie, L. J. (1999). The miracle tree: Moringa oleifera, natural nutrition for the tropics. Church World Service, Dakar, 68.
- Fuglie, L. J. (2005). The Moringa tree: A local solution to malnutrition. Church World Service in Senegal, 5,75–83.
- Gopalan, C., Sastri, B. R., & Balasubramanian, S. (1989). Nutritive value of Indian foods. National Institute of Nutrition, Indian Council of Medical Research, Hyderabad, India Revised Ed.
- Greene, W. H. (2003). Econometric analysis (5th ed.). Upper Saddle River, New Jersey: Pearson.
- Heckman, J., Ichimura, H., Smith, J., & Todd, P. (1998). Characterizing selection bias using experimental data (No. w6699). National bureau of economic research.
- Humbo and Mirab Abaya Agriculture District Office. (2019). Annual Report. Ethiopia: Humbo and Mirab Abaya.
- Israel, G. D. (1992). Sampling the evidence of extension program impact. Gainesville, FL: University of Florida Cooperative Extension Service, Institute of Food and Agriculture Sciences, EDIS.
- Jahn, S. A. A. (1991). The traditional domestication of a multipurpose tree Moringa stenopetala (Bak. f.) Cuf. in the Ethiopian Rift Valley. Ambio, 20(6), 244–247.
- Kothari, C. R. (2004). Research methodology: Methods and techniques. New Delhi : New Age International (P) Limited, Publishers.
- Lele, U., Masters, W. A., Kinabo, J., Meenakshi, J., Ramaswami, B., Tagwireyi, J., & Goswami, S. (2016). Measuring food and nutrition security: An independent technical assessment and user’s guide for existing indicators. Measuring Food and Nutrition Security Technical Working Group. Rome: Food Security Information Network. Available at http://www.fsincop.net/topics/fns-measurement.
- Li, M. (2013). Using the propensity score method to estimate causal effects: A review and practical guide. Organizational Research Methods, 16(2), 188–226. doi:10.1177/1094428112447816
- Manca, A., & Austin, P. C. (2008). Using propensity score methods to analyse individual patient level cost effectiveness data from observational studies. The University of York: Health Economics and Data Group Working Paper, 8, 20.
- Melesse, A., Tiruneh, W., & Negesse, T. (2011). Effects of feeding Moringa stenopetala leaf meal on nutrient intake and growth performance of Rhode Island Red chicks under tropical climate. Tropical and Subtropical Agroecosystems, 14(2), 485–492.
- Pan, W., & Bai, H. (2015). Propensity score analysis: Concepts and issues. Propensity score analysis: Fundamentals and developments. New York, USA: The Guilford Press.
- Rosenbaum, P. R., & Rubin, D. B. (1983). The central role of the propensity score in observational studies for causal effects. Biometrika, 70(1), 41–55. doi:10.1093/biomet/70.1.41
- Rosenbaum, P. R., & Rubin, D. B. (1985). Constructing a control group using multivariate matched sampling methods that incorporate the propensity score. The American Statistician, 39(1), 33–38.
- Rubin, D. B. (1974). Estimating causal effects of treatments in randomized and nonrandomized studies. Journal of Educational Psychology, 66(5), 688. doi:10.1037/h0037350
- Seifu, E. (2015). Actual and potential applications of Moringa stenopetala, underutilized indigenous vegetable of Southern Ethiopia: A review. International Journal of Agricultural and Food Research, 3(4). doi:10.24102/ijafr.v3i4.381
- Smith, J. (2000). A critical survey of empirical methods for evaluating active labor market policies (No. 2000-6). Research Report.
- Smith, J. A., & Todd, P. E. (2005). Does matching overcome LaLonde’s critique of nonexperimental estimators? Journal of Econometrics, 125(1–2), 305–353. doi:10.1016/j.jeconom.2004.04.011
- Thurber, M. D., & Fahey, J. W. (2009). Adoption of Moringa oleifera to combat under-nutrition viewed through the lens of the “Diffusion of Innovations” theory. Ecology of Food and Nutrition, 48(3), 212–225. doi:10.1080/03670240902794598
- Vhurumuku, E. (2014). Food security indicators. Integrated Nutrition Food Security Program Emerging, response, 1–2.
- Wu, H., Ding, S., Pandey, S., & Tao, D. (2010). Assessing the impact of agricultural technology adoption on farmers’ well‐being using propensity‐score matching analysis in Rural China. Asian Economic Journal, 24(2), 141–160. doi:10.1111/j.1467-8381.2010.02033.x
- Yisehak, K., Solomon, M., & Tadelle, M. (2011). Contribution of Moringa (Moringa stenopetala, Bac.), a highly nutritious vegetable tree, for food security in South Ethiopia: A review. Asian Journal of Applied Sciences, 4(5), 477–488. doi:10.3923/ajaps.2011.477.488
- Zhao, Z. (2003). Data issues of using matching methods to estimate treatment effects: An illustration with NSW data set. China Center for Economic Research, 1–37.
Appendix A.
STATA outputs
Logistic Regression