
 ?Mathematical formulae have been encoded as MathML and are displayed in this HTML version using MathJax in order to improve their display. Uncheck the box to turn MathJax off. This feature requires Javascript. Click on a formula to zoom.
Abstract
In this study, grass pea and orange peel flour were used to improve the quality and nutritional value of sorghum flour. Sorghum and grass peas were cleaned, washed, soaked, dried, milled, sieved, and blended with sieved orange peel flour in three different proportions. The chemical characteristics of the individual, and blend flours, in terms of proximate composition, mineral content, functional property, antinutrient composition, pasting property, functional groups, and antioxidant capacity were determined. The study was based on a blend ratio of (B1 = (80:15:5), B2 = (65:25:10), and B3 = (50:35:15)). The data were subjected to analysis of variance using Minitab statistical software. The results showed that the blend ratio had a significant (p < 0.05) effect on the characteristics of the blended flour.
PUBLIC INTEREST STATEMENT
Despite grass pea and sorghum being underutilized crops in Ethiopia; the production potential of the crops is enormous inside the country. Consequently, using the flour of sorghum and grass peas as an ingredient in food products solves the problem of shortage of plant protein within the diet served for consumption. Food products made from local grains are crucial for developing nations as they lower their reliance on imported wheat, increase the consumption of locally grown food, and enhance societal nutrition. Celiac disease (gluten sensitivity) is the most common dietary disorder among wheat-based products. As a result, foods might be created with composite flour instead of wheat to minimize the impact of disease. A cost-effective, efficient, and environmentally sound use of orange peel is advantageous both as a source of nutritious raw materials for food processing and as a means of reducing pollution.
1. Introduction
Developing countries such as Ethiopia are looking for an alternative to wheat to reduce foreign currency expenses due to imports. Wheat consumption may lead to a diet-related condition called celiac disease (Singh Sibian & Singh Riar, Citation2021). In Africa, where food resources are limited, sorghum has been used as a source of protein (Hadebe et al., Citation2017). Sorghum has been used in a variety of ways throughout Ethiopia. The grains are used to make porridge, infant food, and native beverages, among others. Although their nutritional qualities make them a viable source of valuable grains, industrially developed product from sorghum grain is not common in Ethiopia. Sorghum and grass pea have a wide distribution and great potential for production in Ethiopia. Grass pea (Lathyrus sativus L.) is a protein-rich legume that also contains lysine and minerals like zinc, calcium, phosphorus, iron, magnesium, and copper (Hanbury et al., Citation2000). It is also a nitrogen-fixing legume that can withstand drought and may be grown in harsh environments. Though grass pea is consumed in different forms, due to a neurotoxic substance called β-ODAP, its consumption is limited. Nevertheless, during processing, its concentration is possibly lowered to levels that do not pose a health risk (Buta et al., Citation2019). According to (Getahun et al., Citation2005), a symmetric crippling of the legs can result from eating too much grass pea daily for up to 1 kg over 2–3 months without interruption. According to (Lambein et al., Citation2001), an adult’s daily threshold intake of ß-ODAP is thought to be around 500 mg. Citrus by-products, notably peels, are high in dietary fiber, minerals, vitamins, natural flavonoids, a sort of secondary metabolite (Djilas et al., Citation2009), and phenolic content relative to the edible components.
2. Materials and methods
2.1. Raw material collection
The raw materials, sorghum (Sorghum bicolor L. Moench melkam), and grass pea (Lathyrus sativus L. wassie) were obtained from Debre Zeit and Awash Melkassa Agricultural Research Centre, respectively, while the orange (yerer variety) was purchased from a local market called Etfruit.
2.2. Raw material preparation
The sorghum grain was cleaned and washed to remove any foreign matter and dust, then soaked in grain-to-water ratio (1:3 w/v) for 24 hr to facilitate sprouting for 3 days after discarding the water used for soaking and sprinkled with water twice a day during sprouting, then dried at room temperature inside the laboratory before being processed into fine flour using a grinder. The flour was then sieved through a 250 µm test sieve (Pérez et al., Citation2008), sealed in plastic bags, and stored at room temperature until further analysis. All foreign materials, broken grains, and other contaminants were physically removed from the grass pea seed. The seeds were immersed in water for 24 hr to soak (Khalil et al., Citation2007). The seed to soaking medium ratio was 1:3 w/v. The pericarp was toughened and the endosperm was softened by water, making it easier to split the tissues. To remove the bran, the grain was hulled manually. Afterward, the hulled seed was dried inside the laboratory at room temperature for 2 days. Then, the seeds were ground and sieved using 250 µm mesh screen sieve (Germany, 2001, Model: AS200 digit) and flour was stored at room temperature in an airtight plastic container for further use. According to research, unit operations such as soaking and hulling reduce the amount of toxicity found in grass peas and do not pose a health risk if properly processed (Buta et al., Citation2019). To remove contaminants, debris, and dust particles, ripped fresh yellow oranges were washed in water, and the peel was separated from the juice, pulp, and seeds. The peel was cut into small pieces using a knife and was dried inside the laboratory at room temperature until being processed into fine flour using a grinder. The pulverized flour was sieved through a 250 µm test sieve, and a separate airtight plastic bag was used to keep the orange peel powder.
The blend ratio was set up based on a literature review and some previous studies (Rani et al., Citation2020; Kasprzak & Rzedzicki, Citation2012; Walle & Moges, Citation2017; Yigzaw et al., Citation2001); on the materials to be blended using a laboratory scale mixer (Ribbon Universal mixing blender), as shown in table . The lesser ratio of grass pea and orange peel was blended because of β-ODAP presence and negative impact on sensorial quality, respectively.
Table 1. Blend formulation
2.3. Statistical analysis
Triplicate data was analyzed and subjected to analysis of variance (ANOVA) using Minitab statistical software.
2.4. Nutritional composition
The crude protein of the samples was determined using the Kjeldahl Method and was multiplied by 6.25 to obtain the total protein in the sample. The moisture, fat, fiber, and ash content of the samples was determined using Official Method of the Association of Official Analytical Chemists (AOAC,Citation2005) with some modifications. The carbohydrate content was determined by subtracting the crude protein, moisture, total ash, and fat from the sample’s total dry weight. Gross energy was calculated according to (Osborne & Voogt, Citation1978). Mineral analyses were carried out using the atomic absorption spectrophotometric technique using the method of the (AOAC, Citation2005). The AAS model of MP—AAS − 4200 was used to determine the minerals (calcium (Ca), iron (Fe), and zinc (Zn)) of the flours.
3. Functional properties
3.1. Water holding capacity
Water Holding Capacity (WHC) was calculated using Traynham et al. (Citation2007) and Heywood et al. (Citation2002) methods, but with some changes. The following formula was used to compute WHC (g water/g flour):
W1= weight of the dry test tube
W2= weight of the test tube after decanting
3.2. Oil Absorption Capacity (OAC)
Adeleke and Odedeji (Citation2010) technique was utilized to determine the oil absorption capacity with some modifications. The following formula was used to compute OAC (g oil/g flour):
W1= weight of the dry test tube
W2= weight of the test tube after decanting
3.3. Determination of pH
The pH values were determined using (AOAC, Citation2005) official method with HANNA (made in Romania), HI 98,194 pH/EC/DO multipara meter.
3.4. Titratable acidity analysis
The method from (Drago, Citation1973) was used to determine the total titratable acidity of the samples. A beaker containing 3 g of the flour sample and 15 mL of distilled water was macerated for 30 min in a 1:5 (w/v) ratio of flour to water. To further dilute the sample and hydrolyze all of the acids, a known volume of water was used. To behave as a control, the water used for dilution was first titrated before the sample was titrated. To a water extract of the sample, three drops of 1% alcoholic phenolphthalein indicator were applied. The dispersion is then titrated to the phenolphthalein endpoint using a standard base (0.1 N NaOH). The percentage of lactic acid consumed by a specific amount of 0.1 N NaOH was provided as the test result. When the white dispersion transitioned from a bright white solution to a turbid one that was faintly pink in color, the titration was complete. Finally, the amount of lactic acid in the sample was calculated using the formula (1 mL of 0.1 N NaOH = 0.009008 mg of C3H6O3).
3.5. Solubility and swelling capacity
Solubility and swelling capacity were determined using Muttakin et al. (Citation2015) method with some modification. The following formula is used to compute the Solubility index and swelling power.
3.5.1. Bulk density
The bulk density of the samples was determined using (Odedeji & Adeleke, Citation2010) with minor modifications. To level the flour sample inside the measuring cylinder, a 50 g quantity of flour was placed inside a 100 mL measuring cylinder, and the cylinder was churned a little just to level. Then, the volume of the sample was recorded, and then the bulk density was calculated as follows:
3.5.2. Phytate content determination
Reagents for the experiment were prepared by adding 4.4 ml of HCl into a 250 mL volumetric flask to get 0.2 N HCl and 0.03% of FeCl3.6 H2O solution (A) was obtained by adding 0.03 g of FeCl3.6 H2O to a flask containing 50 mL of distilled water. 0.3 gm of Sulfosalicylic acid was added in 50 mL of distilled water to make a 0.3% Sulfosalicylic solution (B). To prepare the wade reagent, solution A and solution B were combined in equal proportions. A series of standard solutions (4 ppm, 8 ppm, 16 ppm, 24 ppm, and 32 ppm) from phytic acid containing 4–32 ppm in 0.2 N HCl was prepared. 3 mL of each standard solution was transferred into 15 mL centrifuge tubes and As a blank, 3 mL of 0.2 N HCl was applied. Wade reagent was added in 2 mL volumes to each tube, and each was then vortexes for 5 s. After that, for 10 min, the mixture was centrifuged at 3000 rpm. The absorbance was read at 500 nm, using water to make the spectrophotometer zero. The method (Vaintraub & Lapteva, Citation1988) was used to determine the phytate content. 0.05 grams of the sample were extracted for 1 hr at room temperature with 10 mL of 0.2 N HCl before being vortexed and centrifuged for 30 min at 3000 rpm. Three milliliters of the supernatant sample solution and 2 mL of the Wade reagent were mixed, homogenized, and vortexed for 2 min. The absorbance was determined at 500 nm in a UV–vis spectrophotometer. The phytate concentration inside the samples was calculated using the following formula, and the result was expressed as phytate concentration in mg/100 g.
Where:
As - absorbance of the sample, Ab - absorbance of the blank, and W- sample weight,
3.5.3. Tannin content determination
The method (Dykes, Citation2019) was used for tannin content determination. Replicates of 2 g of each freshly ground sample were weighed and transferred into centrifuge tubes. Each tube received 8 mL of 1% HCl in methanol, which was then mixed on a vortex mixer for 10 s before being kept in a water bath for 20 min. Each tube was vortexed for 10 s after the first 10 min of the incubation period and then put into the water bath for the rest of the incubation period. Each tube was taken out of the water bath after 20 min of incubation and shaken for 10 s on the vortex mixer. Catechin was used as a standard solution. To avoid contaminating the ground sample, the materials were centrifuged at 4000 rpm for 10 min. The supernatant was then carefully decanted away. Two aliquots of supernatant were taken (1 mL amount) and were placed into different test tubes. The first tube was regarded as the sample tube and the other tube as a blank. The tubes were placed into a water bath (30°C) and the timer was set to 20 min. 5 mL of the vanillin—HCl reagent was added to the tube containing the sample in each pair, and the timer was started after the vanillin reagent was added to the first sample tube. The reagent was added to each sample tube at 15 s intervals. After that, the absorbance was measured after 20 min at 500 nm. The spectrophotometer was adjusted with a 1% HCl methanol blank. The tannin concentration was calculated using the following formula, and the result was expressed as tannin mg/100 g fresh weight.
Where: Ab - absorbance of the blank, As - absorbance of the sample, W—sample weight, d is the density of the solution (0.791 g/ml).
3.6. Determination of antioxidant
3.6.1. Extract preparation
(Chew et al., Citation2011) method with minor changes was used for the extraction process in which, 5 g of each of the samples were weighed out, and 50 mL of 80% methanol (v/v) was added to each of these 5 g samples. The mixture was put in a conical flask and covered with aluminum foil before being shaken on an orbital shaker for 4 hr at 150 rpm. The supernatants were filtered using filter paper (Whatman-125 mm × 100 circles) and used for the analysis of antioxidant activity. The methanol was removed by using a rotary evaporator through evaporation at 60°C and the yield was weighed, and then an appropriate amount of methanol was added for each sample after multiplying and dividing the yield by 1000 and 50, respectively. The resulting extracts were stored for later analysis.
3.7. Determination of antioxidant activity—DPPH test
Determination of antioxidant activity using the DPPH test was carried out according to (Sokmen et al., Citation2004) with minor modifications, in which 0.004% w/v methanol—DPPH solution was prepared by diluting 0.004 g of 1,1-diphenyl−2-picrylhydrazyl in 100 mL of methanol. The absorbance of the methanol solution of DPPH was obtained at 517 nm and recorded as blanks. Stock solution 3 mg/10 mL was used for the standard ascorbic acid, and 150 µL of the crude extract was mixed with 2 mL of DPPH in methanol solution. To prepare the solutions with concentrations of 0.01, 0.02, 0.04, 0.08, 0.16, and 0.2 µg/mL, respectively, the stock solution was serially diluted. Each of the diluted solutions were incubated with 2 mL of 0.004% methanolic DPPH at room temperature in a dark cupboard after vortexing. Using a UV–vis spectrophotometer, the absorbance for each concentration was measured at 517 nm against a blank after 30 min of incubation. The percentage inhibition of free radical DPPH was calculated as follows below:
Where:
A control = Absorbance of the control (DPPH without the test fraction)
A sample = Absorbance of the sample
3.8. Determination of Ferric ion reducing antioxidant power (FRAP)
According to a procedure outlined by (Benzie & Strain, Citation1996), the FRAP assay was carried out. The FRAP reagent contained 20 mM FeCl36 H2O, 10 mM TPTZ in 40 mM HCl, and 300 mM acetate buffer (pH 3.6). The acetate buffer, TPTZ solution, and FeCl36 H2O solution were combined in a ratio of 10:1:1 (v/v/v) to produce the FRAP reagent. An aliquot (150 µL) of the sample in methanol was mixed with 3 mL of the fresh FRAP reagent and mixed properly, then it was incubated at 37°C for 30 min inside an electro thermal incubator (model DNP). At 593 nm, the absorbance was determined against a blank. The results were represented as mmol Fe2+/100 g extract using a calibration curve that was plotted using ferrous sulfate (5 mM) as the standard. Each sample was analyzed three times.
3.9. Preparation of acetate buffer (pH 3.6)
50 mL of distilled water were used to dissolve 0.46 g of sodium acetate, and 3.97 ml of glacial acetic acid was then added, and finally, the mixer was diluted to 250 mL to prepare an acetic acid buffer solution at a concentration of 300 mM.
3.10. Preparation of TPTZ solution
TPTZ weighing 0.16 g was taken using an analytical balance and dissolved with distilled water, and then 0.17 mL of concentrated hydrochloric acid was added. The solution was diluted to 100 mL to prepare TPTZ solution at a concentration of 10 Mm.
3.10.1. Preparation of FeCl3 solution
FeCl3⋅6 H2O weighing 0.27 g was dissolved in 50 mL distilled water to prepare 20 mM of FeCl3 concentration solution.
3.10.2. Pasting properties
A Rapid Visco—Analyzer was used to investigate the samples pasting properties (RVA − 4, Newport Scientific Pty. Ltd., Warriewood, NSW, Australia). 3.5 g of the flour sample and 23 mL of distilled water was used with the Rapid—Visco analyzer and the temperature was held initially at 50°C for 1 min and then ramped up linearly to 95°C for 3 min 42 s, held for 2 min 30 s, and cooled to 50°C for 3 min 48 s; and held at 50°C for 2 min (Qian & Kuhn, Citation1999), and then the peak 1, Trough 1, breakdown, final peak, setback, peak time, and pasting temperature was determined.
3.10.3. Fourier Transform-Infra Red (FTIR) spectrum of the flour
The FTIR (Thermo Scientific iS50 ABX spectra in the range of 4000–500 cm−1) was used to characterize the chemical structure of the flours and in order to understand the effect of the addition of orange peel and grass pea flour into sorghum flour on the chemical composition of the blend flours by identifying the functional groups present with the sample.
4. Results and discussions
4.1. Proximate composition and energy value of the individual and blend flours
Mean values of the samples showed that there were a statistically significant (P < 0.05) difference in protein content among all the blend and individual flours except for B1 (16.30 ± 0.50) and B2 (17.65 ± 0.44), between which there was no significant difference in protein content as the analysis of variance indicated. The protein content was increased with the incorporation of the grass pea and orange peel flour, however, the orange peel flour was found to have a lower protein content compared to the individual flours. Therefore, the grass pea flour increases the protein content of the blended flour significantly since it contains a significant quantity of protein compared to the orange peel flour which was blended in a lower proportion due to this the results were found to have an increase in protein content with an increment of grass pea and orange peel flours. This indicates the importance of grass pea flour for the fortification of sorghum flour to develop high-protein products. According to a study, foods made by combining two or more plant-based food ingredients are superior to those made from single plant-based food materials (Walle & Moges, Citation2017). The moisture content of the blended flours ranges from 8.76 % in B3 to 9.8 % in B1. An increase in fiber content may have resulted in reducing the moisture content of the biscuit samples due to its inherent functional property as observed by (Chung et al., Citation2014). The blend flour moisture content was less than the moisture content that could cause deterioration which indicates that each flour was more stable from moisture-dependent deterioration. Therefore, the increased percentage inclusion of grass pea and orange peel flour reduces the moisture content of the blended flours which can increase the shelf stability of the biscuits. As indicated from the result, the moisture content of the flours did not have a highly significant difference (P > 0.05) among all flours, except the orange peel flour. Because of variations in quantity among the individual ingredients, the statistical analysis shows that the ash content of both the individual and the blend flours were significantly different (P < 0.05). Compared to B2 and B1, B3 has significantly higher ash content. The high level of ash in B3 may be attributed to the formulation’s use of grass pea and orange peel flour. Therefore, adding grass pea and orange peel flour to cereals could result in enhanced mineral content. The crude fat contents of the blended flours were 2.69 %, 2.4 %, and 2.03 %, for B1, B2, and B3, respectively which showed that the difference in fat content among the blends was significant (P < 0.05). The fat content decreased with the addition of grass pea and orange peel flour. This could be due to the high fat content of sorghum flour in contrast to the individual flours (Lalude & Fashakin, Citation2006). showed that mixes of sorghum and oil seeds had a relatively greater fat content (9.87%) compared to unformulated samples. Fat content also plays a role in the shelf life stability of the flours.The crude fiber content of sorghum, grass pea, orange peel flours and the three blends were found to be significantly (P < 0.05) different where the highest value was observed in orange peel flour. The results revealed that the fiber content of composite flours was 8.1 %, 8.51 % and 9 % for B1, B2 and B3, respectively. The fiber content increased as the percentage inclusion of orange peel flour and grass pea flour increased. However, the hulled grass pea flour was found to have a lower crude fiber content compared to the individual flours. Therefore, we can say that orange peel flour increased the crude fiber content significantly compared to the grass pea flour this was due to the orange peel flour being a good sources of fiber which was found to have high level of crude fiber in the study. Numerous health advantages of fiber have been noted, including the prevention of several tumors and a decreased risk of hemorrhoids, diabetes, and high blood pressure (Ötles & Ozgoz, Citation2014). The total carbohydrate of the composite flours ranged between 68.75% for B1, 67.45% for B2, and 67.58% for B3. The carbohydrate composition of the composite flours decreased as the blending proportions of orange peel and grass pea flour increased. This was because of the much lower carbohydrate content of the grass pea flour, which might contain a low amount of starch, sugar content, and a higher amount of protein. As shown in the statistical analysis, there was a significant difference (P < 0.05) in carbohydrate content between the individual flours but not for the blend flours (P > 0.05). The energy value of the blend flours decreased with the increased proportion of grass pea and orange peel flour. This is due to the decreased content of crude fat and carbohydrate content of grass pea and orange peel flours even though there was an increase in crude protein content of the blend flours than sorghum flour. The results from the analysis indicated that there was a significant difference (P < 0.05) between the flours energy content except for B1 (364.41 kcal/100 g) and B2 (362.01 kcal/100 g), which were insignificant. In general, according to this study the different mean results of the samples composition indicated that grass pea flour was found to have higher level of crude protein, and lower level of crude fiber, and carbohydrate content, whereas orange peel flour was to have found higher level of ash, crude fiber, and carbohydrate content with lower level of crude protein, crude fat, moisture content, and energy value, as illustrated in table . Sorghum flour also showed that higher level of crude fat, moisture content, energy value, and lower level of ash content.
Table 2. Proximate composition and energy content of individual and blend flours
4.2. Mineral concentration of the individual and blend flours
As shown in the table, the individual and the blend flours have significant differences (p < 0.05) in Ca+2, Fe+3, and Zn+ contents. The highest calcium, iron, and zinc contents were observed in orange peel flour and the lowest in sorghum flour where calcium was an abundant micronutrient compared to iron and zinc throughout all the flour samples. Therefore, the high mineral content of orange peel and grass pea flour rather than sorghum contributes to the increment of the mineral content of the blend flours. The calcium contents of the individual and blend flours were found in a range of 49.84–927.04 mg/100 g, the highest value was found in orange peel flour, whereas the lowest was found in sorghum flour. The orange peel flour was diluted four times since there was a higher amount of calcium indication compared to the other samples; hence, it was multiplied by that dilution factor during the calculation. Some other researchers also reported higher amounts of calcium in orange peel (Roger Konan et al., Citation2013). The Ca+2 content of B1, B2, and B3 were 72.76, 148.86, and 227.04 mg/100 g, respectively, as indicated in Table . The value of iron for orange peel flour (13.76 mg/100 g) was the highest compared to the individual flours and B3 (5.08 mg/100 g) had the highest iron content among the blend flours. This might be because of the higher value of iron for the orange peel and grass pea flour compared with the sorghum flour. The result also indicated that zinc content of the flours ranged from 1.06 mg/100 g in sorghum flour to 2.24 mg/100 g in orange peel flour. Zinc content increased with the increase in blend ratio since orange peel and grass pea flours were found to have higher zinc content.
Table 3. Mineral content of the individual and blend flours
4.3. Functional properties of the flours
As the mean values of the flour samples indicated the water holding capacity of all the flours samples ranged from 1.08 (g/g) in grass pea flour to 2.85 (g/g) within orange peel flour. From the results, it can be noticed that the addition of orange peel and grass pea flour with sorghum flour increased the water absorption capacity of the blend flours, from1.12 (g/g) in B1 to 1.41 (g/g) in B3, although the grass pea flour had the lower WHC. Therefore, the increment in WHC of the blends is because of the much higher WHC of the orange peel flour compared to the grass pea flour. The degree of contact with water, the shortage of polar amino acids in flours, and conformational characteristics could all contribute to the variation in the flours’ ability to hold water (Houssou & Ayernor, Citation2002; Kuntz, Citation1971). The flours with a high level of water absorption capacity will therefore be useful in meeting the need for incorporation of orange peel flour into wheat flour for the bakery industry. Bakers can modify the functional characteristics of dough in baked items caused by an increase in WHC in food systems (Buckman et al., Citation2018). However, a material with a very high water absorption capacity may imbibe an inordinate amount of water, which would dry other system components. As a result, high water absorption is not always beneficial (Houssou & Ayernor, Citation2002). The result shows that there was an insignificant difference between the flours of sorghum, grass pea, and B1, but there was a significant difference (p < 0.05) in WHC of these flours compared to orange peel flour, B2, and B3, as illustrated in table . This could be due to the high WHC of the orange peel flour. Interactions between oil and hydrophobic protein groups lead to oil absorption. The OAC was increased with the addition of orange peel and grass pea flour into the sorghum flour with which B3 (1.41 g/g) being the highest followed by B2 (1.40 g/g) and B1 (1.3 g/g), which makes it the lowest among the blend flours according to the study. Although the grass pea flour had the lower OAC, the increment in OAC of the blends is because of the much higher OAC of the orange peel flour (1.76 g/g) in contrast to grass-pea flour (1.2 g/g). Therefore, increasing in the OAC can be credited to the higher OAC of orange peel flour, which suggested that the high content of non-polar side chain amino acids in the flour might bind the hydrocarbon side chain of the oil among the flours (Taira, Citation1974) and may be more accessibility of hydrophobic chains in orange peel flour since less hydrophobic groups are exposed on the surface of proteins because of their structure (Bala et al., Citation2020). The high OAC of the flour is desirable in foodstuffs that require taste preservation, and enhancement of appetizing properties since composite flour with a higher blend ratio improved mouth feel and preserved the flavor of the value-added product produced (Bala et al., Citation2020). The result shows that there was an insignificant difference between the flours of sorghum, grass pea, and B1, but there was a significant difference in OAC compared to orange peel flour, B2, and B3 flours. Bulk density determines the expansion and porosity within the flour. The bulk densities of the different flour samples were decreased from 0.65 g/mL (grass pea flour) to 0.52 g/mL (orange peel flour). Bulk density of blend flours showed B1 (0.55 g/mL) the least followed by B2 (0.58 g/mL) and B3 (0.59 g/mL) having the highest value, as the addition of orange peel and grass pea flour increased and this indicates that an increase in bulk density become insignificant with further incorporation of orange peel and grass pea flour. The higher bulk density implies the flour will occupy less space during storage and be more economical during transportation because more quantities can be transported. It has been determined that the increased bulk density values are a result of the protein content of the flour and the slightly increased ash content (Das et al., Citation2019). The individual flour samples were significantly different (p < 0.05) in bulk density, while further increases in orange peel and grass pea flours have an insignificant increase in bulk density, although the blend flours have a significant bulk density difference, according to this study. The titrable acidity of the orange peel flour was higher than the others which indicated that the amount of acid present in the orange peel sample was higher. Among the blend flours, B3 was found to have higher titratable acidity which was insignificantly different from B2. The increase in acidity had an effect on the organoleptic properties due to an acid concentration when the blend proportion increased. The swelling capacity of all the samples ranged from 212.04% (grass pea flour) to 617.67% (orange peel flour). The swelling capacity value of the blended flour increased from 250.38% in B1 to 292.01% in B3 with the increase in orange peel and grass pea flour. These may be due to the presence of high fiber content in the orange peel flour and the High water-holding capacity of the orange peel flour which gives rise to high swelling power. Since the negative charges made it simpler for water to enter the granules, the high phosphate content may have contributed to the rise in swelling power (Calliope et al., Citation2020). Since the amylose molecule is more heavily reinforced in high amylose concentration, poor swelling power has been associated with it (Hoover & Ratnayake, Citation2001). The release of soluble components is represented by the water solubility index (WSI). The solubility indices of all the flour samples ranged from 22.03% (sorghum flour) to 34% (grass pea flour). The solubility index of the blended flour increased from 25% in B1 to 29% in B3 with an increase in orange peel and grass pea flour. The WSI is influenced by the presence of molecules that can be dispersed, including oligosaccharides, albumins, sugars, amylose, and other soluble substances (Bala et al., Citation2020). High solubility is linked to a high amylose concentration because this substance is quickly released when the swelling process occurs (Bredariol et al., Citation2020). (Calliope et al., Citation2020) explain high solubility indices in starches to the amylose simple solubility because it is loosely attached to the remainder of the macromolecular structure and is released during the swelling process. The result from the analysis indicated that there was a significant difference (P < 0.05) in the solubility index between all the flour samples.
Table 4. Functional properties of the individual and blend flours
4.4. Anti-nutrient composition of the individual and blend flours
Antinutritional compounds were relatively high in grass pea flour compared to sorghum, orange peel, and blended flours, with phytate being the highest compared to the tannin content, as shown in table . In addition to reducing nutrient intake, digestion, absorption, and utilization, antinutrients can also have other negative impacts (Hanbury et al., Citation2000). Because of its capacity to attach to essential minerals such as calcium, iron, zinc, and protein composition, phytic acid has been regarded as an antinutrient (Požrl et al., Citation2009). The phytate content result showed that the phytate concentration of the individual and the three blends was significantly different (p < 0.05). The phytate content of all the flour samples ranged from 410.99 (mg/100 g) in B1 to 420.02 (mg/100 g) in grass pea flour. Protein and a number of other organic substances, such as amino acids and alkaloids, are precipitated by tannin. The tannin content of the flours varied from 144.34 mg/100 g to BDL. According to (Tasie & Gebreyes, Citation2020) the same results were also reported for the tannin content of sorghum flour, which was the variety called melkam. The highest value was observed for grass pea flour. The outcome demonstrated that increasing the proportion of grass pea and orange peel flour increased the tannin content of the blend flours.
Table 5. Anti-nutrient composition of the individual and blend flours
4.5. Antioxidant capacity of the individual and blended flours
Reactive oxygen species and free radicals produced by cellular metabolism or the peroxidation of lipids and other biological components have been scientifically accepted to play significant roles in the pathogenesis of chronic diseases like coronary heart disease and cancer. Antioxidants in food fight free radicals, which may help lower the chance of developing chronic diseases (Ragaee et al., Citation2011).
Significant differences (p < 0.05) were observed in DPPH and FRAP antioxidant capacity assays for the individual flours; this could be due to the higher and lower antioxidant capacity of the orange peel and grass pea flours, respectively, according to this study. An insignificant difference was observed for the blend flours and sorghum flour in the DPPH assay, which means that there was a comparable antioxidant capacity between the blend flours and the sorghum flour. There was an insignificant difference in antioxidant capacity between the blend flours, but there was a significant difference in antioxidant capacity compared to the sorghum flour in the FRAP assay, as illustrated in Table . An increase in the blend proportion showed that there was an increase in antioxidant capacity, but since the antioxidant capacity of the grass pea flour was lower there was an insignificant increase. Therefore, orange peel flour could be the cause for an increase in the antioxidant capacity of the blend flours. Results of antioxidant capacity were 21.30 ± 3.09 to 54.46 ± 2 2.42%, and 190.22 ± 0.71 to 311.53 ± 3.47 mmolFe2+/100 g extract in DPPH and FRAP, respectively, in all flour samples. As illustrated in Figure , the antioxidant capacity of the individual flours increases in higher amounts in orange peel and sorghum flour compared to grass pea flour, as the concentration increases. It also showed an increase in antioxidant capacity in B3 flour in higher amount as the concentration increased, and it was found that there was a lower antioxidant capacity at lower concentrations which increases as the concentration increased. All the results are in the range of the standard solution, as illustrated in Figure .
Figure 1. % inhibitions of the standard solution.
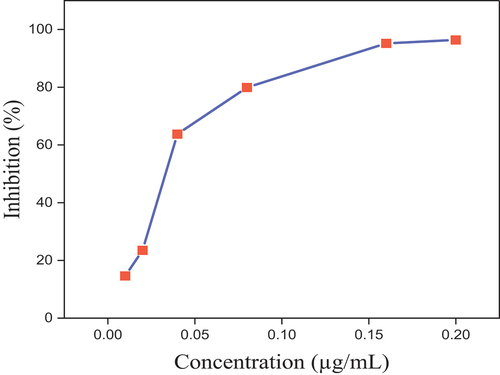
Figure 2. % inhibitions of the individual and blend flours.
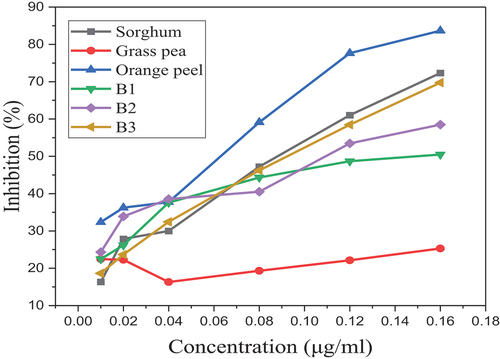
Table 6. Antioxidant capacity of the individual and blend flours
4.6. Pasting properties of the individual and blend flours
Trough 1, final peak, setback, peak time, and pasting temperature of the orange peel flour were higher than the other flours which could be due to the higher water-holding capacity of the orange peel flour, while peak 1, and breakdown of the grass pea flour was also higher compared to the others, as shown in table .
Table 7. Pasting properties of the individual and blend flours
The high peak time of the orange peel flour can be due to the high degree of swelling of the flour, which was indicated in this study. This shows the ease of orange peel flour during the baking process. The peak time and pasting temperature increased with the blend proportion compared to the sorghum flour which was shown at the first blend even though there was a decline in peak time and pasting temperature between the blend flours. Pasting temperature ranged from 80.60°C to 95.05°C for the individual flours, and 94.65–94.75°C for the blend flours in which the lowest being for the sorghum flour and the highest for orange peel flour. Therefore, the orange peel flour requires a minimum temperature to bake compared to the other due to its pasting temperature. Increasing the blend proportion of the orange peel flour could minimize the temperature required to bake the biscuits. The breakdown of the blend flours was lower than the individual flours and was decreased with increasing the blend proportion; therefore, the lower breakdown can be an indication of the higher ability of the blend flours to withstand heating during baking. The lowest breakdown also indicates the paste stability (Kaur & Singh, Citation2005) hence a desirable property. Incorporation of the orange peel and the grass pea flours into sorghum flours was determined to have a positive effect on some of the flour pasting properties as discussed above. The lower setback also depicts the flour's lower tendency to retrograde. The gradual increase in flour viscosity depicted may be caused by the granules’ loss of water from the amylose that has been released (Ding et al., Citation2021).
Figure 3. FTIR spectrum of the individual flours.
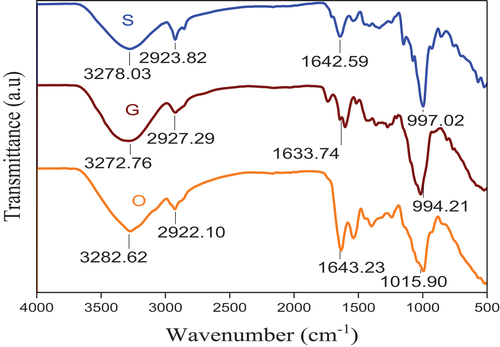
4.7. Fourier Transform-Infra Red (FTIR) spectrum of the blend flour and the individual flours
There was a significant difference in peak values of each flour sample, and there were also strong C = C bending vibrations in grass pea flour, while it does not show medium C = N and C = C stretching vibrations compared to the others, as shown in Figure . The last peak of the orange peel flour also showed that there was a difference in the functional group of each of the individual flours.
Figure 4. FTIR spectrum of the blend flours.
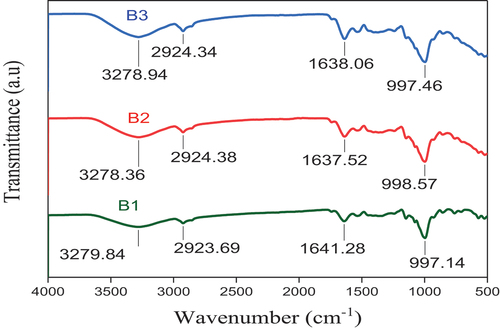
From the FTIR spectrum of blend flours, the first peak at each of the blend flours (3278.94, 3278.36, 3279.84 cm−1) revealed that there were O—H stretching and C—H stretching vibrations which indicates the presence of hydroxyl groups for all of the blend flours, and hydrophilic tendency. The second peaks of all the blend flours showed that there was O—H stretching, N—H stretching, and C—H stretching, while the third peak of each blend flours showed C = N stretching, C = C stretching, N—H bending in each of the blend flours, hence the same compound class was found in all of the blend flours even though there was insignificant difference in the peak values of the blend flour samples in which there was no C = C stretching vibration in B2 flour, as illustrated in Figure .
4.8. Rheological properties of the dough
All of the flours had a higher viscosity (solid-like) behavior in the initial stages of the applied stress, which decreased over time as the applied stress increased, according to the rheological graph of the results. As the stress increases, the structure collapses and the product’s viscosity gradually begins to decrease, as shown in table . The gluten does not become fully hydrated, and the elastic characteristic of the dough does not fully emerge if there is not enough water to meet the hydration needs of every ingredient in the dough. In contrast, too much free water in the dough causes the viscous component to predominate, with a decrease in extension resistance, an increase in extensibility, and the creation of sticky dough (Spies, Citation1990). According to the various flours’ rheological graphs, the orange peel flour had a greater reported viscosity that gradually reduced. Orange peel’s strong capacity to absorb water may be the cause of its higher observed viscosity. Since similar amounts of water were used to prepare the dough, the dough made from orange peel flour was thicker than the dough made from sorghum and grass pea flour due to its high water absorption capacity. With its viscosity, the orange peel flour’s structure was more developed than the others. As a result, even when compared to the dough made from a blend of flour, the dough made from orange peel flour yields under substantially higher stress than the others. When specific molecules are stretched under shear, the structure of the dough breaks down, which is how the viscosity decreases. Entanglements that loosen may cause this disintegration (MacRitchie, Citation1986). The position of the maximum viscosity can then be used to determine the strength of the dough. The maximum viscosity is obtained at higher strains for the stronger dough.
The maximum viscosity and the corresponding strain can both affect the dough’s quality (Lindborg et al., Citation1997). The orange peel dough had a slightly higher viscosity and reached its maximum viscosity at the lowest shear rate (strain), whereas the grass pea dough was the weakest dough, and had the lowest viscosity. Therefore, use of these flours has an importance in adjustment of the dough quality since B1, and B2 showed a higher viscosity with the same shear rate compared to sorghum flour. There was an insignificant decrease in shear rate of B3 flour compared to the others. The resistance of dough to deformation rises with the addition of fiber. This is most likely brought on by interactions between the proteins and the fiber structure (Mirsaeedghazi et al., Citation2008). When comparing the blend flours B1 and B2 were desirable due to their slightly higher shear rate at maximum viscosity although they had lower viscosity compared to B3 but higher compared to the individual flours, as shown in table .
Table 9. Shear stress and torque of the dough at minimum viscosity at a time, and shear rate of 400s and 100 (1/s) respectively
Table 8. Shear stress and shear rate of the dough at maximum viscosity at a time of 20s
5. Conclusion
Incorporation of grass pea and orange peel flour into the sorghum flour improves the quality of the blend flours. Sorghum and grass pea blends are important for nutrition enhancement where they are staple and highly available grains. Orange peel increases the antioxidant capacity and mineral content of the blend flours while grass pea increases the protein content significantly. The blend flours can be used to produce a better food product since the flours were determined to have acceptable physicochemical properties. It is recommended to conduct the β-ODAP content of the flour samples.
Author contribution
Elias Ture Mohammed: Conducted the experiments and data analysis and wrote the paper.
Acknowledgments
I would like to express my deepest gratitude to department of food engineering, Dilla university.
Disclosure statement
No potential conflict of interest was reported by the author(s).
Data availability statement
The data that support the findings of this study are available from the corresponding author upon reasonable request.
References
- Adeleke, R. O., & Odedeji, J. O. (2010). Functional properties of wheat and sweet potato flour blends. Pakistan Journal of Nutrition, 9(6), 535–19. https://doi.org/10.3923/pjn.2010.535.538
- AOAC. (2005). Official methods of analysis. AOAC International Gaitherburg.
- Bala, M., Handa, S., Mridula, D., & Singh, R. K. (2020). Physicochemical, functional and rheological properties of grass pea (Lathyrus sativus L.) flour as influenced by particle size. Heliyon, 6(11), e05471. https://doi.org/10.1016/j.heliyon.2020.e05471
- Benzie, I. F. F., & Strain, J. J. (1996). The ferric reducing ability of plasma (FRAP) as a measure of “antioxidant power”: The FRAP assay. Analytical Biochemistry, 239(1), 70–76. https://doi.org/10.1006/abio.1996.0292
- Bredariol, P., Carvalho, R. A. D., & Vanin, F. M. (2020). The effect of baking conditions on protein digestibility, mineral and oxalate content of wheat breads. Food Chemistry, 332, 127399. https://doi.org/10.1016/j.foodchem.2020.127399
- Buckman, E. S., Oduro, I., Plahar, W. A., & Tortoe, C. (2018). Determination of the chemical and functional properties of yam bean (pachyrhizus erosus (L.) urban) flour for food systems. Food Science & Nutrition, 6(2), 457–463. https://doi.org/10.1002/fsn3.574
- Buta, M. B., Emire, S. A., Posten, C., Andrée, S., & Greiner, R. (2019). Reduction of β-ODAP and IP 6 contents in Lathyrus sativus L. seed by high hydrostatic pressure. Food Research International, 120(November 2020), 73–82. https://doi.org/10.1016/j.foodres.2019.02.011
- Calliope, S., Wagner, J., & Samman, N. (2020). Physicochemical and functional characterization of potato starch (Solanum Tuberosum ssp. Andigenum) from the Quebrada De Humahuaca, Argentina. Starch - Stärke, 72(1–2), 1900069. https://doi.org/10.1002/star.201900069
- Chew, K. K., Khoo, M. Z., Ng, S. Y., Thoo, Y. Y., Aida, W. W. M., & Ho, C. W. (2011). Effect of ethanol concentration, extraction time and extraction temperature on the recovery of phenolic compounds and antioxidant capacity of orthosiphon stamineus extracts. International Food Research Journal, 18(4), 1427.
- Chung, H.-J., Cho, A., & Lim, S.-T. (2014). Utilization of germinated and heat-moisture treated brown rices in sugar-snap cookies. LWT-Food Science and Technology, 57(1), 260–266. https://doi.org/10.1016/j.lwt.2014.01.018
- Das, P. C., Khan, M. J., Rahman, M. S., Majumder, S., & Islam, M. N. (2019). Comparison of the physico-chemical and functional properties of mango kernel flour with wheat flour and development of mango kernel flour based composite cakes. NFS Journal, 17, 1–7. https://doi.org/10.1016/j.nfs.2019.10.001
- Ding, Y., Cheng, J., Lin, Q., Wang, Q., Wang, J., & Yu, G. (2021). Effects of endogenous proteins and lipids on structural, thermal, rheological, and pasting properties and digestibility of adlay seed (coix lacryma-jobi L.) starch. Food Hydrocolloids, 111, 106254. https://doi.org/10.1016/j.foodhyd.2020.106254
- Djilas, S., Čanadanović-Brunet, J., & Ćetković, G. (2009). By-products of fruits processing as a source of phytochemicals. Chemical Industry & Chemical Engineering Quarterly, 15(4), 191–202. https://doi.org/10.2298/CICEQ0904191D
- Drago, R. S. (1973). Pearson’s quantitative statement of HSAB [hard-soft acid-base]. Inorganic Chemistry, 12(9), 2211–2212. https://doi.org/10.1021/ic50127a063
- Dykes, L. (2019). Tannin analysis in sorghum grains. Methods in Molecular Biology, 1931(Table 1), 109–120. https://doi.org/10.1007/978-1-4939-9039-9_8
- Getahun, H., Lambein, F., Vanhoorne, M., & Van Der Stuyft, P. (2005). Neurolathyrism risk depends on type of grass pea preparation and on mixing with cereals and antioxidants. Tropical Medicine and International Health, 10(2), 169–178. https://doi.org/10.1111/j.1365-3156.2004.01370.x
- Hadebe, S. T., Modi, A. T., & Mabhaudhi, T. (2017). Drought tolerance and water use of cereal crops: A focus on sorghum as a food security crop in sub‐Saharan Africa. Journal of Agronomy and Crop Science, 203(3), 177–191. https://doi.org/10.1111/jac.12191
- Hanbury, C. D., White, C. L., Mullan, B. P., & Siddique, K. H. M. (2000). A review of the potential of Lathyrus sativus L. and L. cicera L. grain for use as animal feed. Animal Feed Science and Technology, 87(1–2), 1–27. https://doi.org/10.1016/S0377-8401(00)00186-3
- Heywood, A. A., Myers, D. J., Bailey, T. B., & Johnson, L. A. (2002). Functional properties of low-fat soy flour produced by an extrusion-expelling system. Journal of the American Oil Chemists’ Society, 79(12), 1249–1253. https://doi.org/10.1007/s11746-002-0635-y
- Hoover, R., & Ratnayake, W. S. (2001). Determination of total amylose content of starch. Current Protocols in Food Analytical Chemistry, 1(1), E2–3. https://doi.org/10.1002/0471142913.fae0203s00
- Houssou, P., & Ayernor, G. S. (2002). Appropriate processing and food functional properties of maize flour. African Journal of Science and Technology, 3(1). https://doi.org/10.4314/ajst.v3i1.15297
- Kasprzak, M., & Rzedzicki, Z. (2012). Application of grasspea wholemeal in the Technology of white bread production. Polish Journal of Food and Nutrition Sciences, 62(4), 207–213. https://doi.org/10.2478/v10222-012-0056-6
- Kaur, M., & Singh, N. (2005). Studies on functional, thermal and pasting properties of flours from different chickpea (Cicer arietinum L.) cultivars. Food Chemistry, 91(3), 403–411. https://doi.org/10.1016/j.foodchem.2004.06.015
- Khalil, A. F., Kwon, H., Lall, U., Miranda, M. J., & Skees, J. (2007). El Niño–southern oscillation–based Index insurance for floods: Statistical risk analyses and application to Peru. Water Resources Research, 43(10). https://doi.org/10.1029/2006WR005281
- Kuntz, I. D., Jr. (1971). Hydration of macromolecules. III. Hydration of polypeptides. Journal of the American Chemical Society, 93(2), 514–516. https://doi.org/10.1021/ja00731a036
- Lalude, L. O., & Fashakin, J. B. (2006). Development and nutritional assessment of a weaning food from sorghum and oil-seeds. Pakistan Journal of Nutrition, 5(3), 257–260. https://doi.org/10.3923/pjn.2006.257.260
- Lambein, F., Ngudi, D. D., & Kuo, Y.-H. (2001). Vapniarca revisited: Lessons from an inhuman human experience. Lathyrus Lathyrism Newsletter, 2, 5–7. https://www.researchgate.net/publication/242166469_Vapniarca_revisited_Lessons_from_an_inhuman_human_experience
- Lindborg, K. M., Trägårdh, C., Eliasson, A. C., & Dejmek, P. (1997). Time-resolved shear viscosity of wheat flour doughs - effect of mixing, shear rate, and resting on the viscosity of doughs of different flours. Cereal Chemistry, 74(1), 49–55. https://doi.org/10.1094/CCHEM.1997.74.1.49
- MacRitchie, F. (1986). Spread monolayers of proteins. Advances in Colloid and Interface Science, 25, 341–385. https://doi.org/10.1016/0001-8686(86)80013-6
- Mirsaeedghazi, H., Emam-Djomeh, Z., & Mousavi, S. M. A. (2008). Rheometric measurement of dough rheological characteristics and factors affecting it. International Journal of Agriculture and Biology, 10(1), 112–119.
- Muttakin, S., Kim, M. S., & Lee, D.-U. (2015). Tailoring physicochemical and sensorial properties of defatted soybean flour using jet-milling technology. Food Chemistry, 187, 106–111. https://doi.org/10.1016/j.foodchem.2015.04.104
- Odedeji, J. O., & Adeleke, R. O. (2010). Pasting characteristics of wheat and sweet potato flour blends. Pakistan Journal of Nutrition, 9(6), 555–557. https://doi.org/10.3923/pjn.2010.555.557
- Osborne, D. R., & Voogt, P. I. (1978). The analysis of nutrients in foods. Academic Press Inc.(London) Ltd.
- Ötles, S., & Ozgoz, S. (2014). Health effects of dietary fiber. Acta Scientiarum Polonorum, Technologia Alimentaria, 13(2), 191–202. https://doi.org/10.17306/J.AFS.2014.2.8
- Pérez, A. A., Drago, S. R., Carrara, C. R., De Greef, D. M., Torres, R. L., & González, R. J. (2008). Extrusion cooking of a maize/soybean mixture: Factors affecting expanded product characteristics and flour dispersion viscosity. Journal of Food Engineering, 87(3), 333–340. https://doi.org/10.1016/j.jfoodeng.2007.12.008
- Požrl, T., Kopjar, M., Kurent, I., Hribar, J., Janeš, A., & Simčič, M. (2009). Phytate degradation during breadmaking: The influence of flour type and breadmaking procedures. Czech Journal of Food Sciences, 27(1), 29–38. https://doi.org/10.17221/130/2008-cjfs
- Qian, J. Y., & Kuhn, M. (1999). Evaluation on gelatinization of buckwheat starch: A comparative study of Brabender viscoamylography, rapid visco-analysis, and differential scanning calorimetry. European Food Research and Technology, 209(3), 277–280. https://doi.org/10.1007/s002170050493
- Ragaee, S., Guzar, I., Dhull, N., & Seetharaman, K. (2011). Effects of fiber addition on antioxidant capacity and nutritional quality of wheat bread. LWT - Food Science and Technology, 44(10), 2147–2153. https://doi.org/10.1016/j.lwt.2011.06.016
- Rani, V., Sangwan, V., Rani, V., & Malik, P. (2020). Orange peel Powder: A Potent source of fiber and Antioxidants for functional biscuits. International Journal of Current Microbiology and Applied Sciences, 9(9), 1319–1325. https://doi.org/10.20546/ijcmas.2020.909.167
- Roger Konan, B., Henri Marius Biego, G., Rebecca Rachel, A. A., Brou Roger, K., Ysidor, G., & Godi Henri, B. (2013). Assessment of Physicochemical and mineral characters of the orange (Citrus Sinensis) peels. Journal of Asian Scientific Research Journal Homepage: Journal of Asian Scientific Research, 3(3), 1181–1190. http://aessweb.com/journal-detail.php?id=5003
- Singh Sibian, M., & Singh Riar, C. (2021). Optimization and evaluation of composite flour cookies prepared from germinated triticale, kidney bean, and chickpea. Journal of Food Processing and Preservation, 45(1), 1–11. https://doi.org/10.1111/jfpp.14996
- Sokmen, A., Gulluce, M., Akpulat, H. A., Daferera, D., Tepe, B., Polissiou, M., Sokmen, M., & Sahin, F. (2004). The in vitro antimicrobial and antioxidant activities of the essential oils and methanol extracts of endemic thymus spathulifolius. Food Control, 15(8), 627–634. https://doi.org/10.1016/j.foodcont.2003.10.005
- Spies, R. (1990). Application of rheology in the bread industry. In Spies, R. (Ed.), Dough rheology and baked product texture (pp. 343–361). Springer.
- Taira, H. (1974). Buckwheat introduction, encyclopedia of food technology. Westport: AVI, 139.
- Tasie, M. M., & Gebreyes, B. G. (2020). Characterization of nutritional, Antinutritional, and mineral contents of thirty-five sorghum varieties grown in Ethiopia. International Journal of Food Science, 2020, 1–11. https://doi.org/10.1155/2020/8243617
- Traynham, T. L., Myers, D. J., Carriquiry, A. L., & Johnson, L. A. (2007). Evaluation of water-holding capacity for wheat–soy flour blends. Journal of the American Oil Chemists’ Society, 84(2), 151–155. https://doi.org/10.1007/s11746-006-1018-0
- Vaintraub, I. A., & Lapteva, N. A. (1988). Colorimetric determination of phytate in unpurified extracts of seeds and the products of their processing. Analytical Biochemistry, 175(1), 227–230. https://doi.org/10.1016/0003-2697(88)90382-X
- Walle, H., & Moges, D. (2017). Optimization of cereal-legume blend ratio to enhance the nutritional quality and functional property of complementary food 110 Helen Walle and Demewez Moges. Ethiopian Journal of Science and Technology, 10(2), 109. 10(2. https://doi.org/10.4314/ejst.v10i2.3
- Yigzaw, Y., Gorton, L., Akalu, G., & Soloman, T. (2001). Fermentation of teff (Eragrostis tef), their mixtures: Aspects of nutrition and food safety. Lathyrus Lathyrism Newsletter, 2, 8–10.