
Abstract
This article designed a service model in logistics services for document and package delivery through the exploration of service element relationships and customer perceived (i.e. Kansei). Kansei engineering is used in this article to design 24 questionnaire instruments and 41 services attribute questionnaire instruments. The questionnaire was distributed by purposive sampling with a total of 100 respondents in logistics services: package delivery services, package tracking services, and package delivery services. In this study, Partial Least Square for Structural Equation Modelling (PLS-SEM) is used to analyze the relationship between Kansei and the logistics service elements. The results indicate that Kansei’s words affect significantly on the three logistics services. The results of this study indicate that the variables obtained from Kansei words have a significant effect on 16 elements of logistics services. The innovative Kansei word has the most influence in the delivery service, the reliable Kansei word has the most influence in the tracking service, the reliable and adjustable Kansei word has the most impact in the delivery service. This study also produces the best service attributes at each service stage to improve the quality of logistics services. This finding has important implications for logistics managers in designing services that take into account elements of customer-based voice services.
PUBLIC INTEREST STATEMENT
Capturing the voice of consumers towards the attribute quality of logistics services has become an interesting issue to be discussed lately. Servqual attributes that have so far been unable to provide the value of customization expected by consumers for the quality of logistics services they expect. This article shows that Kansei engineering offers a different approach in capturing consumer voice based on ergonomic-based logistics service quality and its relationship with customer trust and loyalty.
1. Introduction
Logistics has become the most developed segment offering space for innovation and continuous process improvement in companies, communities, and supply chain management (Jurik, Citation2016). Logistics service providers handle processes such as inventory, shipping, packaging, and security for shipping. According to Saura et al. (Citation2008), currently, logistics focuses on the ability to provide quality services and produce greater satisfaction with the services offered. The logistics quality provided by logistics services has the main objective to satisfy customers so that their competitive advantage over other competitors is even greater (Thai, Citation2013). Enhancing the capabilities of a company’s logistics services is an effective way to build a close relationship between the company and its customers (Mentzer & Kahn, Citation1995). Also, to improve customer satisfaction as expressed by (Boaden, Citation1997), who considers that each company should offer a value-added service, then improving the quality of logistics services that are sustainable must be a major concern for logistics services for logistics service providers. They should become more proactive with customer satisfaction by providing better logistics services (Stank et al., Citation1999).
Boyer, Boyer et al., (Citation2003b) and Cairns (Citation1996) investigated logistics services for home delivery services (HDS) for food distribution and found that HDS played an essential role in improving logistics service performance. One of the new types of logistics services, for example, home delivery service, is becoming a service that is in high demand by consumers. Furthermore, as suggested by Småros et al. (Citation2000), providing convenient and fast logistics services for customers will have a significant impact on increasing the financial performance of logistics service providers. Meanwhile, Lin & Chen, (Citation2011) in their research concluded that providing home delivery services in one of the logistics service activities has played an important role in increasing the convenience of online transactions and the physical distribution of goods. That would improve the service performance of logistics service providers. Furthermore, superior delivery processes to customers can create competitiveness in the market due to the increasing number of customers who require fast, reliable, and cost-effective logistics processes and services (Persson & Virum, Citation2001).
Although providing a superior service quality can produce many benefits for service providers, such as time savings, cost reduction, increased market share, and profits (Thompson et al., Citation1985), but delivering an excellent service quality consistently is difficult. Particularly, when the service or product quality are based on the customers’ perspectives, translating the needs, the impression, and the experience of customers who use the products or service is the critical point to get the quality feedback from customers for the service improvement. In logistics services, some studies has been conducted related to the way of gathering information of the services based on the customer’s perception, such as Fuzzy QFD (Quality Function Deployment) (Bottani & Rizzi, Citation2006), Servqual (Roslan et al., Citation2015), Kano model (Baki et al., Citation2009), Kansei engineering (Chen et al., Citation2015). The latest article discussed the framework of the relationship between service elements, Kansei words, and usage intention based on customer Kansei perceptions for international logistics services. Slightly different with the article made by Chen et al. (Citation2015), this article explores the dominant factors from customer Kansei perception of the three models of logistics services: shipping, tracking, and delivery (STD) services and investigate the relationship between service elements of the three logistics services, Kansei words, and customer satisfaction. In the Indonesian context, studies using Kansei engineering were done in other service areas such as restaurant (Hartono, Citation2016), hotel services (Hartono et al., Citation2013) and public transport services (Hapsari et al., Citation2017), however there is no investigation of Kansei engineering for Indonesian logistics services. Thus, this article discusses how Kansei engineering identifies Indonesian customers’ perception on logistics service quality. This study also discusses the managerial implication for improvement that can be done by the logistics service providers.
2. Literature review
2.1. Kansei engineering in logistics service quality
Kansei Engineering is defined as “A translator system for translating images or feelings into real design components” (Nagamachi, Citation1995) that can translate customer impressions, feelings, and products and concepts into product and service design. Kansei Engineering is considered as a superior approach compared to other similar methods related to capturing the needs and voices of consumers. This method could translate the customer’s emotional needs into product attribute parameters through engineering (Schütte et al., Citation2004). Also, Kansei Engineering can modify and optimize product properties that are not directly visible (Dahlgaard et al., Citation2008). In the service businesses, logistics is the most developed segment and offers space for continuous innovation and process improvement in companies, communities, and supply chain management (Jurik, Citation2016). At present, logistics focuses on the ability to provide quality services and generate greater satisfaction with the services offered. Logistics quality is the basis of logistics companies, and the level of logistics services provided by these companies can determine customer satisfaction, thereby determining their competitive advantage over other competitors (Thai, Citation2013). Logistics service provider companies should offer value-added services, so improving the quality of logistics services should be the primary focus for logistics service providers and be more proactive with customer satisfaction by providing better logistics services (Stank et al., Citation1999).
As an ergonomics-based product development technology, Kansei engineering brings together customer preferences and emotions. The use of Kansei engineering in exploring information related to customer perceptions of logistics services is an interesting discussion conducted by researchers and practitioners. Several previous studies have shown that Kansei engineering can be applied to logistics services like home delivery, tracking, and shipping services aspects. Chen et al. (Citation2015) gave an example of the application of Kansei engineering to the home delivery service, which explained that compared to other methods, Kansei engineering could better express users feel better. In another study, Chen et al. (Citation2015) used Kansei engineering to identify the relationships between international express service (IES) service elements, Kansei customer perceptions, and customer use intentions to provide new ideas for IES design.
The complexity of the logistics service quality based on the customer’s voice has encouraged researchers to use Kansei engineering together with other customer-based approaches such as Kano, text-mining-based, and quality function deployment (QFD). For example, Hsiao et al. (Citation2017) designed a cross-border e-commerce using Kansei dan text-mining-based for online content analysis. They found that the emotional perceptions of customers’ needs can be figured out by Kansei engineering with text-mining-based. In their article, the application of the content-mining approach is used to identify service elements and Kansei words for online cross-border logistics services. The findings of their study show that in addition to using conventional customer surveys that are commonly used; the text approach can be an alternative way that can be used to capture the voice of customers together with Kansei engineering effectively. Moreover, Hartono et al. (Citation2017) modeled a logistics service quality using Kansei engineering, Kano, and QFD. The combination has the aim to generate more innovative and accurate ideas to capture customer’s perceptions of the logistics service quality. Another study by Hartono (Citation2016) identified the attributes of services and customer satisfaction using Kansei engineering and the theory of incentive problem solving (TRIZ).
2.2. Customers’ perceptions of logistics service
Several studies (Chen et al., Citation2015; Naomi, Citation2015) discuss the importance of using Kansei engineering on capturing customers’ perception of logistics service attributes on the elements of logistics services. According to Naomi (Citation2015), the decisions on buying the product or using the services is based on the customers’ perception. The perception of ease to operate a site system, transaction until purchased-goods delivered. These ordering procedures refer to the efficiency and effectiveness of processes provided by logistic service providers (Bienstock et al., Citation1997). In terms of delivery time, a study by Davis and Mentzer (Citation2006) stated that customer loyalty is highly dependent on aspects related to the quality of logistics services such as reliability, communication, timeliness, and responsiveness. Timelines refer to the estimated delivery time, which refers to the time taken between placing an order and receiving it by the customer. In the research findings done by Chen et al. (Citation2015) show that the delivery factors captured by Kansei words from customer perceptions indicate that most customer’s feeling on delivery factors are like high quality, reliable, familiar, specialized, on time and convenient.
Other important factors affecting logistics service quality is picking-up services and packaging services. Kansei engineering was used to capture customer’s perceptions of logistics services and found that pick-up services are one of the services attributes that most considered by customers (Chen et al., Citation2015), while a study by Hsiao et al. (Citation2017) and Chen et al. (Citation2015) found that packaging services greatly affects customer perceptions in assessing provider logistics services. Moreover, other factors affecting logistics service quality has been discussed widely such as costs (Avlonitis & Indounas, Citation2005), warranty services (Parasuraman, Citation2000), (Ribbink & Grimm, Citation2014) and (Wang et al., Citation2003), tracking service (Saura et al., Citation2008), and (Lewis & Soureli, Citation2006), shipping area service (Bansal et al., Citation2004), home delivery service (Boyer et al., Citation2003a), availability of delivery information (Chen et al., Citation2015) and claim handling (Firnstahl, Citation1989) and (Spreng et al., Citation1995).
The relationship between logistics service quality logistics performance has been studied previously. Most of them investigated the attributes of logistics service quality (servqual) and their relationship to logistics performance. Gefen (Citation2002) and Rezi, Chandra, Budiman, Putra, & Rizki (Rezi et al.) investigated the relationship between service quality and logistics performance through customer loyalty and found that there is a positive relationship between service quality and customer loyalty. The effects between service quality and organization performance which is customer trust and loyalty for hospital service were investigated by (Melinda et al., Citation2019). The study found that there is a significant effect between them. The attributes of service quality on those studies are taken from 5 dimension developed by Parasuraman et al. (Citation1991) and Parasuraman et al. (Citation1994). The discussions of logistics service quality and their relationship on customer trust and loyalty are recently growing in term of the approach of capturing service attributes. The ergonomic-based attributes of service quality are proposed to generate the customers’ perception on the services of different areas. The ergonomic-based as Kansei engineering that capturing attributes based on customers’ perception is believed to be more customization-based. Therefore, different areas of the case studies and different locations of the research would have different perspective of customer service perceptions. Thus, this study uses Kansei engineering to capture the logistics service attributes from customer’s perception to posit two hypotheses:
H1: Servqual has a significant effect on Trust
H2: Trust has a significant effect on the loyalty
3. Methodology
This study uses an online survey with a total of 100 respondents. The respondents chosen in this study are customers who have used logistics services for shipping, tracking and delivery services. The criteria for sample respondents to be used are respondents who have used each service from a logistics provider, especially in package delivery services, package tracking services, and package delivery services at least once. Before conducting a formal survey, this study conducted a pilot test with a sample of 30 respondents. The aim is to ensure that everyone in the sample understands the question. In this way also can see whether there are questions that make respondents feel uncomfortable. The survey was done online targeting respondents who have used the services of logistics providers. The databases of respondents are selected based their experience using logistics services such as individual customers, institutions, the government and non government representatives. Then test the validity and reliability of the results of the questionnaire that has been distributed to customers. The sampling technique is done by purposive sampling to get a representative sample with special consideration following specified criteria. There are two types of questionnaire instruments, namely instruments related to Kansei and instruments related to attributes. Kansei instruments are used to evaluate services from logistics providers, and service attribute instruments are used to analyze the importance of each service attribute offered.
3.1. Identifying Kansei words
Ishihara explains suitable sources can be magazines, related literature, manuals, experts, experienced users, related Kansei studies. The first phase in identifying Kansei words is collecting Kansei words from several sources, namely from advertisements, tv, internet videos, or in previous studies. Next, sort out the word Kansei by eliminating words that have the same meaning. Then in the second phase is discussing the Kansei word to logistical experts. In this study, Kansei word from Chen’s research (Chen et al., Citation2015), which focuses on 3 phases of service, is used, namely package delivery services (customers send packages), packet tracking services (customers track packages), and package delivery services (couriers delivering packages to customers). Then in the second phase of this study discussing Kansei word with service managers in logistics service providers. The logistics service providers selected in this study are the largest service providers with the most significant number of branches and distribution networks in Indonesia.
3.2. Identifiying Service Atribute
Following the identification of attributes based on Chen’s research (Chen et al., Citation2015), at this stage, the identification of service elements and service attributes in logistics service providers is made through interviews with service managers. Service attributes are collected on each service element in 3 service stages. The attributes collected are considered important and are often used by customers as a reference for their satisfaction. As suggested by Ishihara et al. (Citation2008), regarding the creation of property spaces in Kansei engineering, researchers develop new service proposals based on existing services and then set up a set of service attributes that will also be used as questionnaire items. The conceptual model developed in this study aims to investigate the relationship between Kansei and service elements. In addition, the conceptual model is also used to investigate the service attributes and Kansei word, which have the most dominant influence on service. This study has three conceptual models related to three stages of shipping services, namely, package delivery services, package tracking services, and package delivery services. The variables of Kansei words and attributes were modified from the studies of Chen et al. (Citation2015) and adjusted from to the customers and logistics providers representative’s voices. This research uses 24 Kansei words, 16 service elements, and 41 service attributes. Identification of attributes at three service stages can be seen in Tables –.
Table 1. Service elements and shipping service attributes
Table 2. Service elements and tracking service attributes
Table 3. Service elements and delivery service attributes
Table 4. Synthesis concept
Table 5. Synthesis results
3.3. Synthesis of Kansei word with service attributes
The synthesis phase was carried out using Kansei engineering Type I (see Figure ), which identified Kansei (emotional needs) and explored the product/service design elements associated with the Kansei.
Figure 1. KE Type I
The results of KE Type I, in this case, are more positioned as a medium to show the relationship between Kansei word variables and specific service attributes. The influential service attributes associated with Kansei words are shown in Table .
The following synthesis results in this study is shown in Table :
3.4. Determination of conceptual models
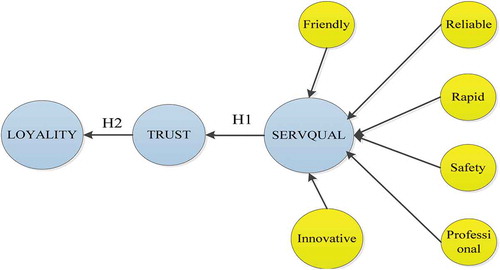
The conceptual model developed in this study has several objectives (see Figure ). First, this study wants to find out the relationship between Servqual and trust. Second, wants to investigate the relationship between trust and loyalty. Third, we want to find out how significant the relationship is, so from that; we can then find out which attribute has the most dominant value or can be said to be the most representative service attribute in each word. This research will use 6 Kansei words, and 40 service attributes, three trust indicators, and three loyalty indicators.
Figure 2. Conceptual model
4. Results and discussion
This study uses SmartPLS 2.0 to examine the relationship between service elements and customer feelings (Kansei), validity and reliability testing and using SPSS 12.0 to produce descriptive statistics.
4.1. Profile of respondents and descriptive statistics
The results of the questionnaire were obtained from the distribution of formal questionnaires to 100 respondents. Respondents were taken based on the criteria of having used each service, namely package delivery services, package tracking services, and package delivery services. The profile of the respondents is summarized in Table .
Table 6. Respondent’s profile
Respondents’ perceptions are divided into 3, namely respondents’ perceptions of Kansei, respondents’ opinions regarding trust in logistics services, and perceptions related to customer loyalty. Respondents’ perception of Kansei was analyzed to determine the level of customer interest in the proposed service attributes. The perception of trust is used to determine the level of customer confidence in the logistics providers in providing services, while the perception of loyalty is used to determine the level of customer loyalty to the logistics service providers. Detailed descriptive statistical results for each indicator are shown in Table –.
Table 7. Descriptive statistics of the importance of service attributes
Table 8. Descriptive statistics of the level of trust
Table 9. Descriptive statistics of loyalty levels
The descriptive statistics table of service attributes informs that the response of the respondent to the average item is worth agreeing (3.41–4.2). But there are some service attribute items that have a value of strongly agree (≥ 4.21), namely items JP1 (guaranteed package protection), CL1 (tracking system by application), CL2 (trackng system by website), IT1 (information the estimated goods arrived), TM1 (pick-up and drop-off live tracking), and KO1 (compensation of damaged package).
The level of trust informs the response of the respondent to the average item worth agreeing (3.41–4.2). It means that the respondent agrees that the logistics service providers could provide services according to their needs and expectations.
Descriptive statistics of the loyalty level shows respondents’ responses to the average item worth agreeing (3.41–4.2). It means that the respondent agreed to the logistics providers’ services again.
4.2. Model evaluation
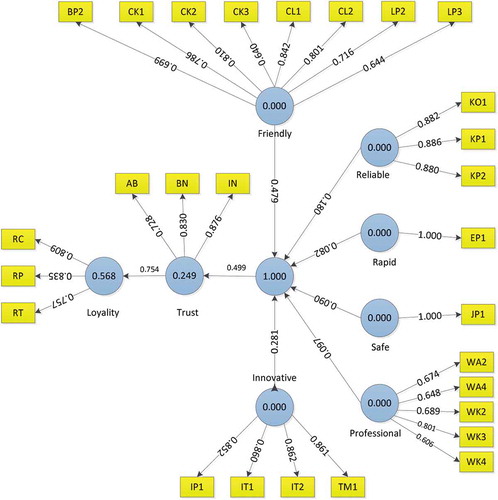
By using smartPLS, in the path diagram, variables and indicators are distinguished, where the variable uses the blue circle, and the indicator variable uses the yellow rectangle. Indicator variables are items that are measured using survey instruments and imported into Spreadsheet (in file.csv) before being processed using smartPLS. Each indicator is coded (with their name) to facilitate identification.
Figure 3. Path diagram output
At this stage, the validity and reliability tests are conducted on the 1st and 2nd orders. The validity test aims to determine the validity of indicators in measuring variables. While the reliability test is used to determine the reliability of the survey instrument. In the 2nd order validity test, it can be known through the bootstrapping procedure and the outer loading assessment ≥ 0.60 to test the correlation of indicators with their constructs. While evaluating the measurement model for the 1st order (the relationship between latent variables and indicators), namely, the trust variable and the loyalty variable has been done. Similar to the 2nd order, testing the validity of the criteria used through the loading factor, but in addition to seeing the value of the loading factor, another criteria used as a reference is Average Variance Extracted (AVE). AVE is “the grand mean value of the squared loading of the indicators associated with the construct” (Hair et al., Citation2016). It can be said that the AVE value has a similar meaning to the loading factor value, where the construct must be equal to or greater than 0.5, meaning that the construct can be explained by 50% or more of the indicators in a variant. Also, an average variant taken less than 0.5 indicates the occurrence of errors detected in the variant explained in the construct. Whereas in the reliability test, both 1st and 2nd order, the assessment criteria used were 0.70 composite reliability (Ghozali, Citation2006). The results of the validity and reliability tests are summarized in Table .
Table 10. Final outer loading test 2nd order
Based on the evaluation results of the 2nd order measurement model (dimensional relationship with variables) servqual variables listed in the above table, it is known that the highest loading factor value is the friendly dimension with a value of 0.479. In addition, it is also known that the indicators that measure each dimension have a value greater than 0.6. Thus all indicators are declared valid in measuring variables or can be said to be able to represent Servqual. Then for the reliability test, it is known that in the Cronbach alpha column, all indicators are greater than 0.6, and in the composite reliability column, all constructs are greater than 0.7. Thus, based on the reliability test assessment criteria, all indicators measuring Servqual variables are declared reliable.
In Table , it shows that the indicators that measure each variable have a value greater than 0.6. Thus all indicators are declared valid in measuring the variables in each service. Furthermore, in the AVE column it can be seen that the variables in each service produce an Average Variance Extracted value greater than 0.5. Thus the construct is declared valid, or an indicator can be said to explain the construct. Then in the composite reliability column, all constructs are greater than 0.7. Thus, based on the calculation of composite reliability, all indicators that measure Kansei variables are declared reliable.
Table 11. Final outer loading test 1st order
After all items have been declared valid and reliable, the next step is evaluating the final structural model. This study uses the coefficient of determination analysis (R square) (Hair et al., Citation2016). The coefficient of determination or the value of R2 is generally used to evaluate structural models. The coefficient of determination is calculated through the PLS-algorithm procedure that helps explain the effect of exogenous variables on endogenous variables. The value of R square is shown in Table .
Table 12. R square
From the structural model evaluation test results, the R square test value on the loyalty variable produces a value of 0.568, which means that the loyalty variable contributes to 56.8% of the Servqual variable, and the remaining 43.2% is not explained in this study. While the trust variable contributed 24.9% to the Servqual variable, and the remaining 75.1% was not explained in the study.
Next, the model evaluation uses the path coefficient to identify the significance of the path coefficient between the variables in Figure . The results that show the path coefficient between the variables are shown in Table .
Table 13. Path coefficient
The results of the path coefficient analysis in Table show a strong relationship between variables. The relationship between service qualiy attributes obtained by Kansei engineering and customer trust as well as customer trust and loyalty has a strong relationship (with a path coefficient > 0.45) (Cohen, Citation1992). Other evaluation using Chi-square to test the relationship between latent variables of the model is shown in Table .
Table 14. Chi-square test results
Chi-square test results indicate the ergonomic-based perception of customers using Kansei engineering in the service quality variable have a significant relationship on the trust variable. A significant relationship is also found between the variable of customer trust and loyalty (with a value < 0.05) (Rana & Singhal, Citation2015).
4.3. Relationships between latent variables
The relationship between latent variables displayed in the construct model is represented by the path between constructs (Figure ). To determine whether the path coefficient is significant or not, the value of t must be evaluated through bootstrapping (Hair et al., Citation2016). The picture illustrates the relationship between Servqual and trust, and the relationship of trust and loyalty. The results and discussion of testing the direct influence hypothesis can be explained as follows:
H1: Servqual has a significant effect on Trust
Based on the results of the statistical value in Table , Servqual produces a T-statistics value of 9.049, where T-statistics > T table (1.96). This shows that service quality of logistics service providers (Servqual) has a positive and significant effect on customer’s trust, so the higher Servqual tends to increase customer’s trust. It was tested in the data obtained from data processing; there was a previous discussion. The statistical t-value for the H1 test reaches a significant level, proving that there is an influence between Servqual and trust. Supported by Chenet et al. (Citation2010) research, Servqual is a direct driver of trust. Service quality is recognized as a means by which companies can achieve major organizational results, including market share (Zahorik & Rust, Citation1993), financial performance improvement (Suri et al., Citation1993), and overall company performance (Easton & Jarrell, Citation1998). According to him, service quality has taken the role as an important source of profits in the business-to-business market regulation (Carlos Martín et al., Citation2008). Between the two researchers and practice managers, there is a long-standing recognition that high service levels are a necessary condition for strong business-to-business relationships (Crosby, Citation1990) and in particular, for trust to develop between relational partners (Moorman et al., Citation1992). When customers believe that the company is reliable, responsive, and empathetic, they tend to view the provider as a company that has a high level of integrity where trust tends to develop.
H2: Trust has a significant effect on the loyalty
Based on the results of the statistical value in Table , Servqual produces a T-statistics value of 20.450, where T statistics> T table (1.96). This shows that trust has a positive and significant effect on loyalty. So if the higher the trust tends to increase loyalty. Several researchers (Moorman et al., Citation1993, Citation1992) have suggested that trust is the basis in developing customer loyalty. The importance of trust in explaining loyalty is also supported by writers such as (Lim & Razzaque, Citation1997), (Chaudhuri & Holbrook, Citation2001) and (Sirdeshmukh et al., Citation2002). However, in markets with suitable alternatives, a lack of trust might lead to negative loyalty. Yoo et al., (Citation2009) have shown that the strong positive influence of trust on customer loyalty in the telecommunications sector.
4.4. Representative attribute analysis
Through PLS 2nd order evaluation, this study aims to determine the representative attributes obtained through the analysis of the loading factor value of each indicator in each dimension. The representative attribute is a service attribute that is considered most important by the customer. Analysis of the loading factor values can be seen in Table .
Table 15. The highest loading factor in each dimension and each service element
Table informs that the service dimension, which has the most dominant value to Servqual or can be said to be the most representative dimension to servqual is friendly. In this case, the company is friendly to be closer to customers, such as the ease of getting services such as location access and effective ordering procedures. This is relevant to Naomi (Citation2015) which explains that consumers have several factors considered in making purchasing decisions; one of these factors is convenience, both ease in terms of operating the site, how to transact until delivery of goods. According to Davis (Citation1989) understanding the perception of ease in the level where someone believes that using a particular system is free from effort. The most important thing for users is the amount of effort expended in using a system. Ordering procedures refer to the efficiency and effectiveness of the procedures followed by service providers (Bienstock et al., Citation1997). So consumers who want to buy products can choose access according to their needs, they are no longer required to go to the product seller’s place, and this is because it is very inefficient for consumers who have a hectic schedule.
The representative service attributes in each Kansei word dimension such as safe, friendly, rapid, innovative, reliable, and professional are shown in Table 16.
In addition, this study also provides findings of the most representative service attributes to servqual. This study recommends that companies apply service attributes that have the highest loading factor value on each service element. The goal is that service attributes can be a positive influence on the company. The service attributes that have the most dominant value for each dimension is summarized in Table .
Table 16. Representative service attributes for each Kansei word (dimensions)
Table 17. Representative service attributes for each service element
4.5. Managerial and theoretical implications
Managerial implications aim to develop managerial policies that are expected to be able to make a theoretical contribution to management practices. This study recommends that companies implement service attributes that have the highest loading factor values on each element of the delivery service obtained from data processing. The goal is that the service attributes can be a positive influence on the company. The proposed attributes that will be explained below are attributes that have not been implemented by the company. Researchers recommend the following service attributes for the company.
Recommendation of the CK2 attribute of “customers can send packages to the location of the service provider directly, or ask the courier to pick up the package by telephone or website”. The availability of several options of transactions of the pick-up service is vital for modern business. This is supported by Naomi (Citation2015), which explains that one of the factors considered in making purchasing decisions, namely ease of use of services, both ease in terms of operating the site, how to transact until delivery of goods. If consumers who want to buy a product are required to go to the product seller’s place, and it is very inefficient for consumers who have a hectic schedule. With the availability of several options for transactions, it will be easier for customers to adjust their needs.
The managerial policy should consider the LP2 attribute of the availability of free packaging for customers. This attribute has significant implications for service quality. According to Wisnalmawati et al. (Citation2014), service quality is the level of excellence expected by consumers to meet consumer desires. If the service received exceeds customer expectations, the perceived quality of service is ideal. In addition, another factor supporting customer satisfaction is the price. For sensitive customers, usually low prices are an important source of satisfaction because they will get high-value money (Handi Irawan, Citation2003). Therefore the provision of packaging services is critical to support customer satisfaction.
The attribute of the method of payments (CK2) has the highest loading value for the friendly dimension, which indicates that the payment method options play an important role in the quality of logistics services. This is supported by Walton et al. (Citation2016), which states that the high level of competition in the field of logistics services requires companies to use the best methods that facilitate customers in making payment transactions. By providing several choices in payment methods, this can make it easier for customers to adjust their needs.
Furthermore, regarding the TM1 attribute of a live tracking system that shows the trip package from pick-up to drop off, this system allows route visualization or real-time tracking of vehicle locations. To improve logistics management, companies need real-time information with a high degree of precision (Bowersox & Closs, Citation1996). The information referred to consists of time and location, which can be obtained through the global position system (GPS). The company invests in a monitoring and tracking system that aims to improve services, reduce costs, and ensure safety in cargo transportation. According to Jansen-Vullers et al. (Citation2003), tracking provides a location where the entity is monitored at all times. Shamsuzzoha and Helo (Citation2011) stated that the use of monitoring and tracking systems is significant to reduce costs, speed up shipments, and even identify bottlenecks and operational shortcomings. Moreover, a study by Anefalos and Filho (Citation2011) found that the use of the monitoring and tracking system has contributed to reduce the amount of lost goods. Logistics tracking for the shipping network is an important issue for providing customer service in the transportation and monitoring business, and ongoing tracking is required for the delivery of high-value and vital goods.
In addition to these other attributes, researchers suggest evaluating performance needs to be done regularly. It aims to improve the performance of the logistics service provider’s employees so that the level of customer satisfaction can increase. Furthermore, performance evaluation also serves to find out the weak points of the logistics provider services. By evaluating performance, the company will find out the deficiencies that have been complained about by customers. After conducting a performance evaluation, it is expected that there is control from related parties so that the performance that has been evaluated and improved can run smoothly. Prameswara et al. (Citation2014) said that one of the initial efforts in improving the quality of services by enhancing performance and control of relevant parties could run well so that customer satisfaction will increase.
Theoretically, the use of Kansei engineering in the logistics service quality businesses such as in shipping, packing, and delivery services is important to understand the real needs of customers for the services. Kansei words, which are ergonomic-based, has captured the voice of customers for logistics service quality. The attributes of logistics service quality developed using Kansei engineering in this study have led the customers to raise more free and detailed service attributes. This result is in line with previous investigations (Carreira et al., Citation2013), who found that Kansei engineering could produce a holistic perspective of customers’ experience and emotions. Moreover, Hartono and Chuan (Citation2011) indicated that Kansei engineering is an excellent potential approach to provide a competitive advantage from its ability to read and translate customer’s affect and emotion in actual service.
5. Conclusion
This study applies the Kansei Engineering approach to design service designs for document and package delivery services through an exploration of the relationship of service attributes and emotional customer needs (Kansei). By knowing service attributes and needs that are important to customers, companies can improve the quality of existing services or create new services. Therefore Servqual is needed to generate customer trust, so customer loyalty will be easy to obtain.
This study adopted a questionnaire instrument in a previous study, which was developed into 39 service attribute instruments, three trust instruments, and three loyalty instruments. The questionnaire was distributed by purposive sampling. The aim is to get a representative sample with special consideration following the criteria determined by 100 respondents. The sample criteria used, i.e. ever using each service, especially in package delivery services, package tracking services, and delivery services package at least one time.
This article proposes two hypotheses. The result is that service quality at the Indonesian logistics service providers has a significant impact on customer trust. Then the customer’s trust in the services provided by a logistics service provider also has a considerable influence on customer loyalty. In addition, from the loading factor evaluation, it can also determine the importance of specific service attributes, either. This study also provides findings of representative service attributes, both in each word and in each service element.
This study has several limitations and needs to be addressed in future studies. First, this study uses customers in Indonesian logistics service providers as respondents; thus, the results may not fully represent the logistics services in other countries. Future research can investigate whether the findings of this study apply to different regions and respondents. Second, researchers suggest future research can expand Kansei words such as nouns or adjectives. Third, this research does not cover all service elements and service attributes in service design stimulation, such as company visibility and others, so this can be used as stimulation of service design in future research.
Additional information
Funding
Notes on contributors
Dian Palupi Restuputri
Dian Palupi Restuputri is a lecturer and researcher in Industrial Engineering department at the University of Muhammadiyah Malang. Her research interests are in the area of ergonomics and human factor engineering. She received his bachelor’s degree in Industrial Engineering from the Diponegoro University, Indonesia (2007). She holds a master’s degree in Industrial Engineering from Institute of Technology Bandung, Indonesia (2012) (Email: [email protected], tel: +62-341 464 318 ext. 166).
Ilyas Masudin
Ilyas Masudin is an associate professor in Industrial Engineering department, University of Muhammadiyah Malang, Indonesia. He holds a PhD in Logistics from RMIT University, Australia. His research interests include logistics optimization, supply chain management, multi-criteria decision-making and operations management (E-mail: [email protected], tel: +62-341 464 318, ext.166).
Citra Permata Sari
Citra Permata Sari is a researcher in Industrial Engineering department, University of Muhammadiyah Malang, Indonesia. Her research interests are industrial system optimization, system modelling and operations management (E-mail: [email protected], tel: +62-341 464 318 ext. 166).
References
- Anefalos, L. C., & Filho, J. V. C. (2011). Logistic performance of cut flower exports: A process input-output model application1. Revista De Economia Agrícola, 58(2), 5–25. https://iea.agricultura.sp.gov.br/ftpiea/publicacoes/rea/2011/rea1-2-11.pdf
- Avlonitis, G. J., & Indounas, K. A. (2005). Pricing objectives and pricing methods in the services sector. Journal of Services Marketing, 19(1), 47–57. https://doi.org/10.1108/08876040510579398
- Baki, B., Basfirinci, C. S., AR, I. M., & Cilingir, Z. (2009). An application of integrating SERVQUAL and Kano’s model into QFD for logistics services. Asia Pacific Journal of Marketing and Logistics, 21(1), 106–126. https://doi.org/10.1108/13555850910926272
- Bansal, H. S., McDougall, G. H., Dikolli, S. S., & Sedatole, K. L. (2004). Relating e‐satisfaction to behavioral outcomes: An empirical study. Journal of Services Marketing, 18(4), 290–302. https://doi.org/10.1108/08876040410542281
- Bienstock, C. C., Mentzer, J. T., & Bird, M. M. (1997). Measuring physical distribution service quality. Journal of the Academy of Marketing Science, 25(1), 31. https://doi.org/10.1007/BF02894507
- Boaden, R. J. (1997). What is total quality management … and does it matter? Total Quality Management, 8(4), 153–171. https://doi.org/10.1080/0954412979596
- Bottani, E., & Rizzi, A. (2006). A fuzzy TOPSIS methodology to support outsourcing of logistics services. Supply Chain Management: An International Journal, 11(4), 294–308. https://doi.org/10.1108/13598540610671743
- Bowersox, D. J., & Closs, D. J. (1996). Logistical management: The integrated supply chain process. McGraw-Hill College.
- Boyer, K. K., Hult, G. T., & Frohlich, M. (2003a). An exploratory analysis of extended grocery supply chain operations and home delivery. Integrated Manufacturing Systems, 14(8),652–663.
- Boyer, K. K., Tomas Hult, G., & Frohlich, M. (2003b). An exploratory analysis of extended grocery supply chain operations and home delivery. Integrated Manufacturing Systems, 14(8), 652–663. https://doi.org/10.1108/09576060310503465
- Cairns, S. (1996). Delivering alternatives: Successes and failures of home delivery services for food shopping. Transport Policy, 3(4), 155–176. https://doi.org/10.1016/S0967-070X(96)00021-2
- Carlos Martín, J., Román, C., & Espino, R. (2008). Willingness to pay for airline service quality. Transport Reviews, 28(2), 199–217. https://doi.org/10.1080/01441640701577007
- Carreira, R., Patrício, L., Jorge, R. N., & Magee, C. L. (2013). Development of an extended Kansei engineering method to incorporate experience requirements in product–service system design. Journal of Engineering Design, 24(10), 738–764. https://doi.org/10.1080/09544828.2013.834038
- Chaudhuri, A., & Holbrook, M. B. (2001). The chain of effects from brand trust and brand affect to brand performance: The role of brand loyalty. Journal of Marketing, 65(2), 81–93. https://doi.org/10.1509/jmkg.65.2.81.18255
- Chen, M.-C., Chang, K.-C., Hsu, C.-L., & Xiao, J.-H. (2015). Applying a Kansei engineering-based logistics service design approach to developing international express services. International Journal of Physical Distribution & Logistics Management, 45(6), 618–646. https://doi.org/10.1108/IJPDLM-10-2013-0251
- Chenet, P., Dagger, T. S., & O’Sullivan, D. (2010). Service quality, trust, commitment and service differentiation in business relationships. Journal of Services Marketing, 24(5), 336–346. https://doi.org/10.1108/08876041011060440
- Cohen, J. (1992). A power primer. Psychological Bulletin, 112(1), 155. https://doi.org/10.1037/0033-2909.112.1.155
- Crosby, P. B. (1990). Leading, the art of becoming an executive. McGraw-Hill.
- Dahlgaard, J. J., Schütte, S., Ayas, E., & Mi Dahlgaard-Park, S. (2008). Kansei/affective engineering design: A methodology for profound affection and attractive quality creation. The TQM Journal, 20(4), 299–311. https://doi.org/10.1108/17542730810881294
- Davis, B. R., & Mentzer, J. T. (2006). Logistics service driven loyalty: An exploratory study. Journal of Business Logistics, 27(2), 53–73. https://doi.org/10.1002/j.2158-1592.2006.tb00217.x
- Davis, F. D. (1989). Perceived usefulness, perceived ease of use, and user acceptance of information technology. MIS Quarterly, 13(3), 319–340. https://doi.org/10.2307/249008
- Easton, G. S., & Jarrell, S. L. (1998). The effects of total quality management on corporate performance: An empirical investigation. The Journal of Business, 71(2), 253–307. https://doi.org/10.1086/209744
- Firnstahl, T. W. (1989). My employees are my service guarantee. Harvard Business Review, 67(4), 28–34.
- Gefen, D. (2002). Customer loyalty in e-commerce. Journal of the Association for Information Systems, 3(1), 2. https://doi.org/10.17705/1jais.00022
- Ghozali, I. (2006). Aplikasi analisis multivariate dengan program SPSS. Badan Penerbit Universitas Diponegoro.
- Hair, J. F., Jr, Hult, G. T. M., Ringle, C., & Sarstedt, M. (2016). A primer on partial least squares structural equation modeling (PLS-SEM). Sage publications.
- Handi Irawan, D. (2003). Indonesian customer satisfaction: Membedah strategi kepuasan pelanggan merek pemenang ICSA. Elex Media Komputindo.
- Hapsari, S. N., Sjafrizal, T., & Anugraha, R. A. (2017). Designing train passenger seat by kansei engineering in Indonesia. MATEC Web of Conferences, Langkawi, Malaysia. (p. 00017). EDP Sciences.
- Hartono, M. (2016). The extended integrated model of Kansei Engineering, Kano, and TRIZ incorporating cultural differences into services. International Journal of Technology, 7(1), 97–104. https://doi.org/10.14716/ijtech.v7i1.1789
- Hartono, M., & Chuan, T. K. (2011). How the Kano model contributes to Kansei engineering in services. Ergonomics, 54(11), 987–1004. https://doi.org/10.1080/00140139.2011.616229
- Hartono, M., Santoso, A., & Prayogo, D. N. (2017). How Kansei Engineering, Kano and QFD can improve logistics services. International Journal of Technology, 8(6), 1070–1081. https://doi.org/10.14716/ijtech.v8i6.689
- Hartono, M., Tan, K. C., & Peacock, J. B. (2013). Applying Kansei Engineering, the Kano model and QFD to services. International Journal of Services, Economics and Management, 5(3), 256–274. https://doi.org/10.1504/IJSEM.2013.054958
- Hsiao, Y.-H., Chen, M.-C., & Liao, W.-C. (2017). Logistics service design for cross-border E-commerce using Kansei engineering with text-mining-based online content analysis. Telematics and Informatics, 34(4), 284–302. https://doi.org/10.1016/j.tele.2016.08.002
- Ishihara, S., Nagamachi, M., Schutte, S., & Eklund, J. (2008). Affective meaning: The kansei engineering approach. Product Experience, (Elsevier).2008, 477–496. https/doi.org/10.1016/b978-008045089-6.50023-x
- Jansen-Vullers, M. H., van Dorp, C. A., & Beulens, A. J. (2003). Managing traceability information in manufacture. International Journal of Information Management, 23(5), 395–413. https://doi.org/10.1016/S0268-4012(03)00066-5
- Jurik, T. (2016). Concept of service logistics. Acta logistica, 3(2), 21–25. https://doi.org/10.22306/al.v3i2.64
- Lewis, B. R., & Soureli, M. (2006). The antecedents of consumer loyalty in retail banking. Journal of Consumer Behaviour: An International Research Review, 5(1), 15–31. https://doi.org/10.1002/cb.46
- Lim, K. S., & Razzaque, M. A. (1997). Brand loyalty and situational effects: An interactionist perspective. Journal of International Consumer Marketing, 9(4), 95–115. https://doi.org/10.1300/J046v09n04_06
- Lin, C.-L. H. C.-S., & Chen, M.-C. (2011). Exploring logistics services quality in home delivery industry: Do service providers and customers have different viewpoints? Journal of Quality Vol, 18(5), 439. https://ir.lib/pccu.edu.tw/handle/987654321/37463
- Melinda, A. W., Arifudin, R., & Alamsyah, A. (2019). Implementation of the servqual method as a service support decision support system in hotels. Journal of Advances in Information Systems and Technology, 1(1), 91–97. https://journal.unnes.ac.id/sju/index.php/jaist/article/view/36506/15073
- Mentzer, J. T., & Kahn, K. B. (1995). A framework of logistics research. Journal of Business Logistics, 16(1), 231. https://search.proquest.com/openview/3028e4c8cc9e84658430e032c97cb1a8
- Moorman, C., Deshpande, R., & Zaltman, G. (1993). Factors affecting trust in market research relationships. Journal of Marketing, 57(1), 81–101. https://doi.org/10.1177/002224299305700106
- Moorman, C., Zaltman, G., & Deshpande, R. (1992). Relationships between providers and users of market research: The dynamics of trust within and between organizations. Journal of Marketing Research, 29(3), 314–328. https://doi.org/10.1177/002224379202900303
- Nagamachi, M. (1995). Kansei engineering: A new ergonomic consumer-oriented technology for product development. International Journal of Industrial Ergonomics, 15(1), 3–11. https://doi.org/10.1016/0169-8141(94)00052-5
- Naomi, P. E. (2015). Pengaruh Kepercayaan, Kemudahan, Kualitas Informasi, dan Harga terhadap Keputusan Pembelian Konsumen Dalam Memilih Berbelanja Secara Online. In Jurnal. Universitas Muhammadiyah Purworejo,12(1D), 1–12.
- Parasuraman, A. (2000). Technology Readiness Index (TRI) a multiple-item scale to measure readiness to embrace new technologies. Journal of Service Research, 2(4), 307–320. https://doi.org/10.1177/109467050024001
- Parasuraman, A., Berry, L. L., & Zeithaml, V. A. (1991). Refinement and reassessment of the SERVQUAL scale. Journal of Retailing, 67(4), 420. https://search.proquest.com/openview/20ce41a3232b328cf26648612
- Parasuraman, A., Zeithaml, V. A., & Berry, L. L. (1994). Reassessment of expectations as a comparison standard in measuring service quality: Implications for further research. Journal of Marketing, 58(1), 111–124. https://doi.org/10.1177/002224299405800109
- Persson, G., & Virum, H. (2001). Growth strategies for logistics service providers: A case study. The International Journal of Logistics Management, 12(1), 53–64. https://doi.org/10.1108/09574090110806226
- Prameswara, D. A., Mustafid, M., & Prahutama, A. (2014). Metode Servqual-six Sigma Untuk Peningkatan Kualitas Pelayanan Publik (Studi Kasus Di Kantor Kecamatan Kedungbanteng, Purwokerto). Jurnal Gaussian, 3(4), 625–634. https://ejournal3.undip.ac.id/index.php/gaussian/view/8073
- Rana, R., & Singhal, R. (2015). Chi-square test and its application in hypothesis testing. Journal of the Practice of Cardiovascular Sciences, 1(1), 69. https://doi.org/10.4103/2395-5414.157577
- Ribbink, D., & Grimm, C. M. (2014). The impact of cultural differences on buyer–supplier negotiations: An experimental study. Journal of Operations Management, 32(3), 114–126. https://doi.org/10.1016/j.jom.2014.01.004
- Roslan, N. A. A., Wahab, E., & Abdullah, N. H. (2015). Service quality: A case study of logistics sector in Iskandar Malaysia using SERVQUAL model. Procedia-Social and Behavioral Sciences, 172(2015), 457–462. https://doi.org/10.1016/j.sbspro.2015.01.380
- Saura, I. G., Frances, D. S., Contri, G. B., & Blasco, M. F. (2008). Logistics service quality: A new way to loyalty. Industrial management & data systems,108(5), 650–668.
- Schütte*, S. T., Eklund, J., Axelsson, J. R., & Nagamachi, M. (2004). Concepts, methods and tools in Kansei engineering. Theoretical Issues in Ergonomics Science, 5(3), 214–231. https://doi.org/10.1080/1463922021000049980
- Shamsuzzoha, A., & Helo, P. T. (2011). Real-time tracking and tracing system: Potentials for the logistics network. Proceedings of the 2011 international conference on industrial engineering and operations management, Kuala lumpur, Malaysia. (pp. 22–24).
- Sirdeshmukh, D., Singh, J., & Sabol, B. (2002). Consumer trust, value, and loyalty in relational exchanges. Journal of Marketing, 66(1), 15–37. https://doi.org/10.1509/jmkg.66.1.15.18449
- Småros, J., Holmström, J., & Kämäräinen, V. (2000). New service opportunities in the e-grocery business. The International Journal of Logistics Management, 11(1), 61–74. https://doi.org/10.1108/09574090010806065
- Spreng, R. A., Harrell, G. D., & Mackoy, R. D. (1995). Service recovery: Impact on satisfaction and intentions. Journal of Services Marketing, 9(1), 15–23. https://doi.org/10.1108/08876049510079853
- Stank, T. P., Goldsby, T. J., & Vickery, S. K. (1999). Effect of service supplier performance on satisfaction and loyalty of store managers in the fast food industry. Journal of Operations Management, 17(4), 429–447. https://doi.org/10.1016/S0272-6963(98)00052-7
- Suri, R., Sanders, J. L., & Kamath, M. (1993). Performance evaluation of production networks. Handbooks in Operations Research and Management Science, 4 (1993),199–286. https://doi.org/10.1016/S0927-0507(05)80185-
- Thai, V. V. (2013). Logistics service quality: Conceptual model and empirical evidence. International Journal of Logistics Research and Applications, 16(2), 114–131. https://doi.org/10.1080/13675567.2013.804907
- Thompson, P., DeSouza, G., & Gale, B. T. (1985). The strategic management of service quality. Quality Progress, 18(6), 20–25.
- Walton, R., Mays, R., & Haselkorn, M. (2016). How humanitarian culture informs change adoption: A case study of humanitarian logistics. Advances in Managing Humanitarian Operations, (Springer). 235(2016),135–157. https://doi.org/10.1007/978-3-319-2418-1_7
- Wang, Y. S., Wang, Y. M., Lin, H. H., & Tang, T. I. (2003). Determinants of user acceptance of Internet banking: An empirical study. International Journal of Service Industry Management, 14(5), 501–519. https://doi.org/10.1108/09564230310500192
- Wisnalmawati, W., Idrus, M., Idrus, M., Surachman, S., & Rahayu, M. (2014). Effect of store image on store loyalty and perceived quality as mediation (Customers of Batik Tulis Village Store at Yogyakarta Special Region). International Journal of Business and Management Invention, 3(11), 20–30. https://doi.org/28.8028/031102020030
- Yoo, K.-H., Lee, Y., Gretzel, U., & Fesenmaier, D. R. (2009). Trust in travel-related consumer generated media. In Information and communication technologies in tourism 2009, Amsterdam, The Netherland,(pp. 49–59).
- Zahorik, A. J., & Rust, R. T. (1993). Customer satisfaction, customer retention, and market share. Journal of Retailing, 69(2), 193–215. https://doi.org/10.1016/0022-4359(93)90003-2