
Abstract
Trucking companies are important part of supply chains, as they connect most of product movements. While a lot of studies have been done to assess supply chain maturity level, very limited studies have been done to specifically address trucking companies. In this study we develop a model and measurement instruments to assess maturity of trucking companies in terms of their innovative capabilities. Innovative capabilities are critical in today's fast technological development such as industry 4.0 and trucking companies have opportunities to use those technologies to play a better role in the supply chain they involve in. We then use the instruments to assess the maturity level of 52 companies that involved in transporting goods using trucks. The results show that the maturity level has a widespread, ranging from the lowest to the highest level, but most of them are in the category of partial maturity to mature. This indicates that most companies have an opportunity to improve their innovative capabilities.
1. Introduction
Transportation is an important and inseparable part of logistics and supply chain activities. Trucking companies play an important role in the delivery of goods on land and connecting other modes of transportation. The trucking industry is characterized by high competition, large players, and relatively limited innovation. With the recent technological development, trucking companies have ample opportunities to improve their services and playing better roles in the supply chains.
Industry 4.0 is growing rapidly today, and as a result, trucking companies are also required to follow the trend to improve their services (Strandhagen et al., Citation2017). These additional services include online booking, real-time delivery information, system connectivity with customers, and many others (Oleśków-Szłapka & Stachowiak, Citation2018). It requires trucking companies to continue to innovate to keep up with the changes. To continue to innovate, trucking companies must have innovative capabilities. The innovative capability is the company’s ability to make changes, adapt and implement knowledge into something new and is carried out continuously in order to achieve the company’s strategic goals through innovative actions and processes (Hurley & Hult, Citation1998; Lawson & Samson, Citation2001; Wang & Ahmed, Citation2004; Yang, Citation2012).
The innovative capability of trucking companies in this study is influenced by technological capabilities, market orientation, and supplier relationships. The three factors above play an important role in increasing the trucking company’s innovative capability. For this reason, it is critical to review and assess the readiness and maturity of a trucking company’s innovative capabilities. There is less research on the innovative capability for the service industry than for the manufacturing industry. Moreover, research that focuses on the innovative capability of trucking companies is also rare, especially those that examine the maturity level of the innovative capability in trucking companies. This assessment is useful for mapping the maturity level of the trucking company’s innovative capability based on the three factors above, to then be used in determining the next strategic step (Proença & Borbinha, Citation2016). The data obtained plays an important role in knowing industry developments in identifying gaps to ensure success and assist companies in maintaining their status as market leaders (Antunes et al., Citation2014). This study aims to assess the maturity level of trucking companies’ innovative capability in Indonesia to compare their implementation in the field with the strategies of companies and others (Röglinger et al., Citation2012; Zhang et al., Citation2017).
This study uses the capability maturity model as an instrument to assess the maturity level of trucking companies’ innovative capability and adopt related measures (Y. C. Chen & Wang, Citation2018). The superiority of this model has been confirmed by various studies (Appleby & Mavin, Citation2000; Delaney & Huselid, Citation1996; Huselid, Citation1995). The framework will assist companies in prioritising the capabilities on which they should focus. Companies can critically evaluate the components of their innovative capability to help them become competitive. This study focuses on trucking companies in Indonesia to assess maturity levels. The research questions for this study are as follows.
RQ 1: What is the maturity level of a trucking company’s innovative capability? To what extent is the maturity level of this trucking company’s innovative capability influenced by such determinants as the maturity level of technological capability, market orientation and supplier relations?
RQ 2: Do trucking companies in various industries have the same level of maturity in their innovative capability? Does the company’s size, whether based on truck units owned or annual revenue, affect the maturity level of a trucking company’s innovative capability? Are the determinants of the maturity level of a trucking company’s innovative capability different in the above groupings?
This research is structured as follows. Part 2 contains a review of the literature on innovative capability, the components of innovative capability and an explanation of the maturity model in the context of a trucking company. Section 3 presents an empirical research design using data on 52 trucking companies in Indonesia. Section 4 discusses the results obtained. In addition, we also analysed the groups and compared the results with one another. Section 5 is the discussion, and section 6 offers concluding comments, limitations of the study, and suggestions for future research and strategies to overcome these limitations.
2. Literature review
2.1. Innovative capability
The innovative capability is the entire ability of a company to change, adapt and implement ideas and knowledge (processes, systems, products, services, and many others) into something new and carried out continuously for the company’s strategic interests through innovative behaviour and processes (Hurley & Hult, Citation1998; Lawson & Samson, Citation2001; Wang & Ahmed, Citation2004; Shou et al., 2016; Yang, Citation2012). This innovative capability influences the success and sustainability of the company (Cardozo et al., Citation1993; Lai et al., Citation2015).
Trucking companies are an important part of the supply chain. Factors that influence the innovative capability in the supply chain in previous research, among others, are competence, flexibility, responsiveness (Ferrer et al., Citation2011), collaboration (Swink, Citation2006), network contribution (Delbufalo, Citation2015), and big data (Tan et al., Citation2015). Innovative capability in the logistics sector positively impacts performance (Grawe et al., Citation2011; Ho & Chang, Citation2015; Kafetzopoulos & Psomas, Citation2015). ideally, logistics companies focus more on providing better services to customers (Wang et al., Citation2020). Just-in-time systems result from the logistics sector’s innovative capability, saving on warehouse space and reducing overall costs (Wei et al., Citation2018). As part of the supply chain and logistics, trucking companies must also develop their innovative capabilities to improve their performance. In this research, the innovative capability of trucking companies consists of technological capabilities, market orientation and supplier relationship. The components will be discussed in the following sub-sections.
2.2. Innovative capability components
2.2.1. Technological capability
Technological capabilities are the current capabilities and future potential to apply specific technologies, solve technical problems, or improve technical functions (Lefebvre & Lefebvre, Citation2002; Nicholls-Nixon, Citation1995). Technological capability is an attempt by a company to change or improve the quality of products and processes, with the creation of knowledge, technical capabilities and the integration of new, more advanced components (Kyläheiko et al., Citation2011; Quintana-García & Benavides-Velasco, Citation2008; Radosevic & Yoruk, Citation2016).
Technological capabilities are the driving force for innovation in companies (Hsieh & Tsai, Citation2007). Technological capabilities are the foundation for companies to build capabilities and processes to innovate (the innovative capability; Eng & Okten, Citation2011). Innovative capability is the ability to create new technologies, product or process features and designs, and develop company ideas (Bell & Figueiredo, Citation2012). Technological capabilities support the formation of this capability because technological capabilities also include the ability to conduct research and development (Radosevic & Yoruk, Citation2016). This ability plays two roles: the ability to absorb knowledge from outside the company and carry out leading-edge technology (Szalavetz, Citation2019). Technological capabilities play an important role in increasing the trucking company’s innovative capability. Currently, digital transformation and the use of advanced technology are increasing along with the progress of the times. The progress of the times is closely related to the use of technology, so that ability in this field is important.
2.2.2. Market orientation
Market orientation is the company’s philosophy always to meet customer needs (Aziz & Omar, Citation2013). Market orientation is a response to and commitment to customer needs and wants. It is done by creating better value than competitors by coordinating activities to achieve customer satisfaction (Narver & Slater, Citation1990; Ruekert, Citation1992). Market orientation is a company marketing concept that puts the customer at the centre of the company’s strategic thinking and operations (Keskin, Citation2006). It is done by analysing market information (Aziz & Omar, Citation2013). Market orientation must align with the company’s strategy because it directly impacts technology choice and product development (Conant et al., Citation1990; McKee et al., Citation1989). High market orientation gives birth to processes, behaviours, and skills reflected in the company’s culture in meeting customer satisfaction and paying attention to the responses and capabilities of competitors (Prasad et al., Citation2001).
Market orientation has three related parts: customer orientation, competitor orientation, and coordination between functions (Mukhtar Shehu & Mahmood, Citation2014; Narver & Slater, Citation1990). Customer orientation continuously communicates and defends customer needs (Han et al., Citation1998). Customer orientation is a major factor because creating superior value is carried out for customers (McNaughton et al., Citation2002). Competitor orientation is a company’s effort to predict its strengths and weaknesses in the short and long term to provide better customer service than competitors (Huhtala et al., Citation2014). The last is coordination between company functions individually and in departments to synergise and collaborate to achieve company goals (Zehir et al., Citation2015).
In this study, the trucking company’s market orientation focuses on two aspects of market orientation, namely customer orientation and competitor orientation. Customer-oriented companies continuously and consistently innovate to meet the needs and retain their main customers (Chaudhry et al., Citation2019). Amid intense competition, innovative companies focus on the current market and try to meet customers’ needs in the future (Hortinha et al., Citation2011). Customer-oriented companies tend to develop innovative capabilities. It is intended to make companies more innovative and responsive to customer needs (Chaudhry et al., Citation2019). Customer orientation positively correlates with innovative capability (Appiah-Adu & Singh, Citation1998; Grinstein, Citation2008). Competitor orientation is a source for organisational learning, which can develop innovative capabilities specifically (Lisboa et al., Citation2011; Slater et al., Citation2014). Although competitor orientation is considered less important than customer orientation, it is still an important part of its innovative capability. It will be further proven by the data obtained by comparing the orientation of customers and competitors.
2.2.3. Supplier relationship
In line with the resource dependence theory, supplier relationships are interdependent relationships between companies and suppliers to produce effective and efficient business operations. However, the level of dependence is usually associated with price (I. S. N. Chen & Fung, Citation2013). A high bond relationship is collaborative, and this relationship describes a close bond with high dependence. This relationship relates to a commitment to achieving long-term benefits (Day, Citation2000).
Good relational relationships enable suppliers to tailor their operations to support their specific needs. Companies also tend to invest more with longer relationships especially with their key suppliers, i.e., suppliers who supply key technologies and other major inputs. Sometimes the change of suppliers is costly, and this is due to the investment of money, time and experience spent in the relationship (Tsai & Hung, Citation2016). As time and experience gain, the urge to forge closer relationships grows stronger. It can be realised through collaboration, integration and corporate alliances (Krause et al., Citation2007). The involvement of suppliers in product development has a positive impact because apart from reducing costs, it also improves quality and technology. It allows the use of new ideas that the company has not thought of (Story et al., Citation2009).
Relationships with suppliers are company assets because they increase supplier innovation, ultimately improving company performance (Oke et al., Citation2013). Suppliers have access to technological advances, processes, materials, and ideas to benefit corporate innovation (Koufteros et al., Citation2005; Schoenherr & Swink, Citation2015). Product development innovation requires alignment between suppliers and companies, arising from long-standing and good relationships (Lee, Citation2002). This relationship allows the utilisation of the capabilities possessed by the supplier (Martins & Terblanche, Citation2003). This relationship also generates mutual trust, positively impacting product innovation (Corsten & Felde, Citation2005). This trust is obtained from the involvement and contribution of suppliers to the development of the company’s innovative products (Jajja et al., Citation2017). Supplier involvement maximises the company’s product innovation and reduces uncertainty (Lettice et al., Citation2010).
The innovative capability is the company’s ability to support the innovation culture of the entire company, and this is not only produced by the research and development department (Petroni & Panciroli, Citation2002). Collaboration and communication relationships, including with suppliers, impact the company’s innovative capability (Hurley & Hult, Citation1998). Relational resources have a major influence on the company’s innovative capability (Shou et al., Citation2017; Sulistyo & Siyamtinah, Citation2016). Companies that have good relationships with suppliers can take advantage of the innovative capability and supplier insight to ultimately increase the company’s innovative capability (Oke et al., Citation2013).
2.3. Capability maturity model (CMM)
The concept of process maturity in the context of this research is the Capability Maturity Model (CMM). The term maturity can be interpreted as being ready, complete, and perfect to perform a task. Therefore, the capability maturity model can be defined as an activity that uses various tools and practices to assess the strengths and weaknesses of the company’s ability to grow and develop through an evolutionary path from immature organisational processes to become mature, efficient, and effective (Wibowo & Waluyo, Citation2015). The model determines the company’s current state from experience, resources used, operational methods, goals and priorities, and ways to achieve company goals (diagnoses; Tubis & Werbińska-Wojciechowska, Citation2021). Furthermore, these results are used for decision making in finding ways to improve the main factors that contribute to increasing the company’s competence (planning).
The concept of process maturity initially used an improvement cycle (Plan—Do—Check—Act). This concept came to the attention of the Software Engineering Institute (SEI), which Carnegie Mellon University further developed in the United States in 1995. Initially, this concept was used as a software process control for continuous process improvement (Facchini et al., Citation2020; Mendes et al., Citation2016). Various organisations have used this concept, such as governments, businesses, and other organisations. This concept is also commonly used in application areas such as project management, risk management, supply chain management (Fischer et al., Citation2016), and many others.
The maturity model concept dates back to the 1980s by Watts Humphrey at IBM (Y. C. Y. C. Chen & Wang, Citation2018). This concept assumes that a process of growth and development depends on regulation, management, performance measurement, and control. Maturity of the process occurs through the institutionalisation of policies, standards and organisational structures. Adopting this model will mature practice, starting from inconsistent and not clearly defined practices, then becoming a continuously improved practice so that business processes become comprehensive and clearly defined to optimise innovation (Tubis & Werbińska-Wojciechowska, Citation2021). The advantage of a mature process is reducing time for a shorter development cycle (Lockamy & Mccormack, Citation2004).
The main purpose of this model is to assess the achievement of results against the target maturity process. Of course, when the company’s processes are more mature, they will be better prepared to face challenges and carry out business innovations (Rudnicka, Citation2017). The model is a tool or roadmap to compare, describe, measure, and determine steps (Proença & Borbinha, Citation2016). The maturity model is used to assess the company’s state according to the state described by the model as a starting point for improving the company’s processes. The maturity model can be compared with other companies (Röglinger et al., Citation2012; Zhang et al., Citation2017).
This capability maturity model is used to increase its knowledge, skills, and abilities to achieve its goals (Bill Curtis et al., Citation1995). It relates to the ability to carry out important company activities so that investments will generate benefits for the company. This ability is unique and comprehensive, accumulated from experience, process, learning, skills, and knowledge (Wademan et al., Citation2008). The advantages of the capability maturity model have been confirmed by many studies (Appleby & Mavin, Citation2000; Delaney & Huselid, Citation1996; Huselid, Citation1995). These advantages include, among others, the capabilities required by the job to be more recognisable, the application of a system that is more targeted and easy to understand, consistent repetition of activities, continuous improvement to obtain the best work practices (Y. C. Y. C. Chen & Wang, Citation2018). Doing so requires an understanding of the organisation as a whole and the direction of the company’s goals in the future (Brookes & Clark, Citation2009).
The capability maturity model combines best practices as a reference for assessing the maturity of processes within the organisation, ranging from unmeasured and structured processes to mature processes (Herbsleb et al., Citation1997). This model provides a systematic framework for benchmarking and improving performance. Two areas of application of this model are, among others, a model for assessing the maturity level of company capabilities and project management maturity (Demir & Kocabaş, Citation2010). This model can help organisations save, improve quality and encourage efficient behaviour to reduce risk amid intense business competition (Antunes et al., Citation2014). The capability maturity model is a measurement model to evaluate organisational capability (Lahrmann et al., Citation2011).
The capability maturity model emphasises incremental improvement rather than radical innovation. According to Fraser et al. (Citation2002), there are three characteristics of the firm’s capability maturity model.
The model generally has three to six maturity levels.
Several processes with criteria or activities must be carried out at each maturity level.
Each activity is described for each stage of maturity. This step is divided into three to six levels for continuous process improvement.
This level is intended to measure and evaluate the company’s capabilities or processes (Paulk et al., Citation1993). This process helps the company continuously improve so that mature processes and capabilities are obtained. Each level has different challenges to gradually increase the company’s capabilities and make the company’s processes and capabilities grow and develop mature.
There are three types of maturity models (Mendes et al., Citation2016). First is the maturity grid, complete with descriptions for each maturity level. The second is a type of questionnaire. This level of maturity can be measured through a five-point Likert scale (De Bruin et al., Citation2005). The questions in this section are about ranking best practices within a given maturity level. Third, a complex maturity model contains goals and practices that are general to specific for each process and each stage of maturity level.
This maturity level is a gradual evolutionary process that symbolises the company’s maturation path. The company will be evaluated based on the current maturity level and carry out a series of processes for improvement to enter a higher maturity stage (Pöppelbuß & Röglinger, Citation2011). When the level of maturity associated with specific activities increases, the company will operate more efficiently (Becker et al., Citation2010). An important characteristic of the capability maturity model is that it is gradual and continuous, during which the company can decide which approach to take. The continuous approach allows the company to choose the specific process it wants to improve, while the phased approach allows for implementing a series of processes using a proven path to improve the company compared to other companies (Antunes et al., Citation2014).
The ability maturity model in this study uses five maturity levels as follows (Y. C. Chen & Wang, Citation2018; Facchini et al., Citation2020; Herbsleb et al., Citation1997; Paulk et al., Citation1993; Vakaslahti, Citation1997):
Initial: At this time, the ability is still not well regulated, inconsistent, and sometimes not in sync with other activities, even developed inappropriately. Success depends on the efforts and performance of individuals who encourage and are motivated to perform a task. The company also does not understand the importance of building capacity, so that it has not supported the development of this activity.
Repetition: The success of the capabilities in the first phase becomes the impetus for repeating the process that has proven successful for other problems with similar applications. This process can be implemented, documented, managed, trained, measured, and improved. The costs, completion time, required functions and performance in the previous stage become the reference for this stage. Process discipline is a prerequisite for successful reproduction.
Defined: The process is organised, documented, standardised, integrated into the organisational capability process comprehensively. All company activities use versions that have been approved and adopted into company standards for the maintenance and development of enterprise capabilities. This defined process helps the company to work more effectively, and each component understands the roles and responsibilities in the defined process. The training program is implemented to ensure employees have sufficient skills and knowledge. It is aimed at creating stability and consistency of successful and controlled repetition.
Managed: At this stage, the company determines the quality objectives for the results and processes. Productivity and quality are aspects that are measured consistently and well defined. It is intended for process evaluation. Performance is expected to fall within the standard tolerance limits that have been determined with minimal variations. When this limit is exceeded, actions are taken to improve the situation so that consistency and performance can be predicted properly. Detailed and detailed steps are collected and analysed in every company process. Understanding and control are further developed by developing and improving the company’s human resource capabilities.
Process Optimisation: Continuous improvement of processes and methods and feedback from measurement and use of innovative ideas and technologies. It is aimed at identifying weaknesses and building the company’s competencies proactively. The company’s capabilities continue to be gradually improved in existing processes by using new technologies and methods.
further describes the levels of the capability maturity model for each factor, the focus areas of concern and the focus of attention for each maturity level. Three factors contribute to the innovative capability of trucking companies, market orientation (customer and competitor orientation), technological capability and supplier relationship. Each of them consists of five levels of maturity. The Initial (first) level consist of one indicator, repetition (second) level consist of six indicators, defined (third) level consists of five indicators, managed (fourth) level consist of six indicators, and (fifth) process optimisation level consists of four indicators.
Table 1. Maturity model for innovative capability of trucking company
3. Methodology
The study conducted an empirical analysis using quantitative research methods to assess the maturity model level in this study. illustrates the maturity model for innovative capability used in this research. Firstly the market orientation maturity model is obtained from the customer and competitor orientation. Next, the innovative capability maturity model is obtained from the market orientation, technology capability, and supplier relationship maturity model. Data is then collected through a survey distributed to respondents from truck-owning companies. The survey uses online questionnaires to collect data, which will be analysed further. The details of each step are described in the following subsections.
Figure 1. Trucking company’s innovative capability maturity model.
3.1. Data collection
The structure of the questionnaire in this study consisted of three parts. The first part contains an introduction, the purpose of the study, guarantees of confidentiality, and brief instructions for filling out the questionnaire. The second section discusses the selection of respondents (name, company name, and title) and demographic information about the companies surveyed (industry sector, number of employees, and average annual sales). Respondents were asked to submit personal data and choose several options for the first and second sections and fill in demographic data.
The third section contains factors that affect the maturity level of trucking companies’ innovative capability, such as the maturity level of technological capabilities, the maturity level of market orientation in which consist of the maturity level of customer and competitor orientation, and the last is the maturity level of the supplier relationship. The previous section has presented the definition of a maturity level to assess the innovative capabilities in trucking companies. There are two answer choices for each question (yes/no), based on whether or not it is done in the company. The questionnaire was adapted based on previous research and is listed in .
This study uses an online self-filling questionnaire. This method is efficient and has a relatively lower cost, and is easier to manage (Kothari, Citation2004) compared to other methods. Data collection uses company lists from trucking associations and other sources. An electronic and voice message was then sent inviting the trucking companies to participate in the survey. This questionnaire is answered by positions at the supervisor level and above.
3.2. Sample and data characteristics
The sampling technique ensures that the sample obtained is representative of the population so that the study can be generalised (Forza, Citation2002). The population of this research are trucking companies in Indonesia. shows, as many as 72 respondents filled out the online questionnaire, but only 52 (72 percent) of the questionnaires could be used because the company had trucks, and the rest did not (28 percent). The respondents were spanning from supervisor to top management positions. We cluster the 52 companies into those who are (1) purely trucking companies, (2) Distributors who own trucks, (3) Third-party logistics who own trucks, (4) Courier companies who own trucks, (5) Manufacturing companies that own trucks, and (6) Other than 1–5 but own trucks. illustrates the requested demographic data by industry type, the number of trucks, and annual sales.
Table 2. Sample description
3.3. Data analysis method
lists the scores for the maturity level manufacturing firms to determine their current status during subsequent analysis (Lin et al., Citation2020). After the data is collected, descriptive statistics are then conducted using Excel and classified and grouped into non-hierarchical clusters (Lin et al., Citation2020), as shown in . This cluster is divided into three groups, based on industry, the number of trucks owned, and the average annual income. Because like companies are grouped together, key issues are more obvious/easier to observe/stand out. In this way, the companies can be more assessed objectively. The data is then processed further using SPSS to determine the reliability (alpha coefficient) and validity (Pearson Correlation) of the construction used. Analysis of variance was used to verify the effects of the different dimensions. Then Pearson correlation analysis is used to investigate the factors that influence the innovative capability of trucking companies.
Table 3. The score for maturity level and stage (based on questionnaires)
4. Research analysis
4.1. Data analysis and results
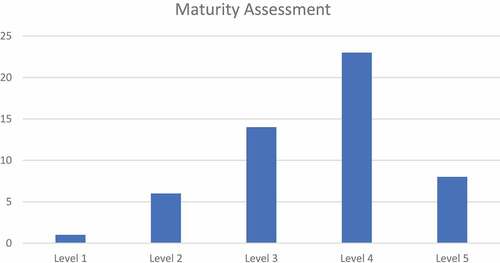
Research from 52 trucking companies showed that only one company surveyed is immature (level 1), 20 companies are partially mature (levels 2–3), and 31 companies are in the early stage (23) or later stage (8) maturity (level 4–5; ). The levelling was based on the average score of three criteria. As the average score would likely be in the form of decimals, the cut-off for level L would be L± 0.5. For example, a score between 2.5 and less than 3.5 is classified as level 3. For practical purposes, the analysis should also be done at the factor level in addition to the aggregated score that determine the maturity level.
Figure 2. Overall maturity level.
presents the results of the sample obtained (mean and standard deviation) as a whole. The study then categorises the results into three groups based on industry type, number of trucks, and annual sales. This table also describes the contribution of the maturity level of customer and competitor orientation to the maturity level of market orientation. The maturity level of market orientation, technological capability and supplier relationship to the maturity level of the trucking company’s innovative capability. In , the standard deviation shows that customer orientation shows a lower distribution when compared to competitor orientation, technological capability, and supplier relationship.
Table 4. Descriptive statistics, mean, and standard deviation
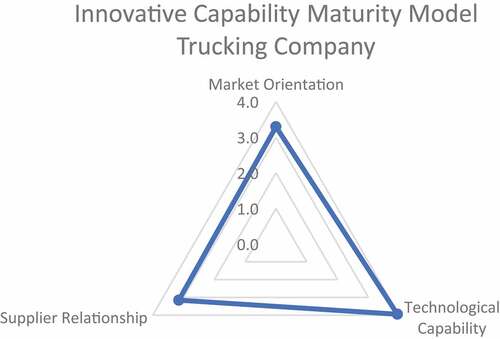
The trucking company market orientation (customer and competitor orientation) is found in the mean value in . The maturity level of customer orientation shows the highest maturity level with a value of 4.4, while for competitor orientation, the value is 2.19. From these two results, the market orientation maturity value is generated by adding and dividing by two to obtain the mean (3.29). A radar graph is then used () to illustrate the three dimensions of a trucking company’s innovative capability (market orientation, technological capability and supplier relationship). The maturity level of technological capability shows a high level of maturity with a score of 3.94, followed by market orientation 3.29, and supplier relations 3.15. The value of the trucking company’s innovative capability is obtained by adding up the three maturity components and then dividing them by three to obtain the mean (3.46)
Figure 3. Graph of maturity level of the three dimensions of innovative capability.
The Pearson correlation coefficient is in the range of −1 to 1. A person’s correlation value close to 1 indicates a strong relationship between the two variables. An increase in the absolute value of one variable will cause the other values to increase. This correlation value can be positive or negative. The analysis results in show a positive correlation between market orientation, technological capability and supplier relationship. Positively correlated variables show the same direction of movement, meaning that an increase in the value of one variable could increase in the other variable. The opposite is true for variables with a negative correlation.
Table 5. Pearson’s correlation results
classifies 52 companies into three groups and presents the cluster analysis results. Companies without trucks are excluded from our analysis (20), so the focus 52 truck-owning companies. There are seven types of companies for the group based on the industry. The first is trucking companies (18), distribution companies that own trucks (3), third-party logistics companies that own trucks (18), courier companies that own trucks (2), manufacturing companies that own trucks (5), firms in other industries that own trucks (6), and firms that do not own trucks (20). Third-party logistics companies had the highest maturity level of market orientation (3.6), while manufacturing companies had the lowest maturity level of market orientation (2.8). Courier companies and third-party logistics companies had the highest technological capability maturity (4.4 and 4.5), while manufacturing companies had the lowest technological capability maturity level (2.0). ANOVA test was performed, and the result was significant at the level 0.05, for technological capability. In addition to that based on post hoc test from the difference was significant between manufacturing companies and trucking companies (0.01 level significance) and also third-party logistic companies (0.003 level of significance). Distribution companies had the highest level of supplier relationship maturity (3.7) while manufacturing companies had the lowest supplier relationship maturity level (2.3). From the data above, it can be concluded that third-party logistics companies, courier companies and trucking companies had the highest level of maturity of innovative capability (3.7, 3.6 and 3.5) while manufacturing companies had the lowest level of maturity of innovative capability (2.3). Furthermore, based on ANOVA test performed, even there was not significance difference (0.188) for innovative capability, has shown there are significant differences at 0.1 level for manufacturing companies and third-party logistic companies.
Table 6. Cluster analysis of groups: Group list and application
Table 7. Anova: Pos Hoc tests
For the group based on the number of trucks owned, there are three categories of companies, the first is the owner of 1–10 trucks (small), the second is 10–100 units (medium), and the third is 100 units (large) and above. For the maturity level of market orientation, the three have almost the same level ranging from 3.2 for small companies, 3.4 for medium companies, and 3.3 for large companies. For the maturity level of technological capability, small companies have a lower level (3.2) while medium (4.2) and large (4.3) companies have a higher maturity level, and both are almost the same. ANOVA test was also performed, and the result was significant at the level 0.054, for technological capability. In addition, based on post hoc test from the difference was significant at 0.1 level for small and large companies (0.063 level significance). For the maturity level of the supplier relationship, the three are at almost the same level, for small companies at 3.2, medium companies at 3.0, and large companies at 3.3. Therefore, the level of maturity of small companies’ innovative capability is at level 3.2, while medium companies are at level 3.5, and large companies are at level 3.6.
For groups based on annual sales, there are three categories of companies, the first is under one billion rupiah (small), the second is between one to 25 billion rupiahs (medium), and the third is 25 billion rupiahs (large) and above. For the market orientation maturity level, small companies have the smallest market orientation maturity level of 2.5, while medium-sized companies have the highest market orientation maturity level of 3.5, and large companies 3.3. Small companies have a lower maturity level of technological capability (2.0), while medium companies have the highest level of maturity (4.2), and large companies have a technological capability maturity level of 3.9. For the maturity level of the supplier relationship, the three are at almost the same level, for small companies at 3.0, for medium companies at 3.2, and large companies at 3.1. Therefore, the maturity level of small companies’ innovative capability is at level 2.5, while medium companies are at level 3.6, and large companies are at level 3.4.
4.2. Data reliability and validity
This research used SPSS to measure the bias and distortion of the variables to ensure the data is valid and reliable. A reliability test evaluates the consistency and implementation of the measurement scale in repeated experiments. Stability describes the ability of a measure to produce the same response consistently (Hair et al., Citation2010). The measurement scale is based on the correlation between two or more indicators in one construction, also known as testing using alpha coefficients (Cronbach, Citation1951). The alpha coefficient in this study was 0.719 is above the minimum value of 0.7, indicating acceptable level of reliability (Nunnally, Citation1975).
The validity test was carried out to ensure that the research instrument was valid and feasible. Based on , it can be seen that the Pearson Correlation value of market orientation maturity level is 0.718, Pearson Correlation technology capability maturity level is 0.834, and Pearson Correlation supplier relationship maturity level is 0.849. All items of the maturity level of trucking company’s innovative capability produce a Pearson Correlation value of more than t-Table (2-Tailed) with N = 52 and a significance level of 0.01%, namely t-Table (2-Tailed) = 2.704 so that all items are considered valid.
Table 8. Validity test
5. Discussion
Trucking companies need to innovate to survive in this uncertain business environment. The degree of innovation differs from company to company, but most of them are related to digitalization. Based on the interview with a number of trucking companies, there are various form of innovation. For example, the money transfer mechanism that was very traditional in the past, now are moving into cashless. Some other companies have started investing in electric vehicles. Other offering trucks through online platform with a spot market mechanism.
Based on the findings from the research, we also offer suggestions that trucking companies can improve their innovative capabilities to a higher level (Rudnicka, Citation2017). The innovative capability is the ability of the company as a whole to be able to adapt, change and implement ideas and knowledge within the company (Wang & Ahmed, Citation2004; Shou et al., 2016; Yang, Citation2012). Trucking companies have a fairly good maturity level of innovative capability with partial maturity to maturity (3.46). Many studies have mentioned the positive relationship between innovative capability and company performance (Grawe et al., Citation2011; Ho & Chang, Citation2015; Kafetzopoulos & Psomas, Citation2015). Therefore the higher the innovative capability maturity level is also good indication higher company’s performance.
For the level of maturity per group of companies, based on the type of industry, third-party logistics companies have the highest maturity level (3.7), followed by courier companies (3.6) and trucking companies (3.5), while manufacturing companies have the lowest maturity levels (2.3). The three types of companies above serve (transport) goods belonging to third parties while manufacturing companies transport them. The development of the innovative capability in the manufacturing sector is focused more on its core business. Meanwhile, the core business is the transportation service itself to transport goods on behalf of other stakeholders.
shows that firms owning 1–10 trucks have a much lower Innovation capability (3.2) compared to firms owning 10–100 trucks (3.5) and firms owning over 100 truck (3.6) So the level of capital invested and resources available at their disposal seem to have a bearing on the capability maturity. This insight is further strengthened by the fact that also shows that firms with annual turnover of under 1 billion Rupiah have a lower capability maturity of 2.5 compared to the other two counterparts at 3.5 and 3.6.
Previous literature has emphasised the important role of market orientation in developing a company’s innovative capability (Atuahene-Gima & Ko, Citation2001; Hult et al., Citation2005; Lisboa et al., Citation2011; Ngo & O’Cass, Citation2012). This research focuses on two important market orientation components: customer and competitor orientation. The level of customer orientation is twice as big (4.40) compared to competitor orientation maturity (2.19). Customer orientation is the most important market orientation (Deshpandé et al., Citation1993). Of course, it is not surprising that trucking companies prioritise customer orientation over competitor orientation and the presence of competitors is not considered as a threat.
Suppose we look in more detail at the results of the maturity level per group of companies. Third-party logistics companies that own trucks have a higher maturity level of market orientation than other group of companies that own trucks. The manufacturing company, even they own and operate trucks for transporting their goods, do not show a strong attitude of market orientation, with a score of substantially lower, 2.8. This is somewhat understandable as they transport their own goods.
Technological capabilities accumulate over time, obtained from technology experience (Zhou & Wu, Citation2010). It allows the formation of new capabilities as the main driver (Hsieh & Tsai, Citation2007) of innovation (Zahra & George, Citation2002). Technological capabilities are the foundation of the company’s innovative capability (Eng & Okten, Citation2011). From the results obtained, the technological capability has the highest level of maturity compared to other factors (3.94). In line with previous research, trucking companies believe that technological capabilities are an important contributor to the company’s innovative capability. In recent years, one important aspect of innovative capability is obviously competencies related to digital technology. Trucking companies are required to use digital technologies to deliver better services to shippers and customers.
In more detail on the type of industry, the highest level of technological capability maturity is in courier companies (4.5) and third-party logistics companies (4.4). Technological developments in the e-commerce sector drive it. COVID-19 has also accelerated the development of technological capabilities in the industry. The manufacturing sector still occupies the lowest level (2.0) because trucks are a supporter of its main business. For company size based on units of truck owned and annual revenue, medium and large companies have a maturity level of technology capability compared to small companies. It is because larger companies have more resources to focus on developing these capabilities when compared to smaller companies.
Good relations with suppliers positively impact the creation of ideas within the company (Story et al., Citation2009). It is a company asset because it can improve company performance (Oke et al., Citation2013). Suppliers have access to technologies, processes, materials and ideas that are useful for developing the company’s innovative capabilities (Koufteros et al., Citation2005; Schoenherr & Swink, Citation2015). The maturity level of supplier relationships in trucking companies is partial maturity (3.15). This relationship with suppliers is not carried out intensely for trucking companies, unlike relationships with customers. Purchases of goods from suppliers are not carried out continually. The level of maturity of supplier relationships is highest in distribution companies (3.7). Distribution companies rely on a continuous flow of goods from their suppliers. Relationships with suppliers are carried out more intensely, so it is not surprising that the maturity level of supplier relationships is becoming more mature. It is different with manufacturing companies (2.20). On average, the size does not affect the difference in the maturity level of the supplier relationship owned by the company, this is in line with the maturity level of the innovative capability.
We have conducted a quick interview with three representatives, each from a different group of companies. We aim to obtain insights into their opinion regarding their maturity level based on the assessment that has been done. The first representative is a third-party logistic company owning more than 100 trucks; the second is trucking company owning more than 100 trucks, and the manufacturing company owns less than ten trucks. Generally, they approve the results. The greater maturity level in company one and company two is due to tight competition. Therefore they need to find a new way to remain competitive in the industry. For company three, the lower maturity level is due to trucking not being part of their core business, so they consider no need to improve their maturity level. In terms of size, larger companies (companies one and two) have more resources allocated for maturing their innovative capabilities than company three. It also indicates the result aforementioned.
6. Conclusions
In this study we develop a model and instrument to assess maturity model of innovative capability. This maturity model is designed for companies that involve in managing freight transportation via road. There has been very limited works that attempt to address innovative capabilities of trucking transport and hence our model provides significant contribution to the field. The instrument has been used to assess maturity level of 52 companies that involved in road transportation in Indonesia. The study revealed that most companies are in level 4 in the range of 1 to 5. The spread is quite wide where some companies are still in levels 1 or 2, while some other are already in level 5. This indicates that there is a wide range of innovative capabilities of trucking companies in Indonesia.
We were also able to breakdown the responses based on the types of companies. Even though generally we focus on trucking companies, but some respondents were manufacturing companies that handled transportation of their own products. Interestingly, in any aspects these companies show a substantially lower maturity level compared to companies that purely do trucking business or other service companies like distributors or third-party logistics that see transportation as a service to other companies. However, this study is based on a relatively small sample size and doing a larger scale observation is needed to arrive at a more convincing conclusion. This could be an important agenda for future studies.
There are some other avenues worth investigating in the future studies. For example, the issue of environmental sustainability that may not be put as a priority by trucking companies. But we do believe that future oriented transport companies need to put environmental sustainability as an important agenda. Future research may also explore the interrelation between maturity model and the stages of the diffusion of innovation as was originated in Beal et al. (Citation1957). It is interesting to see for example, if the early adopter typically having higher maturity level.
Disclosure statement
No potential conflict of interest was reported by the author(s).
Additional information
Funding
References
- Antunes, P., Carreira, P., & Mira da Silva, M. (2014). Towards an energy management maturity model. Energy Policy, 73, 803–22 . https://doi.org/10.1016/j.enpol.2014.06.011
- Appiah-Adu, K., & Singh, S. (1998). Customer orientation and performance: A study of SMEs. Management Decision, 36(6), 385–394. https://doi.org/10.1108/00251749810223592
- Appleby, A., & Mavin, S. (2000). Innovation not imitation: Human resource strategy and the impact on world-class status. Total Quality Management, 11(4–6), 554–561. https://doi.org/10.1080/09544120050007887
- Atuahene-Gima, K., & Ko, A. (2001). An empirical investigation of the effect of market orientation and entrepreneurship orientation alignment on product innovation. Organization Science, 12(1), 54–74. https://doi.org/10.1287/orsc.12.1.54.10121
- Aziz, N. A., & Omar, N. A. (2013). Exploring the effect of internet marketing orientation, learning orientation and market orientation on innovativeness and performance: SME (exporters) perspectives. Journal of Business Economics and Management, 14(SUPPL1), 37–41. https://doi.org/10.3846/16111699.2011.645865
- Beal, G. M., Rogers, E. M., & Bohlen, J. M. (1957). Validity of the concept of stages in the adoption process. Rural Sociology, 22(2), 166–168.
- Becker, J., Niehaves, B., Poeppelbuss, J., & Simons, A. (2010). Maturity models in is research. European Conference on Information Systems, 42, 1–12. http://aisel.aisnet.org/ecis2010/42%0Ahttp://aisel.aisnet.org/ecis2010%0Ahttp://aisel.aisnet.org/ecis2010/42
- Bell, M., & Figueiredo, P. N. (2012). Innovation capability building and learning mechanisms in latecomer firms: Recent empirical contributions and implications for research. Canadian Journal of Development Studies, 33(1), 14–40. https://doi.org/10.1080/02255189.2012.677168
- Brookes, N., & Clark, R. (2009). Using maturity models to improve project management practice. POMS 20th Annual Conference, 1–12.
- Cardozo, R., McLaughlin, K., Harmon, B., Reynolds, P., & Miller, B. (1993). Product-market choices and growth of new business. Product Innovation Management Innov Management, 10(4), 331–340. https://doi.org/10.1111/1540-5885.1040331
- Chaudhry, N. I., Aftab, I., Arif, Z., Tariq, U., & Roomi, M. A. (2019). Impact of customer-oriented strategy on financial performance with mediating role of HRM and innovation capability. Personnel Review, 48(3), 631–643. https://doi.org/10.1108/PR-02-2018-0056
- Chen, I. S. N., & Fung, P. K. O. (2013). Relationship configurations in the apparel supply chain. Journal of Business and Industrial Marketing, 28(4), 303–316. https://doi.org/10.1108/08858621311313901
- Chen, Y. C., & Wang, Y. J. (2018). Application and development of the people capability maturity model level of an organisation. Total Quality Management and Business Excellence, 29(3–4), 329–345. https://doi.org/10.1080/14783363.2016.1184568
- Conant, J. S., Mokwa, M. P., & Varadarajan, P. R. (1990). Strategic types, distinctive marketing competencies and organizational performance: a multiple measure-based study. Strategic Management Journal, 11(5), 365–383. https://doi.org/10.1080/10170660909509142
- Corsten, D., & Felde, J. (2005). Exploring the performance effects of key-supplier collaboration: An empirical investigation into Swiss buyer-supplier relationships. International Journal of Physical Distribution and Logistics Management, 35(6), 445–461. https://doi.org/10.1108/09600030510611666
- Cronbach, L. J. (1951). Coefficient alpha and the internal structure of tests. Psychometrika, 16(3), 297–334. https://doi.org/10.1007/BF02310555
- Curtis, B., Hefley, W. E., & Miller, S. (1995). Overview of the people capability maturity model. Carnegie-Mellon University Software Engineering Institute. herehttps://apps.dtic.mil/sti/pdfs/ADA301167.pdf
- Day, G. S. (2000). Managing marketing relationships. Journal of the Academy of Marketing Science, 28(1), 55–66. https://doi.org/10.1177/0092070300281003
- de Bruin, T., Rosemann, M., Freeze, R., & Kulkarni, U. (2005). Understanding the main phases of developing a maturity assessment model. ACIS 2005 Proceedings - 16th Australasian Conference on Information Systems.
- Delaney, J. T., & Huselid, M. A. (1996). The impact of human resource management practices on perceptions of organizational performance. Academy of Management Journal, 39(4), 949–969. https://doi.org/10.5465/256718
- Delbufalo, E. (2015). The influence of supply network structure on firm’s multiple innovation capabilities: A longitudinal study in the fashion industry. Management Decision, 53(10), 2457–2476. https://doi.org/10.1108/MD-07-2014-0431
- Demir, C., & Kocabaş, I. (2010). Project Management Maturity Model (PMMM) in educational organizations. Procedia - Social and Behavioral Sciences, 9, 1641–1645. https://doi.org/10.1016/j.sbspro.2010.12.379
- Deshpandé, R., Farley, J. U., & Webster, F. E. (1993). Corporate culture, customer orientation, and innovativeness in Japanese Firms: A quadrad analysis. Developing a Market Orientation, 571, 23–27. https://doi.org/10.4135/9781452231426.n4
- Eng, T. Y., & Okten, D. (2011). Exploring a dynamic framework of innovative capability: A theoretical integration of technological and marketing capabilities. Technology Analysis and Strategic Management, 23(9), 1001–1013. https://doi.org/10.1080/09537325.2011.616700
- Facchini, F., Olésków-Szłapka, J., Ranieri, L., & Urbinati, A. (2020). A maturity model for logistics 4.0: An empirical analysis and a roadmap for future research. Sustainability (Switzerland), 12(1), 1–18. https://doi.org/10.3390/SU12010086
- Ferrer, M., Santa, R., Storer, M., & Hyland, P. (2011). Competences and capabilities for innovation in supply chain relationships. International Journal of Technology Management, 56(2–4), 272–289. https://doi.org/10.1504/IJTM.2011.042987
- Fischer, J. H., Thomé, A. M. T., Scavarda, L. F., Hellingrath, B., & Martins, R. (2016). Development and application of a maturity measurement framework for supply Chain flexibility. Procedia CIRP, 41, 514–519. https://doi.org/10.1016/j.procir.2015.12.107
- Forza, C. (2002). Survey research in operations management: A process-based perspective. International Journal of Operations and Production Management, 22(2), 152–194. https://doi.org/10.1108/01443570210414310
- Fraser, P., Moultrie, J., & Gregory, M. (2002). The use of maturity models/grids as a tool in assessing product development capability. IEEE International Engineering Management Conference, 1, 244–249. https://doi.org/10.1109/iemc.2002.1038431
- Grawe, S. J., Daugherty, P. J., & Roath, A. S. (2011). Knowledge synthesis and innovative logistics processes: Enhancing operational flexibility and performance. Journal of Business Logistics, 32(1), 69–80. https://doi.org/10.1111/j.2158-1592.2011.01006.x
- Grinstein, A. (2008). The effect of market orientation and its components on innovation consequences: A meta-analysis. Journal of the Academy of Marketing Science, 36(2), 166–173. https://doi.org/10.1007/s11747-007-0053-1
- Hair, J. F., Black, W. C., Babin, B. J., & Anderson, R. E. (2010). Multivariate data analysis. In Pearson education (Seventh ed.). Prentice Hall.
- Han, J. K., Kim, N., & Srivastava, R. K. (1998). Market orientation and organizational performance: is innovation a missing link? Journal of Marketing, 62(4), 30–45. https://doi.org/10.1177/002224299806200403
- Herbsleb, J., Zubrow, D., Goldenson, D., Hayes, W., & Paulk, M. (1997). Software quality and the capability maturity model. Communications of the ACM, 40(6), 30–40. https://doi.org/10.1145/255656.255692
- Ho, L.-H., & Chang, P.-Y. (2015). Innovation capabilities, service capabilities and corporate performance in logistics services. International Journal of Organizational Innovation, 7(3), 24–33. https://doi.org/10.1163/157181895X00384
- Hortinha, P., Lages, C., & Lages, L. F. (2011). The trade-off between customer and technology orientations: impact on innovation capabilities and export performance. Journal of International Marketing, 19(3), 36–58. https://doi.org/10.1509/jimk.19.3.36
- Hsieh, M. H., & Tsai, K. H. (2007). Technological capability, social capital and the launch strategy for innovative products. Industrial Marketing Management, 36(4), 493–502. https://doi.org/10.1016/j.indmarman.2006.01.002
- Huhtala, J. P., Sihvonen, A., Frösén, J., Jaakkola, M., & Tikkanen, H. (2014). Market orientation, innovation capability and business performance: Insights from the global financial crisis. Baltic Journal of Management, 9(2), 134–152. https://doi.org/10.1108/BJM-03-2013-0044
- Hult, G. T. M., Ketchen, D. J., & Slater, S. F. (2005). Market orientation and performance: An integration of disparate approaches. Strategic Management Journal, 26(12), 1173–1181. https://doi.org/10.1002/smj.494
- Hurley, R. F., & Hult, G. T. M. (1998). Innovation, market orientation, and organizational learning: An integration and empirical examination. Journal of Marketing, 62(3), 42–54. https://doi.org/10.1177/002224299806200303
- Huselid, M. A. (1995). The impact of human resource management practices on turnover, productivity, and corporate financial performance. Academy of Management Journal, 38(3), 635–672. https://doi.org/10.5465/256741
- Jajja, M. S. S., Kannan, V. R., Brah, S. A., & Hassan, S. Z. (2017). Linkages between firm innovation strategy, suppliers, product innovation, and business performance. International Journal of Operations & Production Management, 37(8), 1054–1075. https://doi.org/10.1108/IJOPM-09-2014-0424
- Kafetzopoulos, D., & Psomas, E. (2015). The impact of innovation capability on the performance of manufacturing companies the Greek case. Journal of Manufacturing Technology Management, 26(1), 104–130. https://doi.org/10.1108/JMTM-12-2012-0117
- Keskin, H. (2006). Market orientation, learning orientation, and innovation capabilities in SMEs: An extended model. European Journal of Innovation Management, 9(4), 396–417. https://doi.org/10.1108/14601060610707849
- Kothari, C. R. (2004). Research methodology: Method and techniques (Second ed.). New Age International (P) Limited.
- Koufteros, X., Vonderembse, M., & Jayaram, J. (2005). Internal and external integration for product development: The contingency effects of uncertainty, equivocality, and platform strategy. Decision Sciences, 36(1), 97–133. https://doi.org/10.1111/j.1540-5915.2005.00067.x
- Krause, D. R., Handfield, R. B., & Tyler, B. B. (2007). The relationships between supplier development, commitment, social capital accumulation and performance improvement. Journal of Operations Management, 25(2), 528–545. https://doi.org/10.1016/j.jom.2006.05.007
- Kyläheiko, K., Jantunen, A., Puumalainen, K., Saarenketo, S., & Tuppura, A. (2011). Innovation and internationalization as growth strategies: The role of technological capabilities and appropriability. International Business Review, 20(5), 508–520. https://doi.org/10.1016/j.ibusrev.2010.09.004
- Lahrmann, G., Marx, F., Mettler, T., Winter, R., & Wortmann, F. Inductive design of maturity models: Applying the Rasch algorithm for design science research. (2011). Lecture Notes in Computer Science (Including Subseries Lecture Notes in Artificial Intelligence and Lecture Notes in Bioinformatics), 6629(2009), 176–191. https://doi.org/10.1007/978-3-642-20633-7_13 LNCS
- Lai, W. H., Lin, C. C., & Wang, T. C. (2015). Exploring the interoperability of innovation capability and corporate sustainability. Journal of Business Research, 68(4), 867–871. https://doi.org/10.1016/j.jbusres.2014.11.043
- Lawson, B., & Samson, D. A. (2001). Developing innovation capability in organisations: A dynamic capabilities approach. International Journal of Innovation Management, 5(3), 377–400. https://doi.org/10.1142/S1363919601000427
- Lee, H. L. (2002). Aligning supply chain strategies with product uncertainties. California Management Review, 44(3), 105–119. https://doi.org/10.2307/41166135
- Lefebvre, E., & Lefebvre, L.-A. (2002). innovative capabilities as determinants of export performance and behaviour: A longitudinal study of manufacturing SMEs. Innovation and Firm Performance, 281–309. https://doi.org/10.1057/9780230595880_12
- Lettice, F., Wyatt, C., & Evans, S. (2010). Buyer-supplier partnerships during product design and development in the global automotive sector: Who invests, in what and when? International Journal of Production Economics, 127(2), 309–319. https://doi.org/10.1016/j.ijpe.2009.08.007
- Lin, T. C., Wang, K. J., & Sheng, M. L. (2020). To assess smart manufacturing readiness by maturity model: A case study on Taiwan enterprises. International Journal of Computer Integrated Manufacturing, 33(1), 102–115. https://doi.org/10.1080/0951192X.2019.1699255
- Lisboa, A., Skarmeas, D., & Lages, C. (2011). Innovative capabilities: Their drivers and effects on current and future performance. Journal of Business Research, 64(11), 1157–1161. https://doi.org/10.1016/j.jbusres.2011.06.015
- Lockamy, A., & Mccormack, K. (2004). The development of a supply chain management process maturity model using the concepts of business process orientation. Supply Chain Management: An International Journal, 9(4), 272–278. https://doi.org/10.1108/13598540410550019
- Martins, E. C., & Terblanche, F. (2003). Building organisational culture that stimulates creativity and innovation. European Journal of Innovation Management, 6(1), 64–74. https://doi.org/10.1108/14601060310456337
- McKee, D. O., Varadarajan, P. R., & Pride, W. M. (1989). Strategic adaptability and firm performance: A market-contingent perspective. Journal of Marketing, 53(3), 21–35. https://doi.org/10.1177/002224298905300305
- McNaughton, R. B., Osborne, P., & Imrie, B. C. (2002). Market‐oriented value creation in service firms. European Journal of Marketing, 36(9/10), 990–1002. https://doi.org/10.1108/03090560210437299
- Mendes, P., Leal, J. E., & Thomé, A. M. T. (2016). A maturity model for demand-driven supply chains in the consumer product goods industry. International Journal of Production Economics, 179, 153–165. https://doi.org/10.1016/j.ijpe.2016.06.004
- Mukhtar Shehu, A., & Mahmood, R. (2014). An empirical analysis of market orientation and business performance relationship in the context of developing economy. International Journal of Academic Research in Business and Social Sciences, 4(9), 457–470. https://doi.org/10.6007/IJARBSS/v4-i9/1151
- Narver, J. C., & Slater, S. F. (1990). The effect of market orientation on business profitability. Journal of Marketing, 54(October), 20–35. https://doi.org/10.4135/9781452231426.n3
- Ngo, L. V., & O’Cass, A. (2012). In search of innovation and customer-related performance superiority: The role of market orientation, marketing capability, and innovation capability interactions. Journal of Product Innovation Management, 29(5), 861–877. https://doi.org/10.1111/j.1540-5885.2012.00939.x
- Nicholls-Nixon, C. L. (1995). Responding to technological change: Why some firms do and others die. Journal of High Technology Management Research, 6(1), 1–16. https://doi.org/10.1016/1047-8310(95)90003-9
- Nunnally, J. C. (1975). Psychometric Theory’ 25 years ago and now. Educational Researcher, 4(10), 7–21. https://doi.org/10.3102/0013189X004010007
- Oke, A., Prajogo, D. I., & Jayaram, J. (2013). Strengthening the innovation chain: The role of internal innovation climate and strategic relationships with supply chain partners. Journal of Supply Chain Management, 49(4), 43–58. https://doi.org/10.1111/jscm.12031
- Oleśków-Szłapka, J., & Stachowiak, A. (2018). The framework of logistics 4.0 maturity model. In International conference on intelligent systems in production engineering and maintenance (pp. 771–781). Springer, Cham.
- Paulk, M. C., Curtis, B., Chrissis, M. B., & Weber, C. V. (1993). Capability maturity model for software, version 1.1. In P. M. Jackson (Ed.), Carnegie Mellon University. Carnegie Mellon University. https://resources.sei.cmu.edu/asset_files/technicalreport/1993_005_001_16211.pdf
- Petroni, A., & Panciroli, B. (2002). Innovation as a determinant of suppliers’ roles and performances: An empirical study in the food machinery industry. European Journal of Purchasing and Supply Management, 8(3), 135–149. https://doi.org/10.1016/S0969-7012(02)00004-7
- Pöppelbuß, J., & Röglinger, M. (2011). What makes a useful maturity model? A framework of general design principles for maturity models and its demonstration in business process management. 19th European Conference on Information Systems, ECIS 2011, 28 (Summer).
- Prasad, V. K., Ramamurthy, K., & Naidu, G. M. (2001). The influence of internet–marketing integration on marketing competencies and export performance. Journal of International Marketing, 9(4), 82–110. https://doi.org/10.1509/jimk.9.4.82.19944
- Proença, D., & Borbinha, J. (2016). Maturity models for information systems - A state of the art. Procedia Computer Science, 100(2), 1042–1049. https://doi.org/10.1016/j.procs.2016.09.279
- Quintana-García, C., & Benavides-Velasco, C. A. (2008). Innovative competence, exploration and exploitation: The influence of technological diversification. Research Policy, 37(3), 492–507. https://doi.org/10.1016/j.respol.2007.12.002
- Radosevic, S., & Yoruk, E. (2016). Why do we need a theory and metrics of technology upgrading? Asian Journal of Technology Innovation, 24(November), 8–32. https://doi.org/10.1080/19761597.2016.1207415
- Röglinger, M., Pöppelbuß, J., & Becker, J. (2012). Maturity models in business process management. Business Process Management Journal, 18(2), 328–346. https://doi.org/10.1108/14637151211225225
- Rudnicka, A. (2017). Sustainable supply chain maturity model. Research in Logistics and Production, 7(3), 201–209. https://doi.org/10.21008/j.2083-4950.2017.7.3.2
- Ruekert, R. W. (1992). Developing a market orientation: An organizational strategy perspective. International Journal of Research in Marketing, 9(3), 225–245. https://doi.org/10.1016/0167-8116(92)90019-H
- Schoenherr, T., & Swink, M. (2015). The roles of supply chain intelligence and adaptability in new product launch success. Decision Sciences, 46(5), 901–936. https://doi.org/10.1111/deci.12163
- Shou, Y., Shao, J., & Chen, A. Relational resources and performance of Chinese third-party logistics providers: The mediating role of innovation capability. (2017). International Journal of Physical Distribution & Logistics Management, 47(9), 864–883. Permanent. https://doi.org/10.1108/IJPDLM-09-2016-0271
- Slater, S. F., Mohr, J. J., & Sengupta, S. (2014). Radical product innovation capability: Literature review, synthesis, and illustrative research propositions. Journal of Product Innovation Management, 31(3), 552–566. https://doi.org/10.1111/jpim.12113
- Story, V., Hart, S., & O’Malley, L. (2009). Relational resources and competences for radical product innovation. Journal of Marketing Management, 25(5–6), 461–481. https://doi.org/10.1362/026725709X461803
- Strandhagen, J. O., Vallandingham, L. R., Fragapane, G., Strandhagen, J. W., Stangeland, A. B. H., & Sharma, N. (2017). Logistics 4.0 and emerging sustainable business models. Advances in Manufacturing, 5(4), 359–369. https://doi.org/10.1007/s40436-017-0198-1
- Sulistyo, H., & Siyamtinah. (2016). Innovation capability of SMEs through entrepreneurship, marketing capability, relational capital and empowerment. Asia Pacific Management Review, 21(4), 196–203. https://doi.org/10.1016/j.apmrv.2016.02.002
- Swink, M. (2006). Building collaborative innovation capability. Research Technology Management, 49(2), 37–47. https://doi.org/10.1080/08956308.2006.11657367
- Szalavetz, A. (2019). Industry 4.0 and capability development in manufacturing subsidiaries. Technological Forecasting and Social Change, 145(July 2017), 384–395. https://doi.org/10.1016/j.techfore.2018.06.027
- Tan, K. H., Zhan, Y. Z., Ji, G., Ye, F., & Chang, C. (2015). Harvesting big data to enhance supply chain innovation capabilities: An analytic infrastructure based on deduction graph. International Journal of Production Economics, 165, 223–233. https://doi.org/10.1016/j.ijpe.2014.12.034
- Tsai, J. M., & Hung, S. W. (2016). Supply chain relationship quality and performance in technological turbulence: An artificial neural network approach. International Journal of Production Research, 54(9), 2757–2770. https://doi.org/10.1080/00207543.2016.1140919
- Tubis, A. A., & Werbińska-Wojciechowska, S. (2021). Risk management maturity model for logistic processes. Sustainability (Switzerland), 13(2), 1–19. https://doi.org/10.3390/su13020659
- Vakaslahti, P. (1997). Process improvement frameworks - a small case study with people capability maturity model. Software Process: Improvement and Practice, 3(4), 225–234.
- Wademan, M. R., Spuches, C. M., & Doughty, P. L. (2008). The people capability maturity model. Performance Improvement Quarterly, 20(1), 97–123. https://doi.org/10.1111/j.1937-8327.2007.tb00434.x
- Wang, C. L., & Ahmed, P. K. (2004). The development and validation of the organisational innovativeness construct using confirmatory factor analysis Content Indicators: Research Implications** Practice Implications** Originality* Readability**. European Journal of Innovation Management, 7(4), 303–313. https://doi.org/10.1108/14601060410565056
- Wang, M., Asian, S., Wood, L. C., & Wang, B. (2020). Logistics innovation capability and its impacts on the supply chain risks in the Industry 4.0 era. Modern Supply Chain Research and Applications, 2(2), 83–98. https://doi.org/10.1108/MSCRA-07-2019-0015
- Wei, C., Asian, S., Ertek, G., & Hu, Z. H. (2018). Location-based pricing and channel selection in a supply chain: A case study from the food retail industry. Annals of Operations Research, 291(1–2), 1–26. https://doi.org/10.1007/s10479-018-3040-7
- Wibowo, M. A., & Waluyo, R. (2015). Knowledge management maturity in construction companies. Procedia Engineering, 125, 89–94. https://doi.org/10.1016/j.proeng.2015.11.014
- Yang, -C.-C. (2012). Assessing the moderating effect of innovation capability on the relationship between logistics service capability and firm performance for ocean freight forwarders. International Journal of Logistics Research and Applications, 15(1), 53–69. https://doi.org/10.1080/13675567.2012.669469
- Zahra, S. A., & George, G. (2002). Absorbtive capacity: A review, reconceptualization, and extension. Academy of Management Review, 27(2), 185–203. https://doi.org/10.5465/amr.2002.6587995
- Zehir, C., Köle, M., & Yıldız, H. (2015). The mediating role of innovation capability on market orientation and export performance: An implementation on SMEs in Turkey. Procedia - Social and Behavioral Sciences, 207, 700–708. https://doi.org/10.1016/j.sbspro.2015.10.141
- Zhang, J., Li, H., & Wang, S. H. M. (2017). Analysis and potential application of the maturity of growth management in the developing construction industry of a province of china: A case study. Sustainability (Switzerland), 9(1), 1–36. https://doi.org/10.3390/su9010143
- Zhou, K. Z., & Wu, F. (2010). Technological capability, strategic flexibility, and product innovation. Strategic Management Journal, 31(5), 547–561. https://doi.org/10.1002/smj