
 ?Mathematical formulae have been encoded as MathML and are displayed in this HTML version using MathJax in order to improve their display. Uncheck the box to turn MathJax off. This feature requires Javascript. Click on a formula to zoom.
Abstract
Abstract: Breast cancer is the major public health problem throughout the world and it results in serious physical damages and death. This work proposes the use of joint model to study breast cancer in patients of Ayder Hospital. The primary motivation is to contribute to the understanding of the tumor cell progression of breast cancer, within Ayder Hospital, using a joint model that takes into account a possible existence of a serial correlation structure within a same subject observations from September 2015 till December 2018. The general aim of this study was to investigate the risk of longitudinal change in tumor cell level on time to death due to breast cancer among breast cancer patients. Hospital-based retrospective cohort study was conducted among breast cancer patients. A joint model of longitudinal and time to death model was used to determine the risk of longitudinal change in tumor cell level on time to death due to breast cancer patients. These were used by using JM package in R version. Results from joint models, showed that the longitudinal Tumor cell progression was signicantly associated with the survival probability of these patients(estimated association parameter(ɑ) in the joint model is 0.84 with corresponding (95% CI: 2.28,2.37). A comparison between parameter estimates obtained in this joint model and independent survival and longitudinal analysis lead us to conclude that independent analysis brings up bias parameter estimates. There is a strong association between the progression change in log(TCL) and risk of mortality due to breast cancer.
PUBLIC INTEREST STATEMENT
This study was about Breast cancer in Ayder referral hospital _ Ethiopia. Breast cancer destroys the lives of many young individuals in developing countries. As it is known that the main predictive factors for Breast cancer patients are more health variables for this disease, data about its pathophysiological variables are important for interpretation in disease. The study presents data of the normal cohort of the Ayder, Registry. In many cases, due to a lack of awareness for women from health workers practices, these diseases claim lots of lives of the community who should not have otherwise died. With regular research and dissemination, among other interventions, it is very possible to contain these diseases. More researches are still encouraged in this area and also in another hospital.
1. Background
Cancer is a group of diseases that causes by the uncontrolled growth and spread of abnormal cells anywhere in the body, if the spread is not controlled, it can result in death. Most types of cancer cells eventually from a lump or mass called a tumor, and are named after the part of the body where the tumor originates (Diabate et al., Citation2018).
Breast cancer is a type of malignant tumor which it starts in the cells of the breast tissue that is made up of glands for milk production, called lobules, and the ducts that connect the lobules to the nipple. the majority of breast cancer cases are classified as either invasive or noninvasive. The invasive type of breast cancer is distributed in the whole body; but not the noninvasive (Abay et al., Citation2018). Cancer constitutes enormous burdens in more and less economically developed countries. Studies also suggested that over the years, the burden has shifted to less developed countries, which currently account for about 57% of cases and 65% of cancer deaths worldwide (Torre et al., Citation2015).
Breast cancer is the most commonly diagnosed cancer and the second leading cause of cancer death among African women. In Africa from 92,600 cases, 50,000 deaths in 2008 (Jemal et al., Citation2012). In sub-Saharan Africa, breast cancer is one of the non-communicable diseases, and the most commonly diagnosed cancer in women (Brinton et al., Citation2014). It is estimated that around 10,000 Ethiopian women and men have breast cancer with thousands of more cases unreported as women living in rural areas often seek treatment from traditional healers before seeking help from the government health system (Lemlem et al., Citation2013).
The average age of diagnosis of breast cancers among African women tends to be young, with estimates that a majority of cancers develop among women 50 years or younger; a considerably younger age than seen in Caucasian populations (Sighoko et al., Citation2013). Genetic or environmental factors or interplay of the two may be additional factors involved (Brinton et al., Citation2014). Age has significant effect on women breast cancer patients and it indicated that 1.35 times (95% CI;1.12, 2.22) more likely died in ages 65 years and older
Educational status and marital status are prognostic factors for mortality of women with breast cancer (Lan et al., Citation2013). A study conducted from Braga’s hospital diagnosed with a malignant tumor by using linear-mixed model shows that tumor stage III and IV have an increasing of the tumor cell values as compared to tumor stage 0, I, II (Borges et al., Citation2015). Covariates such as time, age, tumor stage and tumor size have a positive significant effect on the linear mean progression of tumor cell level. On the other hand, Tumor stage (III or IV versus 0 or I or II) have a significant effect on patients’ survival. Patients with Tumor stage III or IV were 3.52 times more likely to die than patients with Tumor stage 0 or I or II (Borges et al., Citation2015). Tumor size, lymph node metastasis status, and tumor extension had significant effect on breast cancer survival (Desantis et al., Citation2013). Stage and pathology type had significant effect on breast cancer survival (Kantelhardt et al., Citation2014).
High proportion of breast cancer morbidity and mortality was observed in age category of 15 years of age and above in both men and women in Tigray, Northern Ethiopia. Overall breast cancer mortality was 2.3% during the study period (Ajemu et al., Citation2019). Translating Raman spectroscopy technology by using the RESpect probe as a potential point-of-care screening instrument has the potential to change the paradigm of screening for cancer as an initial step to determine when a definitive tissue biopsy would be necessary (Agsalda-Garcia et al., Citation2019). The profile of a cancer patient includes summarization and visualization of the results of WES and RNAseq analysis (specific variants and significantly expressed genes, respectively) and the clinical profile, integration/comparison of these results and a prediction regarding the disease trajectory (Kosvyra et al., Citation2019).
Joint models reduce bias in the estimates of the overall treatment effect, that is, the treatment effect on survival and the longitudinal marker (J. G. Ibrahim et al., Citation2010). An excellent general review article on joint modeling of longitudinal and survival data is given in Tsiatis and Davidian (Tsiatis & Davidian, Citation2004). JG Ibrahim et al. (Citation2001) also give an overview of joint modeling methods in their book. Joint models for longitudinal and survival data in which the survival component of the model is a cure rate model are also useful in cancer research. Law et al. (Citation2002), Brown (Citation2003) consider such models for cancer clinical trials.
Even though the number of people living with breast cancer is increasing from year to year; it has emerged as one of the rapidly increasing non-communicable disease and a major public health challenge in developing countries like Ethiopia (Kantelhardt et al., Citation2014) with a consequence of Chronicity, disability, and death. Therefore, we formulate a method that can estimate the effect of baseline covariates on Tumor cell level and time to death jointly for breast cancer patients and its complication using suggested risk factors in literature, mainly by including Socio-demographic variables (Age, Gender, Educational status, Marital status, Residence, and Alcohol drinking) and Clinical factors (Treatment used, Pathology type, stage, Baseline Tumor cell count, stage of metastatic, Baseline tumor size, Time/month).To find the estimate, we want to use a joint model of longitudinal and time to death statistical models to determine the risk of longitudinal change in tumor cell level on time to death due to breast cancer among breast cancer patients by using JM package in R version.
The general aim of this study was to investigate the risk of longitudinal change in tumor cell level on time to death due to breast cancer among breast cancer patients from September 2015 till December 2018 at Ayder Comprehensive Specialized Hospital. Specifically 1) To estimate the effect of baseline covariates on tumor cell level and time to death jointly 2) To observe the association between tumor cell level and time to death due to breast cancer among breast cancer patients 3) To demonstrate the advantage of joint model analysis techniques over separate survival and longitudinal analysis to the data.
1.1. Significance of the study
Any concerned legal body may use the output of the research to allocate proper human and material resources for breast cancer health care institutions. On the other hand, health care institution could provide fast and effective services for those women with high-risk factors of breast cancer. This research increases the education and awareness for individual, society, the government and any legal body about the risk factor of women with breast cancer and their life expectancy.
2. Methodology
2.1. Study area and period
The study was conducted at Ayder comprehensive specialized hospital from September 2015 till December 2018. Tigray region, Northern part of Ethiopia.
Tigray region has 18 public hospitals and 170 health centers with a total population of 4,316,988.
2.2. Data source
Source of data for this study was the patient’s chart from the data record office at comprehensive specialized hospital. The patients ‘chart was used to extract the necessary information from different BC recording formats.
2.3. Inclusion and exclusion criteria
2.3.1. Inclusion criteria
The study includes all BC patients and started Anti-cancer treatment since September 2015 and have at least two follow up until December 2018in ACSH.
2.3.2. Exclusion criteria
This study excludes those patients who had incomplete variable registration cards, a person who died by other accidents, and those patients who started anti-cancer treatment from other healthcare institutions.
2.4. Study design
A facility-based retrospective cohort study design was conduct in ACSH. The study was focused on investigating the determinant factors that affect time to death among breast cancer patients with joint modeling of longitudinal change in tumor cell level at ACSH.
2.5. Study population
The study population consists of all BC patients who were under follow up and started the anti-cancer treatment and have at least two follow up until December 2018. From the total-registered BC patients at the hospital, only 186 of them were included in the study.
2.6. Method of data collection
The data were collected from patient charts based on those variables to be considered in this study. Both the longitudinal and survival data were extracted from the patient’s chart which contains demographic and clinical variables of BC patients under treatment follow-up.
2.7. Operational definition
Censoring: When we say Observations are called censored if the information about their survival time is incomplete.
Survival time: the period that a patient Stays in life after starting the anti-cancer treatment.
Time: the period which patients visiting to the hospital during the follow up every 3 months.
Minimum follow-up time: the period that a patient who had two longitudinal measurements after started the anti-cancer treatment.
2.8. Study variables
Outcome variables:
Survival case
The main outcome variable for survival data analysis is time to death due to breast canceror censored (in a month).
Longitudinal case
The main outcome variable for longitudinal data analysis is tumor cell level measured in ng/mL every 3 month.
Joint case
In this case, the two outcome variables are longitudinal change in tumor cell level and time to death due to breast cancer or censored (in month) among breast cancer patients.
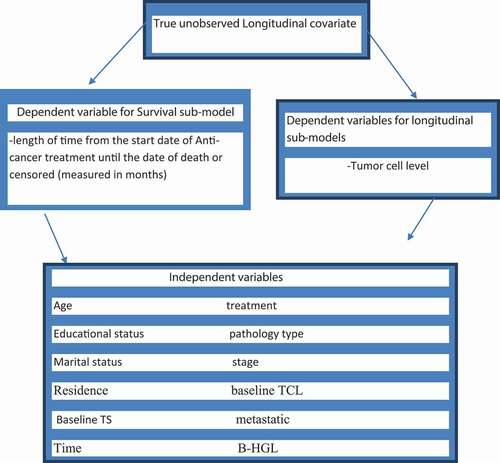
Figure 1. Schematic/Diagrammatic/representation of joint model for Breast Cancer patients
2.9. Independent variables
Several predictors were considering in this study for both survival and longitudinal cases.
2.10. Data processing and analysis
The analysis consists of exploratory data analysis and three different models namely; a linear mixed model for the longitudinal data, the Cox proportional-hazards model for the time to-death data, and a joint modeling of them altogether. The data were analyzed by using STATA12 to presents the categorical descriptive statistics, R version 3.6.1 to analyze the Cox, LMM models including the graphics. A joint model of longitudinal and time to death model was used to determine the risk of longitudinal change in tumor cell level on time to death due to breast cancer among breast cancer patients by using JM package in R version 3.6.1.
2.11. Data exploration
Exploratory data analysis (EDA) was conducted to investigate various associations, structures, and patterns exhibited in the data set. This consists of obtaining the summary statistics, individual profile plots, mean structure, correlation structure, and variance structure plots were obtained to gain some insights into the data. Since our data are unbalanced and had not equal observation time we had used smoothing techniques that highlight the typical response as a function of an explanatory variable without reliance on specific parametric models.
2.12. Statistical models
We have used Surival sub models for length of time from the start date of Anti-cancer treatment until the date of death or censored (measured in months), longitudinal sub-models for tumor cell level and Joint Surival_ longitudinal for true-unobserved Longitudinal covariate.
2.13. Data quality management
The supervisor & principal investigator had performed immediate supervision on a daily basis, & every activity of questionnaire was checked for completeness & consistency.
3. Results
3.1. Descriptive statistics
The descriptive statistics for categorical variables in described in and as. A total of 186 breast cancer patients were included in this study. Out of these, 22 (11.83%) were dead. And also,119 (64%) patients their residence in rural. Among 186 breast cancer patients, 47(97.92%), 42(97.67%), 53(82.81%), and 22(70.97%) were censored for them in stages stage-1, stage-2, stage-3, and stage-4, respectively. When we consider based on death for educational status of the patients, 17(18.09%) of patients are illiterate, 3(6.38%) of them are primary educated,1(14.29%) of them are secondary educated and 1(2.63%) are tertiary educated. Similarly, when we consider the covariate type of treatments, we observe that 121(65.1%) of the patient uses surgery treatment and 33(17.7%) chemotherapy whereas the remaining used both surgery and chemotherapy treatment. When we take the pathology type of BC patients, 94(50.5%) of breast cancer patients are ductal carcinoma in-situ 71 (38.2%) lobular carcinoma in-situ &8(4.3%) were ductal invasive carcinoma. But the rest of them were lobular invasive carcinoma.
Table 1. Summary statistics of socio-demographic variables for breast cancer patients
Table 2. Summary statistics of clinical variables for breast cancer patients
From the following we can conclude that the median age, B tumor cell, B tumor size & B_HGL of BC patients were given as 47,246,12 &12.8, respectively. and also, the median survival time of BC patient was 34.50 months
Table 3. Summary statistics for Continuous Variables
3.2. Separate analysis of survival data
3.2.1. Kaplan-Meier estimates and log-rank tests
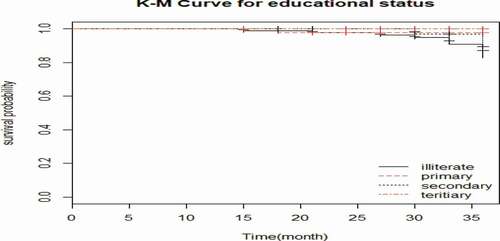
We compared the survival time of patients by using Kaplan Meier and log-rank test. When we compared by using educational status, the patient whose educational status was illiterate category had shortest survival probability than primary, secondary, and tertiary categories.
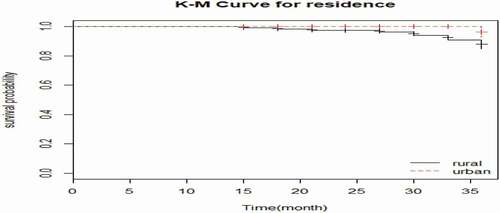
The survival probability of the BC patients who came from urban is longer than the patients who came from rural areas.
Similarly, BC patients who used the treatment both surgery & chemotherapy has smallest survival probability than the patients, who used the treatment surgery and chemotherapy. The BC patients whose pathology type was LCIS have longest survival probability than the patients who were DCIS, DIC, and LIC. The patients whose stage was stage-4 has smallest survival probability than the patients, whose stage was stage-1, stage-2, and stage-3.
Based on results of long-rank test, Educational Status, Treatment, Pathology type, and Residencewere statistically significant differences in the risk of mortality among BC patients at 25% level of significance. However, there is no significant difference in the risk of mortality between categories of Marital Status, Stage and metastatic at 25% level of significance. Because this Table was important for selection of candidate variables to pass for multivariate analysis.
Table 4. Log rank test for categorical independent variables
Based on variable Age, B tumor size & B tumor cell are statistically significant differences on Univariate analysis of Cox regression model at 25% level of significance. This helps for selection of variables in the final cox regression model.
Table 5. Univariate analysis of Cox regression model for continuous variables
3.3. Variable selection and Cox PH assumption
To determine the variables to be included in the multivariable Cox survival model we used variables whose p-value <0.25 for and on the above. Educational status, Age, B tumor size, B tumor cell, pathology type, treatment, and residence were the candidate variables in the multivariate cox regression model. However, marital status, stage, metastatic& B-HGL were not included in the multivariate cox regression model.
The proportional-hazards assumption asserts that the hazard ratios are constant overtime. That means the risk of failure must be the same no matter how long subjects have been followed. In order to test this assumption, GLOBAL test was used. The result of the GLOBAL test is displayed on . From the output, it is clear to see that the p-value of GLOBAL is insignificant. This indicates that the PH assumption is not violated. Therefore, we can assume the proportionality assumption is met.
Table 6. Proportional hazard model assumption
3.3.1. Cox proportional hazards model
After checking the assumption of proportional hazard, the survival data were analyzed based on Cox proportional hazard model. The results are presented below. From the result of multivariable analysis presented in show that the estimated AHR, 95% CI, and p-value of the covariates in the final cox regression model for age, educational status, residence, Baseline Tumor size & Pathology type (LIC) were found to be statistically significant effect at 5% level of significance on risk of mortality due to breast cancer. The remaining variables which were found to be non-significant at 5% of significance level in the multivariable analysis of the final cox regression model.
Table 7. Shows the Cox proportional hazards model for the selected variables
3.4. Separate analysis of longitudinal data
The Q-Q plots was used to check the normality of the longitudinal measures of tumor cell in ng/ml. represents that the Q-Q plot for tumor cell measures of original and logarithm transformed data. The normal quintile-quintile plot indicates that the log tumor cell level is normally distributed since the line concentrates around the normal line and is an approximately straight line through the origin. Thus, the analysis of this study was used the logarithm transformed of tumor cell-level data.
Figure 2. A flow chart for research methodology
3.5. Exploratory Data Analysis (EDA)
Exploratory data analysis was conducted to investigate various associations, structures and patterns exhibited in the data set. In addition, the individual profile plots, mean structure plots and variance structure plots were obtained to gain some insights of the data (Verbeke and Molenberghs, 2009).
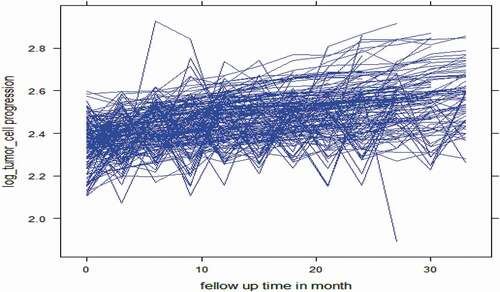
visualizes the pattern change of the overall individual plots log tumor cell measurements of patients over time. It demonstrates the variability (within and between patients) in log tumor cell measurements of breast cancer patients. Since the measurements were not equally spaced across the different subjects. It shows that there is large variability between log tumor cell of patients that their measure is too extreme in some extent and deviated through time. This indicates that there is variability in tumor cells with in & between BC patients in our LMM.
Figure 3. Q-Q plot of the tumor cell measurements and log tumor cell measurements over time
Figure 4. Individual Profile Plot for log tumor cell
3.5.1. Exploring the mean structure
We explore the mean plot of log tumor cell over time to describe the longitudinal change in log tumor cell level of breast cancer patients. figure revealed that there seems slight increase in average of log tumor cell and whereas
3.5.2. Exploring the variance structure
Similarly, assures that there was increase in the mean of log tumor cell-expecting constant increase at follow-up time. The line plot of log tumor cell over time is used to observe the variability of the data. Indicated that there is log tumor cell variability at the first visit than at visit-2. The log tumor cell variability increases slightly from visit-3 to visit-4 and decreases very fast from visit-4to 5, whereas slightly increases to visit-6 and slightly decreases to visit-7. Then, the pattern shows that it increases fastly except decreases for the last follow up time .
Figure 5. Exploring the mean structure plot
Figure 6. Exploring the variance structure plot
3.6. Variance-covariance structure
below indicates that unstructured variance-covariance has smaller AIC(−3633.268)& BIC (−3133.898) value which is to mean that it was better in explaining the model under study. Therefore, unstructured variance covariance was used in identifying the correlation structure.
Table 8. Variance-covariance structure
3.7. Linear mixed model
After exploring, the data examine whether the assumption of heterogeneous within-subject variance for the log tumor cell is supported and also identify the random effects (random intercepts, random slope, and random intercept random slope) to be included in the model.
Here from the following three model examine the great reduction in the AIC of RI RS for the model incorporating subject-specific variances is an evident that subject-specific log tumor cell variances must be considered in the analysis. Also, the random effect of table tells us there is subject-specific variation. Hence, it supports the assumption of heterogeneous variance for the repeated log tumor cell measurements.
3.8. Univariate analysis of longitudinal data
From the result of the univariate analysis of linear-mixed models, Time, Age, residence, educational level, baseline Tumor cell level, pathology type, stage, metastatic, and treatment are important factors that can affect Log (TCL) of BC patients and should be included in the multivariable analysis . However, B-HGL, baseline Tumor size, and marital status of the disease were not statistically significant for Log (TCL) at 25% level of significance. Therefore, these variables are not included in the multivariable analysis of LMM.
3.9. Multi-variate analysis of longitudinal data
After made a transformation of the response variable tumor cell level, the most important variables were selected using purpose full variable selection method. The variables which were significant in the univariate analysis at 25% level of significance is all included in the multivariable analysis for the response variable of log (TCL). Therefore, from the result of multivariable analysis () age, educational status, stage-3, stage-4, baseline Tumor cell level, time*age, time*stage-3 and time*stage-4 were statistically significant factors that affect change in log (TCL) of BC patients. But, the remaining covariates were no statistically significant at 5% level of significance .
Table 9. Comparison of random intercept (RI), random slope (RS), and random intercept random slope model (RI RS) in fixed effect
Table 10. Comparison of RI, RS, and RI RS in random effect
Table 11. The result of multivariable analysis using linear-mixed model on the response variable tumor cell level
3.10. Data analysis for joint longitudinal _ Survival analysis
The result of the joint model of longitudinal change of log Tumor cell level and time to death () shows that age, educational status, baseline Tumor cell level, stage-3, stage-4, Time*age, Time*stage-3 and Time*stage-4 were significant factors of log (Tumor cell level) and age, educational status, pathology (DIC), pathology (LIC)and Residence were significant factors that affect the mortality rate of BC patients. The association of longitudinal change in log Tumor cell level and the mortality rate was significant, and this shows that there is a strong positive relationship (Association (HR) = 2.321 with 95% CI (2.26,3.091), p-value = <0.0001) between the two sub models.It indicated that as the number of tumor cells increases the mortality rate also increases.
Table 12. Joint modeling of longitudinal and survival data analysis
3.11. Interpretation of joint model
From the result of separate and joint models, the joint models had narrow confidence interval as compared with the separate models. This indicates that the joint model is more precise than the separate models. Also, the statistical significance of the association parameter is evidence that the joint model is better than the separate models (Borges et al., Citation2015).The estimates of the parameters of the separate and joint models are not identical. The estimates of the association parameters in the joint models are significantly different from zero, providing strong evidence of association between the two sub-models for the joint model. The estimate of the association parameter due to trend of log Tumor cell level is positive (HR = 2.32) with 95% CI (2.28,2.37), p-value = <0.0001), which indicates that the log Tumor cell level is positively associated with the hazard of death of BC patients on follow up anti-cancer treatment. This implies that an increase of the log Tumor cell level in BC patients on follow-up treatment significantly increases the risk of death of those BC patients. Hence, the joint model of longitudinal and time to death model is better.
3.12. Discussion
We had one longitudinal and one survival sub-models. The fitted models were expressed as follows.
Longitudinal sub-model of Tumor cell:
Survival sub model:
Where α measures the effect of in the survival process.
Baseline age had a significant positive association with Tumor cell level (Borges et al., Citation2015). Similarly, the average of the log TCL increases as the age patient increases. From the result of longitudinal sub-model of log(TCL), as the baseline age of patients increases by 1 year the average log (TCL) also increases by 1.012 (p-value < 0.031) by adjusting other variables. The progression changes in log tumor cell level were decreased by 5%,4% and 7% for Female BC patients whose educational status was primary, secondary, and tertiary, respectively, as compared to whose educational status was illiterate by controlling other independent variables.
Clinical stage has a significant effect on the progression change of log TCL of breast cancer patients such that the more advanced stage is a more aggressive of log tumor cell level. The progression changes in log tumor level for stage III and stage IV patients had increased by 1.54 and 2.1 as compared to stage I patients and this difference is statistically significant since the 95% confidence interval did not include zero by controlling the other variables constant. This indicates that the latter stage at diagnosis is associated with the higher mean change of log tumor cell level. Such finding was similar to the study conducted from south Africa by (Dickens et al., Citation2014).And also another studies were conducted by (Borges et al., Citation2015) and (Borges et al., Citation2015) show that the late stage at diagnosis contributes to increase in the value of log TCL.
Baseline tumor cell level has been found to have a significant impact on the progression change of log tumor cell level. The progression change of log tumor cell level has increased by 1.11 when baseline tumor cell level is increased by one unit by controlling other independent variables. The interaction effect stage by time had a significant progression change on patients’ log tumor cell level. That is patients with stage III by visit time and stage IV by time interaction decreased the progression change of log tumor cell by 33% and 43%, respectively, as compared to patients with stage I by time interaction. Age by time interaction have a significant progression change on log TCL such that increasing the age by a visit time interaction had a decreasing progression change about 0.6%by controlling the other covariates.
Baseline age had a significant positive association with the hazard of death (Rezaianzadeh et al., 2009). Our finding also indicates that mortality rate of breast cancer patient increases 1.09 times when age increased by 1 year by controlling other independent variables. The other significantly important variable for the survival rate of the patient is educational status. The hazard rate of patient whose educational status primary, secondary&tertiaryeducation was decreased by 93.6, 91.7, and 97.2%, respectively, when we compared with those patients, whose educational status was illiterate. Similarly, this result agreed with the research from Vietnam on Survival probability and prognostic factors for breast cancer by (Lan et al., Citation2013).
In this study, we found that pathology type has positive association with the risk of mortality, the Invasive pathology type at diagnosis is associated with higher risk of mortality than those in-situ. The hazard rate of patients who had pathology DIC and pathology LIC were 4.01and 7.4 times more than those patients who had pathology DCIS, respectively. Residence is an important predictor for the survival time of breast cancer patients. The mortality rate of breast cancer patient whose residence was from rural side had shorter probability of surviving as compared to those patients from urban side. The hazard rate of patients whose residence was from urban is reduced by 63.9% than those patients from rural side. which shows that in Tigray regional state breast cancer patients were highly affected than their urban counterparts; this survival difference is because they reside further from treatment centers, they presented at later stages and were less compliant with treatment. This result is similar to the study conducted from South Africa by (Dickens et al., Citation2014).
Joint models for longitudinal and survival data are particularly relevant to breat cancer and observational studies in which longitudinal biomarkers (eg, circulating tumor cells, immune response to a vaccine, and quality-of-life measurements) may be highly associated with time to event . This result is similar to the study conducted at the University of North Carolina by J. G. Ibrahim et al. (Citation2010) and study conducted from portugal by Borges et al. (Citation2015).This research also shows that there is strong positive association between the progression change in log(TCL) and risk of mortality due to breast cancer. In particular, a unit increase in the value of log (TCL) corresponding to exp (0.84) = 2.32-fold increase (95% CI: (2.28, 2.37)) in the risk for death at the same time point.
4. Conclusion
The result indicates that there is strong positive association between log(TCL) and survival time of BC patients. According to our finding, Age, educational status, pathology(DIC), pathology(LIC) and Urban were important baseline covariates that have a significant effect on time to death due to breast cancer among breast cancer patients. On the other hand, Age, educational status, base line Tumor cell level, stage-3, stage-4, time*age, Time*stage-3 and Time*stage-4 were important baseline covariates which have a significant association with progression change of TCL.
From our finding, we concluded that the relationship between log (tumor cell level) and the hazard for death was positively significant. Thus, a patient with higher tumor trend is less likely to survive. The results of both the separate and joint analyses are consistent. However, the use of a joint analysis compared to independent models adjusted for the correlation between the responses, which indicates that more adequate and efficient inferences can be made using joint model estimates. This means that joint modeling can benefit for the analyses of correlated data and an assumption of association between the two processes in a joint model of breast cancer data is necessary.
Abbreviations
ACSH: Ayder Comprehensive Specialized Hospital; AIC: Akaike Information Criterion;BC:Breast Cancer;BIC:Bayesian Information Criterion; B-HGL:Baseline hemoglobin level;CI: Confidence interval;DCIS: Ductal carcinoma in-situ; DIC: Ductal invasive carcinoma; HMIS: health management information system;AHR:Adjusted hazard Ratio; LCIS: Lobular carcinoma in-situ; LIC: Lobular invasive carcinoma; LMM:Linear Mixed Model; PH:Proportional Hazard; TCL:Tumor cell level; TS:Tumor size;WHO: World Health Organization.
Ethical considerations
All procedures performed in studies involving human participants were in accordance with the ethical standards of University of Gondar institution and the University research committee declarations with comparable ethical standards for confidentiality.
Competing interests
The authors declare they have no competing interests.
Acknowledgements
We wish to extend our thanks for all individuals involved in this study from
Data availability statement
The datasets analyzed during the current study were available from the corresponding author on reasonable request.
Additional information
Funding
Notes on contributors

Endeshaw Assefa Derso
The main resarch topic of our group is Breast cancer, a major public health problem in the developing countries. We investigate risk factors and pathophysiological mechanisms, which cause or are associated with Breast cancer. Additionally, we work on improving the present Breast cancer diagnostics. The basis for all these research work is Joint modeling of survival and longitudinal analysis of Breast cancer. Thus, we perform studies intending to investigate joint modelong of survival_ longtitudinal analyiss.
References
- Abay, M., Tuke, G., Zewdie, E., Abraha, T. H., Grum, T., & Brhane, E. (2018). Breast self-examination practice and associated factors among women aged 20–70 years attending public health institutions of Adwa town, North Ethiopia. BMC Research Notes, 11(1), 62. https://doi.org/https://doi.org/10.1186/s13104-018-3731-9
- Agsalda-Garcia, M., Shieh, T., Souza, R., Kamada, N., Loi, N., Oda, R., Acosta-Maeda, T., Choi, S. Y., Lim, E., Misra, A., & Shiramizu, B. (2019). Raman-Enhanced Spectroscopy (RESpect) Probe for Childhood Non-Hodgkin Lymphoma. Scimedicine Journal. https://doi.org/https://doi.org/10.28991/SciMedJ-2020-0201-1
- Ajemu, K. F., Desta, A. A., & Bezabih, N. M. (2019). Impact of breast cancer in Tigray, Northern Ethiopia: Retrospective e-HMIS data base review and analysis. Journal of Cancer Science & Therapy, 11(2). https://doi.org/https://doi.org/10.4172/1948-5956.1000580
- Borges, A., Sousa, I., & Castro, L. (2015). Longitudinal analysis of tumor marker CEA of breast cancer patients from Braga’s hospital. REVSTAT Statistical Journal, 13, 63–20.
- Brinton, L. A., Figueroa, J. D., Awuah, B., Yarney, J., Wiafe, S., Wood, S. N., Ansong, D., Nyarko, K., Wiafe-Addai, B., & Clegg-Lamptey, J. N. (2014). Breast cancer in Sub-Saharan Africa: Opportunities for prevention. Breast Cancer Research and Treatment, 144(3), 467–478. https://doi.org/https://doi.org/10.1007/s10549-014-2868-z
- Brown, E. R. (2003). Ibrahim JG: Bayesian approaches to joint cure rate and longitudinal models with applications to cancer vaccine trials. Biometrics, 59(3), 686–693. https://doi.org/https://doi.org/10.1111/1541-0420.00079
- Collett, D. (2015). Modelling survival data in medical research. Chapman and Hall/CRC.
- Crowther, M. J., Andersson, T. M. L., Lambert, P. C., Abrams, K. R., & Humphreys, K. (2016). Joint modelling of longitudinal and survival data: Incorporating delayed entry and an assessment of model misspecification. Statistics in Medicine, 35(7), 1193–1209. https://doi.org/https://doi.org/10.1002/sim.6779
- Desantis, C., Siegel, R., & Jemal, A. (2013). Breast cancer facts and figures 2013-2014. American Cancer Society, Inc.
- Diabate, M., Coquille, L., & Samson, A.(2018). Parameter estimation and treatment optimization in a stochastic model for immunotherapy of cancer. arXiv:1806. 01915 [q-bio.PE].
- Dickens, C., Joffe, M., Jacobson, J., Venter, F., Schüz, J., Cubasch, H., & Mccormack, V. (2014). Stage at breast cancer diagnosis and distance from diagnostic hospital in a periurban setting: A South African public hospital case series of over 1,000 women. International Journal of Cancer, 135(9), 2173–2182. https://doi.org/https://doi.org/10.1002/ijc.28861
- Diggle, P. J., Sousa, I., & Chetwynd, A. G. (2008). Joint modelling of repeated measurements and time-to-event outcomes: The fourth Armitage lecture. Statistics in Medicine, 27(16), 2981–2998. https://doi.org/https://doi.org/10.1002/sim.3131
- Guo, X., & Carlin, B. P. (2004). Separate and joint modeling of longitudinal and event time data using standard computer packages. 58(1), 16–24. https://doi.org/https://doi.org/10.1198/0003130042854
- Ibrahim, J. G., Chen, M.-H., & Sinha, D. (2001). Bayesian Survival Analysis. Springer-Verlag.
- Ibrahim, J. G., Chu, H., & Chen, L. M. (2010). Basic concepts and methods for joint models of longitudinal and survival data. Journal of Clinical Oncology, 28(16), 2796. https://doi.org/https://doi.org/10.1200/JCO.2009.25.0654
- Jemal, A., Bray, F., Forman, D., O’brien, M., Ferlay, J., Center, M., & Parkin, D. M. (2012). Cancer burden in Africa and opportunities for prevention. Cancer, 118(18), 4372–4384. https://doi.org/https://doi.org/10.1002/cncr.27410
- Kantelhardt, E., Zerche, P., Mathewos, A., Trocchi, P., Addissie, A., Aynalem, A., Wondemagegnehu, T., Ersumo, T., Reeler, A., & Yonas, B. (2014). Breast cancer survival in Ethiopia: A cohort study of 1,070 women. International Journal of Cancer, 135(3), 702–709. https://doi.org/https://doi.org/10.1002/ijc.28691
- Kaplan, E. L., & Meier, P. (1958). Nonparametric estimation from incomplete observations. Journal of the American Statistical Association, 53(282), 457–481. https://doi.org/https://doi.org/10.1080/01621459.1958.10501452
- Kim, S., Zeng, D., Li, Y., & Spiegelman, D. (2013). Joint modeling of longitudinal and cure-survival data. Journal of Statistical Theory and Practice, 7(2), 324–344. https://doi.org/https://doi.org/10.1080/15598608.2013.772036
- Kosvyra, A., Maramis, C., & Chouvarda, I. (2019, June). Developing an Integrated Genomic Profile for Cancer Patients with the Use of NGS Data; a Laboratory of Computing, Medical Informatics and Biomedical Imaging Technologies, School of Medicine, Aristotle University of Thessaloniki, Thessaloniki, Greece. Emerging Science Journal, 3(3), 3. https://doi.org/https://doi.org/10.28991/esj-2019-01178
- Lan, N., Laohasiriwong, W., & Stewart, J. (2013). Survival probability and prognostic factors for breast cancer patients in Vietnam. Global Health Action, 6(1), 18860. https://doi.org/https://doi.org/10.3402/gha.v6i0.18860
- Law, N. J., Taylor, J. M. G., & Sandler, H. (2002). The joint modeling of a longitudinal disease progression marker and the failure time process in the presence of cure. Biostatistics, 3(4), 547–563. https://doi.org/https://doi.org/10.1093/biostatistics/3.4.547
- Lemlem, S. B., Sinishaw, W., Hailu, M., Abebe, M., & Aregay, A. (2013). Assessment of knowledge of breast cancer and screening methods among nurses in university hospitals in Addis Ababa, Ethiopia, 2011. ISRN Oncology, 2013, 1–8. https://doi.org/https://doi.org/10.1155/2013/470981
- Park, K. Y., & Qiu, P. (2014). Model selection and diagnostics for joint modeling of survival and longitudinal data with crossing hazard rate functions. Statistics in Medicine, 33(26), 4532–4546. https://doi.org/https://doi.org/10.1002/sim.6259
- Rizopoulos, D. 2012. Joint models for longitudinal and time-to-event data: With applications in R, Chapman and Hall/CRC: http://jmr.r-forge.r-project.org/
- Seid, A., Getie, M., Birlie, B., & Getachew, Y. (2014). Joint modeling of longitudinal CD4 cell counts and time-to-default from HAART treatment: A comparison of separate and joint models. Electronic Journal of Applied Statistical Analysis, 7, 292–314. https://doi.org/https://doi.org/10.1285/i20705948v7n2p292
- Siegel, R. L., Miller, K. D., & Jemal, A. (2016). Cancer statistics, 2016. CA: A Cancer Journal for Clinicians, 66(1), 7–30. https://doi.org/https://doi.org/10.3322/caac.21332
- Sighoko, D., Kamaté, B., Traore, C., Mallé, B., Coulibaly, B., Karidiatou, A., Diallo, C., Bah, E., Mccormack, V., & Muwonge, R. (2013). Breast cancer in pre-menopausal women in West Africa: Analysis of temporal trends and evaluation of risk factors associated with reproductive life. The Breast, 22, 828–835. https://doi.org/https://doi.org/10.1016/j.breast.2013.02.011
- Simsek, F. (2000). Five year survival analysis of patients with clinical stages I and IIA breast cancer who received initial treatment at North Carolina hospitals. Center for Health Informatics and Statistics.
- Torre, L. A., Bray, F., Siegel, R. L., Ferlay, J., Lortet-Tieulent, J., & Jemal, A. (2015). Global cancer statistics, 2012. CA: A Cancer Journal for Clinicians, 65(2), 87–108. https://doi.org/https://doi.org/10.3322/caac.21262
- Tsiatis, A. A., & Davidian, M. (2004). Joint modeling of longitudinal and time-to-event data: An overview. Stat Sin, 14, 809–834.