
 ?Mathematical formulae have been encoded as MathML and are displayed in this HTML version using MathJax in order to improve their display. Uncheck the box to turn MathJax off. This feature requires Javascript. Click on a formula to zoom.
Abstract
Abstract: Caesarean delivery, often called a C-section, is the delivery of the baby through incisions in the mother’s abdomen and uterus. Caesarean deliveries, whether elective or medically necessary, have risen dramatically in recent decades across the globe, more than the recommended 10–15% by WHO. To determine the mean CSR, ascertain the determinants of Caesarean Section and attitudes of managers toward monitoring and evaluation C-Section. It was descriptive and analytical cross-sectional study design, both qualitative and quantitative. 318 respondent mothers who were admitted to Maternity ward or deliver from the said ward were interviewed. Document review guide, interview guides, and semi-structured questionnaires were used. The study found the Average CSR for St. Joseph’s Hospital _ Kitovu was 47.6%. Determinants associated or which influenced Caesarean delivery were; Age of respondent less than 20 years (p = .041), not being married (p = .015), educational level of respondents (p = .000), living in urban setting (p = .001), among others. Socio-economic determinants (regular household income, p = .000, and occupation, p = .000) highly influenced caesarean delivery. There were mixed views of the health manager toward regularizing monitoring and evaluation of Caesarean Section Rates (CSR). The Caesarean Section Rate (47.6%) in Private Not-For Profit Healthcare organization is still unacceptably higher WHO recommendation of 10–15%. Therefore, there is stronger need to regularize monitoring and evaluation of CSR.
PUBLIC INTEREST STATEMENT
Caesarean delivery is the delivery of the baby through incisions in the mother’s abdomen and uterus. Caesarean Section Delivery Rate, which is the total number of resident caesarean deliveries among woman divided by the total number of all deliveries for a specified geographical area during a specified time period per 100 live births, has increasingly become high across the globe. Over the years, C-sections have become increasingly common in both developed & developing countries. A recent study reported that Caesarean birth rates continue to rise worldwide with recent rate in the year 2016 being 24.5% in Western Europe, 32% in North America, and 41% in South America. This rate has surpassed the World Health Organization recommended CSR of 10–15% for any given population. Studies have shown that when medically necessary, a caesarean section can effectively prevent maternal & newborn mortality but when the rate rises above 15% across a population, this benefit becomes null and void.g
1. 1. INTRODUCTION
1.1. Background to the study
A caesarean delivery, often called a C-section, is the delivery of the baby through incisions in the mother’s abdomen and uterus. Caesarean deliveries, whether elective or medically necessary, have risen dramatically in recent decades in the United States. This made evidence-based research on methods, postoperative care and how to safely reduce their incidence became more imperative (American College of Obstetricians and Gynecologists [ACOG], Citation2017). CESAREAN SECTION DELIVERY RATE is the total number of resident caesarean deliveries among woman divided by the total number of all deliveries for a specified geographical area (country, province, city or hospital) during a specified time period per 100 live births (Anon, Citation2018). It is sometimes expressed in percentage (%).
American College of Obstetricians and Gynecologists [ACOG] (Citation2017) further argued that caesarean section can be done for a number of reasons (indications). Some of the indications, among others, are failure of labor progress or obstructed labor, fetal problems such as umbilical cord prolapses or compression, big baby, malposition of the baby, oblique lie, and cervical dystocia as well as contracted maternal pelvis. Recent study by Oonagh et al. (Citation2018), similarly reported that Caesarean birth rates continue to rise worldwide with recent rate in the year 2016 being 24.5% in Western Europe, 32% in North America, and 41% in South America .
Figure 1. Out-patient Department of St. Joseph Hospital _ Kitovu

According to World Health Organization [WHO] (Citation2015), the ideal rate for caesarean sections is between 10% and 15%. Over the years, however, caesarean sections have become increasingly common in both developed and developing countries. When medically necessary, a caesarean section can effectively prevent maternal and newborn mortality. WHO further argues that when caesarean section rates rise toward 10% across a population, the number of maternal and newborn death decreases. When the rate goes above 10%, there is no evidence that mortality rates improve. The lack of a standardized internationally accepted classification system to monitor and compare caesarean section rates in a consistent and action-oriented manner is one of the factors that has hindered a better understanding of the trend of Caesarean section rates. The practice of standard precautions is very important in improvement of services (Mohd-Nor & Bit-Lian, Citation2019).
Organization of Economic Co-operation for Development [OECD] (Citation2017) argued that nevertheless, caesarean delivery continues to result in increased maternal mortality, maternal and infant morbidity and increased complications for subsequent deliveries, raising questions about the appropriateness of caesarean deliveries that may not be medically required.
Robson and De Costa (Citation2017) reported that recent analyses suggested that the optimal global Caesarean Section rate is almost 20%. Attempts to reduce Caesarean Section rates in developed countries seemed not to have worked at all. They noted that the strongest predictor of caesarean delivery for the first birth of low-risk women appears to be maternal age; a factor that continued to increase. Most women whose first baby is born by caesarean delivery will have all subsequent children by caesarean delivery.
Just like with any surgery, caesarean sections are associated with short- and long-term risk which can extend many years beyond the current delivery and affect the health of the woman, her child, and future pregnancies. These risks are higher in women with limited access to comprehensive obstetric care. In fact, Oonagh et al. (Citation2018) found that Cesarean delivery is associated with future sub-fertility and several subsequent pregnancy risks such as placenta preavia, uterine rupture, and stillbirth. In their submission on complications of C-section, Robson and De Costa (Citation2017) reported that longer term outcomes, such as pelvic organ prolapse and urinary incontinence, are closely related to mode of birth, and up to 20% of women will undergo surgery for these conditions. Furthermore, Hodin (Citation2017) opined that Caesarean section surgery, when medically indicated and performed by trained staff with the necessary equipment and supplies, can be a life-saving procedure for the mother and baby. However, compared to vaginal delivery, caesareans are associated with a higher risk of maternal and neonatal death; numerous maternal morbidities including infection, uterine rupture, and amniotic fluid embolism. The author added that Studies have also observed that children born via caesarean are more likely to develop respiratory problems, diabetes and obesity later in life. Therefore, caesarean section should be considered a major surgical intervention and only be performed when clinically necessary.
Again, a study found that variations do occur on the rates of Caesarean sections depending on local economic levels. National Caesarean section rates were found to range from 0.6% in South Sudan to 58.9% in Dominican Republic. Likewise, within countries, Caesarean section rates were found to be lowest in the poorest areas (3.7%) and highest in the richest areas standing at 18.4% (Adeline et al., Citation2018). The lack of a standardized internationally-accepted classification system to monitor and compare caesarean section rates in a consistent and action-oriented manner is responsible for this discrepancy (World Health Organization [WHO], Citation2015). Another study by Ji et al. (Citation2015) found that 34.9% of women who underwent caesarean section did not have any indications listed in the clinical guidelines nor based on maternal request. Multinomial regression analysis showed that doctors’ influence was one of the significant risk factors of undergoing caesarean section, with doctor-defined indications. A similar study also found the change in the caesarean section rate in urban areas since the 1993 survey and how that change related to household income, access to health insurance and the women’s educational attainment and parity. The rate increased more than threefold between the 1993 and 2008 surveys (crude RR: 3.63, 95% confidence interval, CI: 2.61–5.04). Caesarean section was more common in well -educated and wealthy women and in those with health insurance (Feng, Xu, Guo & Ronsmans, Citation2011).
A study done in Mbarara Regional Referral Hospital (MRRH), found that Caesarean Section Rate (CSR) was greater than 24% for the past four years and was 25% in the month of April 2011. Specifically, the CSR for MRRH was 24.1% in Financial Year 2006/2007, then 28.4% in Financial Year 2007/2008 then 28.5% in Financial Year 2008/2009 and lastly 27.7% in the Financial Year 2009/2010. This finding contradicted the one published by Uganda Demographic Health survey, which had put CSR for Uganda to be varying between 4% in Western region and 1.5% in northern region (Natasha, Citation2016)
Therefore, since Caesarean sections can cause significant and sometimes permanent complications, disability or death particularly in settings that lack the facilities and/or capacity to properly conduct safe surgery and treat surgical complications, it should ideally only be undertaken when medically necessary. Every effort should be made to provide caesarean sections to women in need, rather than striving to achieve a specific rate (World Health Organization [WHO], Citation2015).
This study thus presents introduction, review of literature, methods, results and discussion and conclusion, as well as recommendation. In the introduction, background of the study, study area, problem statement, research questions, conceptual framework and objectives of the study have been presented in that order.
1.2. The study area
Kitovu Health Care Complex, known as St. Joseph’s Hospital, is located in Masaka town, Uganda, about 140 km from the capital Kampala. It is a 248-bed capacity Private Not for Profit (PNFP) Hospital, operating under the umbrella organization of the Uganda Catholic Medical Bureau (UCMB).It is a general hospital offering; 24-h emergency service, Obstetrics/Gynecology, Neo-Natal/Baby Unit, Pediatrics, Surgery, Vesico-Vaginal Fistula Repair (VVF) and Prevention, Pastoral Care, Intern and Outreach Programs, Laboratory Training School and HIV/AIDS-programs (Kitovu Hospital Masaka, Citation2017)
1.3. Problem statement
For the past 30 years, World Health Organization recommendation on Cesarean Section Rates (CSR) has been 10 −15% of local population. Despite this recommendation, global CSR has been increasing over the years. Robson and De Costa (Citation2017) reported that recent analyses suggested that the optimal global Cesarean Section rate is almost 20%. Variations of rate are seen to occur with different local economic levels (Adeline et al., Citation2018). In Uganda, a study once found the CSR of Mbarara regional referral hospital to be 24.1% (Natasha, Citation2016).
Therefore, from observation, the researcher presumed that the major problem was that there is high CSR, which was presumed to be much higher in Private-Not-for-Profit (PNFP) hospitals of Uganda, such as St. Joseph’s Hospital _ Kitovu. Much as when medically justified, a caesarean section can effectively prevent maternal and perinatal mortality and morbidity, there could be both short-term and long-term complications (consequences) of caesarean section. These include; pelvic organ prolapses, urinary incontinence, infection and uterine rupture, as well as higher cost of hospital deliveries, among others. The commonest factors associated with this increase is not yet clear.
This research, therefore, sought to determine the Caesarean Section Rates (CSR) and the associated factors. This is believed to contribute to the reduction of the rate of Caesarean sections to the recommended WHO standard.
1.4. Research questions
The study sought to obtain answers to the following research question;
What was the average Caesarean Section Rate (CSR) among mothers in St. Joseph’s Hospital _ Kitovu between January, 2019 and August, 2019?
What were the determinants of Caesarean Section among mothers in St. Joseph’s Hospital _ Kitovu by August, 2019?
What was the attitude of managers toward monitoring and evaluating Caesarean Section Rates in St. Joseph’s Hospital _ Kitovu by August, 2019?
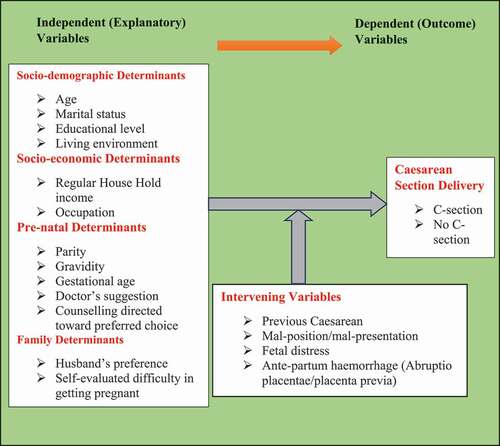
1.5. Conceptual framework
A number of factors affect mothers’ preferences for Caesarean Section delivery, thus eventually influencing Caesarean Section Rate (CSR) directly or indirectly. below shows the relationship between those factors and eventful Caesarean Section Delivery. As per below, socio-demographic, socio-economic, pre-natal and family factors all contribute to the final mode of delivery of the mothers. These eventually determine whether the mothers will deliver by Caesarean section or no C-section (Vaginal birth) hence directly or indirectly affecting Caesarean Section Rate (CSR).
Figure 2. Conceptual Framework for Determinants of C-Section
1.6. Specific objectives of the study
The specific objectives were;
To determine the average Caesarean Section Rate (CSR) among mothers in St. Joseph’s Hospital _ Kitovu between January, 2019 and August, 2019.
To establish the determinants of Caesarean Section delivery among mothers in St. Joseph’s Hospital _ Kitovu by August, 2019
To examine the attitudes of managers toward monitoring and evaluating Caesarean Section Rates in St. Joseph’s Hospital _ Kitovu by August, 2019
2. REVIEW OF LITERATURE
2.1. Mean caesarean section rate (CSR)
CESAREAN SECTION DELIVERY RATE is the total number of resident caesarean deliveries among woman divided by the total number of all deliveries for a specified geographical area (country, province, city or hospital) during a specified time period per 100 live births (Anon, Citation2018). It’s sometimes expressed in percentage (%).
At the close of the year 2015, the Sustainable Development Goals (SDGs) emerged with a target to bring a reduction in maternal mortality ratio (MMR) to less than 70 per 100,000 live births worldwide, and to ensure healthy lives for all at all ages by 2030 (UN General Assembly, Citation2015). Even so, with the immense global interventions to reduce the problem of maternal and child deaths due to complications in pregnancy and delivery, the magnitude of maternal mortality remains high, especially in sub-Sahara Africa region (Sanni et al., Citation2018). The authors have argued that, in the quest to achieve SDG-3, equity and equality in availability to emergency obstetric care including assisted vaginal delivery together with safe caesarean section (C-section) is exceedingly essential. C-section is a known life-saving procedure for both mother and child.
A study in South-Western China found that caesarean delivery rate ranged from 53.5% to 56.1% in 2001–2004 and from 43.9% to 36.1% in 2005–2011. When 2001–2004 and 2005–2011 were treated as “before” and “after” periods to evaluate their intervention’s impact on the mean caesarean section rate, a significant reduction was noted: from 54.8% to 40.3% (odds ratio, OR: 0.56; 95% confidence interval, CI: 0.52–0.59; χ(2) test: P < 0.001) (Runmei et al., Citation2012)
In another study, it is said that the incidence rates of Caesarean section vary widely worldwide (Festin et al., Citation2009; Liu et al., Citation2007). Many countries are taking measures to reduce and/or prevent the increase of Caesarean Section rates to meet the World Health Organization recommendation (Wanjari, Citation2014; Organization of Economic Co-operation for Development [OECD], Citation2017). However, the CSR in some countries are significantly above the WHO recommendation, for example, Turkey (53.1% of births), Mexico (46.8%), Chile (45%), Italy (35.3%), and the USA (32.2%). In contrast, other countries, including Iceland (16%), Israel (16.2%), Sweden (17.3%), and Norway (16.1%), have CS rates at or near the recommendation (Organization of Economic Co-operation for Development [OECD], Citation2017). Nevertheless, caesarean delivery continues to result in increased maternal mortality, maternal and infant morbidity and increased complications for subsequent deliveries, raising questions about the appropriateness of caesarean deliveries that may not be medically required.
According to World Health Organization [WHO] (Citation2015), the ideal rate for caesarean sections is between 10% and 15%. Over the years, however, caesarean sections have become increasingly common in both developed and developing countries. When medically necessary, a caesarean section can effectively prevent maternal and newborn mortality. WHO further argues that when caesarean section rates rise toward 10% across a population, the number of maternal and newborn deaths decrease. When the rate goes above 10%, there is no evidence that mortality rates improve. The lack of a standardized internationally accepted classification system to monitor and compare caesarean section rates in a consistent and action-oriented manner is one of the factors that has hindered a better understanding of the trend of Caesarean section rates.
In a similar study in Africa, result showed disparities in the percentage of C-section among women from 34 SSA countries. C-section at public healthcare settings ranged from 3% in Burkina Faso to 15.6% in Ghana. However, in private healthcare settings, C-section ranged from 0% in Sao Tome and Principe to 64.2% in Rwanda. Overall, C-section was 7.9% from public health care and 12.3% from private healthcare facilities, respectively (Sanni et al., Citation2018).
Caesarean section rates are high and continue to rise in developed countries. However, the impact of guidelines and recommendations in curbing their growth has been limited (Lauer et al., Citation2010). In 1985, representatives of a study group convened by the World Health Organization wrote, “there is no justification for any region to have caesarean section rates higher than 10–15%” (World Health Organization [WHO], Citation1985).
According to Rahman et al. (Citation2018), Caesarean section (CS) has been on the rise worldwide and Bangladesh is no exception. In Bangladesh, the CS rate, which includes both institutional and community-based deliveries, has increased from about 3% in 2000 to about 24% in 2014.
2.2. Determinants of caesarean section
According to Organization of Economic Co-operation for Development [OECD] (Citation2017), rates of caesarean delivery have increased over time in nearly all OECD countries, although in a few countries this trend has reversed, at least slightly, in the past few years. Reasons for the increase include the rise in first births among older women and in multiple births resulting from assisted reproduction, malpractice liability concerns, scheduling convenience for both physicians and patients, and the increasing preference of some women to have a caesarean delivery, among others. Nonetheless, caesarean delivery continues to result in increased maternal mortality, maternal and infant morbidity, and increased complications for subsequent deliveries, raising questions about the appropriateness of caesarean deliveries that may not be medically required.
In China, the rate of C-Section increased from 0.8% in 1993 to 16.6% in 2008 in rural areas and from 5.9% to 36.4% in urban areas. The rise among women with a first pregnancy was also dramatic: in the 2008 survey, 28.2% of rural primiparous women and 57.1% of urban primiparous women reported giving birth by caesarean section (Feng et al., Citation2012). The authors then concluded that the large variation in caesarean section rate by socioeconomic region independent of individual income, health insurance or education–suggests that structural factors related to service supply have influenced the increasing rate more than a woman’s ability to pay.
A study in Ghana by Manyeh et al. (Citation2018) found that the overall C-section rate was 6.59%. Women aged 30–34 years were more than twice likely to have C-section compared to those less than 20 year (OR: 2.16, 95% CI: 1.20–3.90). And yet, women aged 34 years and above were more than thrice likely to undergo C-section compared to those less than 20 year (OR: 3.73, 95% CI: 1.45–5.17). The odds of having C-section was 65% and 79% higher for participants with Primary and Junior High-level schooling, respectively (OR: 1.65, 95% CI: 1.08–2.51, OR:1.79, 95%CI: 1.19–2.70). The likelihood of having C-section delivery reduced by 60, 37, and 35% for women with parities 2, 3 and 3+ respectively (OR: 0.60, 95% CI: 0.43–0.83, OR: 0.37, 95% CI: 0.25–0.56, OR:0.35, 95% CI: 0.25–0.54). There were increased odds of 36, 52, 83% for women who belong to poorer, middle, and richer wealth quintiles, respectively (OR: 1.36, 95%CI: 0.85–2.18, OR: 1.52, 95% CI: 0.97–2.37, OR: 1.83, 95% CI: 1.20–2.80). Participants who belonged to the richest wealth quintile were more than 2 times more likely to have C-section delivery (OR: 2.14, 95%CI: 1.43–3.20). The authors then concluded that Age of mother, educational level, parity, household socioeconomic status, district of residence, and level of education of household head are associated with caesarean section delivery.
Similar study was conducted in Italy. The frequency of caesarean section rose from 11.2/100 deliveries in 1980 to 14.5/100 in 1983. Caesarean section rates were lower in the Southern (less rich) areas, and rose steadily with maternal age, being about three times higher in women aged greater than or equal to 40 years than in teenagers. Maternal education was directly associated with caesarean section rates: compared with women with only primary school education, those with a college education reported an about 40% higher rate of caesarean section. The C-section rate was 13.3/100 deliveries in public hospitals and 11.8/100 in private ones, but this reflected the different utilization of public and private services in various geographical areas. It was found that Caesarean section rates were about 20% higher in nulliparous women than in multiparous women and the rates increased with increase in the number of stillbirths or miscarriages. Further, the rate of C-section was about double in multiple births than in single births (Parazzini et al., Citation1992).
In their study in rural community, which included 224 study subjects who have undergone 389 deliveries, similar results were obtained. Of all the respondents, 54% were by caesarean section and 46% were normal deliveries. Age of mother, type of family, educational status of mother, height of mother and place of delivery were identified as relevant variables. Their association with C-sec rates and time trend of c-sec rates are presented (Karna & Malhotra, Citation2017).
Again, according to Rahman et al. (Citation2018), factors like mother being older, obese, residing in urban areas, first birth, maternal perception of large new-born size, husband being a professional, had higher number of antenatal care (ANC) visits, seeking ANC from private providers, and delivering in a private facility were statistically associated with higher rates of C-section. The authors further asserted that older mothers aged 25–29 years and 30–49 years had higher odds of delivery by CS [OR = 2.29; CI = 1.55–3.38 and OR = 2.37; CI = 1.47–3.81, respectively,] than adolescent mothers aged 15–19 years. Mothers who were employed had less odds of CS done [OR = 0.75; CI = 0.57–1.00] than who were not employed; while the mothers whose husbands are professionals had higher chance of getting CS done [OR = 1.62; CI = 1.00–2.64] than mothers whose husbands were farmers/workers. Chance of CS decreases with higher birth order, e.g., second birth order [OR = 0.58; CI = 0.43–0.78], and third order or higher [OR = 0.42; CI = 0.29–0.63] in comparison to the first birth. Mothers who lived in urban areas had higher odds of CS delivery [OR = 1.91; CI = 1.15–3.16] than mothers who lived in rural areas. Mothers who belonged to higher wealth quintiles had more chance of getting CS, example, middle [OR = 1.62; CI = 1.03–2.54], richest [OR = 1.98; CI = 1.18–3.32]. Mothers who received higher number of antenatal care visits from private facilities had higher chance of CS delivery, e.g., 1–2 visits [OR = 2.31; CI = 1.44–3.70], and 3 or more [OR = 3.47; CI = 2.18–5.52]. Mothers who had delivery in private facilities had higher chances of CS done [OR = 47.73; CI = 34.24–66.54]. If the delivery is conducted in an urban private facility, the odds of it being a caesarean section are 50 times higher than it being a normal delivery.
Other scholars assert that since Caesarean delivery rates are rising in many parts of the world, to define strategies to reduce them, it is important to identify their clinical and organizational determinants (Stivanello et al., Citation2014).
Furthermore, according to Anon (Citation2018), during 2004–2006 (average) in the United States, the rate of Caesarean deliveries was highest for women ages 40 and older (46.1%), followed by women ages 30–39 (36.0%), ages 20–29 (27.2%) and under age 20 (21.4%). C- section birth rates were highest for Black infants (32.1%), followed by Whites (29.9%), Asians (29.6%), and Native Americans (26.2%). Compared with singleton births (one baby), multiple births in the United States were about 2 times as likely to be delivered by caesarean in 2006.
2.3. Lived experiences of mothers who had caesarean section delivery
According to Rahman et al. (Citation2018), Mothers reported, Convenience and labor pain avoidance as two major reasons which contributed to their elective CS (CS not indicated by medical reasons). They established the reasons for choosing CS by principal decision makers, such as, doctor or mother. In most of the cases (71.5%), doctors took the final decision for CS. Other complications were the principal reasons cited by mothers (29.9%) followed by malpresentation (20.9%), convenience (16.9%), and labor pain avoidance (15.1%). On the other hand, malpresentation was the major cause for the doctors (37.3%) followed by other complications (33.8%), failure to progress in labor (18.8%), and previous CS (13.9%).
In another study, the authors argued that the notion that a caesarean delivery was safer for the baby reinforced the participants’ feelings of not having a choice. One participant explained, “I wanted desperately to birth vaginally, but I opted for the planned caesarean, as in the end the risk to the baby was much less.” These women were willing to forego their own desires for a vaginal birth in order to provide what they felt was the safer alternative for their baby (Puia, Citation2018).
2.4. Attitudes of health managers toward monitoring and evaluating C-section
In their study in Bangladesh, Rahman et al. (Citation2018) concluded that health system urgently needs policy guideline with monitoring of clinical indications of Caesarean Section deliveries to avoid unnecessary C-Section. Strict adherence to this guideline, along with enhance knowledge on the unsafe nature of the unnecessary C-Section can achieve increased institutional normal delivery in future; otherwise, an emergency procedure may end up being a lucrative practice.
3. METHODS
3.1. Study design
The design was a Descriptive and Analytical Cross-sectional study, undertaken before August, 2019. It took both qualitative and quantitative dimensions, thus a mixed-method study. The choice of this design was based on the Strengths of the design. These are relatively quick and easy to conduct (no long periods of follow-up), data on all variables are only collected once, ability to measure prevalence for all factors under investigation, multiple outcomes and exposures can be studied, among others (Health Knowledge, 2010).
3.2. Study population
The study populations were mothers admitted to the maternity ward of St. Joseph’s Hospital _ Kitovu and health managers of the health facility.
3.3. Study unit
The units of study were a mother admitted to the maternity ward of St. Joseph’s Hospital _ Kitovu and a health manager of the health facility.
3.4. Inclusion and exclusion criteria
3.4.1. Inclusion criteria
The respondent mothers included those pregnant mothers who had been admitted to Maternity ward or all who delivered from the ward within the study period. The respondent health managers who were top-level decision-makers of the health facility or working in maternity ward and are available at the study time were included.
3.4.2. Exclusion criteria
The pregnant mothers who were not admitted to Maternity ward or who delivered from outside the maternity ward within the study period were excluded. The respondent health managers who were the top level decision-makers of the health facility or working in maternity ward and were not available at the study time were excluded.
3.5. Sample size determination
The formula for calculation of sample size (n) when population size (N) is known was used to determine the sample size. This is called Taro Yamane formula (1967:886) and it provides a simplified formula to calculate sample sizes (Israel, Citation1992; Polonia, Citation2013). Assuming a 95% confidence level and maximum degree of variability of the attributes in the population, p = 50% (0.5), the sample size was calculated as below;
Thus, using the formula;
where n is the sample size, N is the population size and e is the level of precision (Sampling error—5%).
Note that the degree of variability in the attributes (P) being measured refers to the distribution of attributes in the population. The more heterogeneous a population, the larger the sample size required to obtain a given level of precision. The less variable (or more homogeneous) a population is, the smaller the sample size. Hence, a proportion of 50% indicates a greater level of variability than either 20% or 80%. This is because 20% and 80% indicate that a large majority do not or do, respectively, have the attribute of interest. Because a proportion of .5 indicates the maximum variability in a population, it is often used in determining a more conservative sample size, that is, the sample size may be larger than if the true variability of the population attribute were used (Israel, Citation1992; Polonia, Citation2013).
Over the seven-month period, the total in-patient admission was 1534mothers, with average of 220 mothers per month.
Thus;
Samples (n):
Four (4) respondents health managers were purposively selected to ascertain institutional attitudes toward monitoring and evaluating Caesarean Section. They were the key informants.
3.6. Sampling procedures
A purposive sampling technique was used to identify the key informants to be interviewed. Selection of these informants was predetermined before starting the study.
However, a Simple random technique was used to identify the respondent mothers. All mothers who met the inclusion criteria were assigned a random number, and the researcher had copies of those random numbers in wrap-up pieces of paper. The researcher then drew the numbers representing each mother randomly from the different group of mothers. This exercise continued by way of picking until the sample size, n, is reached. Using these numbers, the researcher went to the wards where the mothers were, traced the mothers using the numbers and interviewed them there and then.
Proportionate sampling technique was used (See ) to draw the respondent mothers from each category as shown below;
Table 1. Proportionate Selection of Mothers
3.7. Research variables
The dependent (Outcome) variables were the mother’s delivery mode, “Vaginal birth—No C-section” or “Caesarean Section”, “Number of Caesarean Section conducted” and “Number of total in-patient admissions made”. On the other hand, the independent (explanatory) variables were; the “Socio-demographic, Socio-economic, Pre-natal and family factors”, with details shown in below.
Table 2. Study variables used
3.8. Data collection sources, tools and techniques
3.8.1. Data sources
Both secondary and primary data were used. The secondary data from patient files (hospital record) for the past 6 months from January, 2019 to July, 2019 was retrieved. These are the records of patients admitted to Maternity wards. On the other hand, primary data were collected from respondent pregnant mothers and key informant health managers.
3.8.2. Data collection tools and techniques
The following tools were used; Document Review Guide (Observation Checklist), Interview guides (for key informants & mothers) and Semi-structured questionnaires.
Document Review Guide was used to guide and extract information, for the past six (6) months, on the numbers of Caesarean Sections conducted, total number of deliveries conducted and number of total in-patient admission made. Interview guide was used to extract information on health managers’ attitudes toward monitoring and evaluating Caesarean Section as well as mothers’ lived experiences. Finally, a semi-structured self-administered questionnaire was used by the researcher to record individual responses from the mothers.
3.9. Data entry, analysis and presentation methods
The data generated were entered into Microsoft excel and Statistical Package for Social Sciences (SPSS) software of a computer for analysis. With the use of this software, analysis was made easier. Likewise, the qualitative data were coded, transcribed and content analysis done. Themes and sub-themes were generated. The results were presented in narrative/descriptive statements, tables and graphs as appropriate. Data related to this study has been published and made publicly available (Omona, Citation2021)
3.10. Quality control measures
3.10.1. Reliability
This refers to the consistency of a measure. According to Price et al. (Citation2018), researchers consider three types of consistency: over time (test–retest reliability), across items (internal consistency) and across different researchers (inter-rater reliability). This study, however, focused on internal consistency and test–retest reliability. Assessing test–retest reliability requires using the measure on a group of people at one time, using it again on the same group of people at a later time and then looking at test–retest correlation between the two sets of scores. For this study, pre-testing and retesting of the construct was done to ascertain the reliability, without test correlation. Non-response factor was computed and taken into account. Similarly, internal consistency, which is the consistency of people’s responses across the items on a multiple-item measure, was ascertained. The data generated was double-checked for completeness, appropriateness and correctness before entering in the Microsoft excel sheet and Statistical Package for Social Sciences (SPSS) for analysis. After entry, another counter-check was made.
3.10.2. Validity
This is the extent to which the scores from a measure represent the variable they are intended to. Researchers need to make this judgment. They consider one factor that they take into account—reliability. When a measure has good test–retest reliability and internal consistency, researchers should be more confident that the scores represent what they are supposed to (Price et al., Citation2018). There are three basic kinds: face validity, content validity and criterion validity. Face validity is the extent to which a measurement method appears “on its face” to measure the construct of interest. Content validity is the extent to which a measure “covers” the construct of interest. For this study, therefore, both face and content validity checks were ensured by the researcher. For the qualitative data, repeated replay was made to appreciate the information and make substantive meaning out of it, that is, content checking. This enabled the development of the appropriate thematic areas (Yang et al., Citation2018)
3.11. Ethical considerations
As laid down by Centre for Innovation in Research and Teaching ([CIRT], 2018), the researcher undertook a number of ethical considerations. Clearance from the Institutional Review Board (IRB) was sought, confidentiality adhered to and informed consent sought.
4. RESULTS
4.1. Socio-demographic characteristics of respondents
The socio-demographic characteristics of the respondents were examined by univariate analysis and the results are summarized in table below.
From above, 92 (28.9%) of the respondent mothers delivered by Caesarean Section while the rest of the respondents had other types of delivery or had not yet delivered. The other types of delivery examined in this study were; Spontaneous Vaginal Delivery (SVD) and Vacuum extraction.
Table 3. Socio-demographic Characteristics of Respondents
Majority of the respondents, 192 (60.4%) were aged 20–40 years. The respondents who were less than 20 years or more than 40 years accounted for 19.8%, respectively. 261 (82.1%) of the respondents were married. Most of the respondents (56.6%) were housewives, followed by peasants at 23.9%. Majority of the respondents, 103 (32.4%) had tertiary education. The regular monthly household income of the participants was less than UGX 100,000/ = followed by those earning between UGX100,000/ = to UGX 300,000/ = accounting for 39.0% and 32.1%, respectively. 50.9% of them lived in rural areas whereas 49.1% lived in urban setting. Few of the respondents, 87 (27.4%), preferred Caesarean section as their mode of delivery whereas for most of them, 288 (90.6%), the gestational age was 28 weeks or more.
4.2. Average caesarean section rate (CSR) in St. Joseph’s Hospital _ Kitovu
To determine the average CSR, data were collected for the past seven months; January, 2019 to July, 2019. Summary of data collected are shown in below.
Table 4. Data Used For Computation of Average CSR
Average Caesarean Section Delivery Rate, which is the total number of resident caesarean deliveries among woman divided by the total number of all deliveries for the specified hospital during a specified time period, was computed. The study found the Average CSR for St. Joseph’s Hospital _ Kitovu was 47.6%.
4.3. Determinants of caesarean section delivery
To establish the determinants of Caesarean Section Delivery, in St. Joseph’s hospital _ Kitovu, respondent mothers were asked related questions. Their responses record entered in to SPSS and bi-variate analysis was made between Caesarean delivery and the corresponding variables. The results of the bivariate analysis are shown in below.
Table 5. Bivariate Analysis of Caesarean Delivery versus the Independent Variables
From above, the study found a number of determinants were associated or influenced Caesarean delivery in St. Joseph’s Hospital Kitovu. These were Age of respondent less than 20 years (p = .041), not being married (p = .015), educational level of respondents (p = .000), living in urban setting (p = .001), among others. All the socio-economic determinants (regular household income, p = .000, and occupation, p = .000) highly influenced caesarean delivery in the health facility. On the other hand, gestational age (p = .892) and gravidity (p = .316) of the mothers did not influence Caesarean delivery.
The study found that 53.3% of the respondents who had Caesarean delivery were 20–40 years of age and that being in this age category is 0.4 times less likely to predispose one to Caesarean delivery (COR =0.378, CI(0.114–1.256)). Conversely, being more than 40 years of age is 1.3 times more likely to make the respondent deliver by Caesarean section (COR = 1.286, CI(0.471–3.514)). Not being married was a determinant of Caesarean delivery (p = .015) and again these respondents 2 times more likely to deliver by Caesarean section than the married counterparts (COR = 2.064, CI(1.140–3.739)). It is 4.8 times, 2.3 times and 1.1 times more likely for the respondents who had Primary, Post-primary and tertiary education, respectively, to deliver by Caesarean section than those who had no education (COR = 4.843, CI(1.821– 12.878); COR = 2.328, CI(1.100–4.926); COR = 1.057, CI(0.565–1.976)).
Mothers who lived in urban setting were 2.8times more likely to deliver by Caesarean section as opposed to their rural counterparts (p = .001, COR = 2.764, CI(1.542–4.953). Respondents who earned UGX100.000/ = to UGX300.00/ = and those who earned more than UGX300.000/ = were 11times and 2times more likely to deliver by Caesarean section (COR = 11.106, 2.238, respectively) than those mothers who earned less than UGX100.000/ = . Whereas occupation was highly significant to delivering by Caesarean section (p = .000), the formally employed mothers and housewives were found to be 0.3times less likely to deliver by Caesarean section than their peasant counterparts (COR = 0.359, CI(0.186–0.964); COR = 0.369, CI (0.185–0.737)) respectively.
Parity of the mothers was highly determinant of one’s delivery by Caesarean section (p = .000). Even so, Multiparous mothers were 4.5 times more likely to deliver by Caesarean section than the Paro 0 and Para 1 mothers (COR = 3.879, CI(1.214 −12.397)). Similarly, mothers whose preferred choice of mode of delivery was no C-section were o.4times less likely to deliver by Caesarean section (COR = 0.443, CI(0.225–0.873)). Lastly, mothers whose reason for preferred choice of mode of delivery was based on doctor’s suggestion were 2.4 times more likely to deliver by Caesarean section. Likewise, mothers whose choice of mode of delivery was based on husband’s preference were less likely to deliver by Caesarean section (COR = 0. 135, CI(0.021–0.855)).
4.4. Attitudes of managers toward monitoring and evaluating CSR
To determine the attitudes of managers toward monitoring and evaluating CSR in St. Joseph’s Hospital _ Kitovu, four (4) top-level healthcare managers were interviewed. The said managers were asked specific questions, later used to determine attitudes of managers toward monitoring and evaluating CSR.
below is the summary of characteristic of managers interviewed;
Table 6. Characteristics of respondents health managers Interviewed
Themes were developed through reading, analysis, reflection and classification of the data.This thematic analysis of the interviews resulted in four themes: “Thoughts about CSR”, “Presence of M & E system in the facility”, “Management ever involved in M & E of C-Section” and “Views about regularizing M & E of C-Section”. below shows the themes and corresponding sub-themes that emerged
Table 7. Themes and Sub-themes That Emerged
4.5. Theme 1: thoughts about CSR
The respondents were asked about their thoughts on CSR in St. Joseph’s Hospital _ Kitovu and their thoughts were positive about CSR. Many of them believed that they have competent teams, including full time Obstetricians and for that matter the rate of Caesarean was alright. For example, one respondent had this to say,
“[…] what do you mean? Here we have a team of qualified medical personnels ranging from intern doctors, medical officers and three (3) resident Obstetricians. So, I believe the rate of Caesarean delivery must be ok […]”, Said Respondent W.
Another respondent reported as,
“[…] sometime back we had a team from Ministry of Health who came for supervision here and they complained that our CSR is higher. But it ended there. So, I think we are doing well. Yes, there may be slight difference from other facilities […]”, reports Respondent Y
Therefore, in a nut shell, the managers seem to suspect that CSR may be high in the facility. They were not sure by how much.
4.6. Theme 2: presence of M & E system in the facility
When managers were asked to state whether or not the health facility had functional monitoring and evaluation system, two sub-themes emerged; Sub-theme (a) M & E for some departments and Sub-theme (b) No M & E for Caesarean Section. Indeed, all the four managers reported that there was monitoring and evaluation system but not applied in monitoring and evaluating Caesarean delivery. One respondent reported as;
“[…] Yes, we have a fully functional M & E system … . We have used it in many departments. But I don’t remember using it for monitoring Caesarean deliveries [… .]”, reports Respondent W
Another respondent reported as below;
“For us, here in theatre, we monitor and evaluate many things. But we don’t monitor and evaluate CSR. We only record all Caesarean deliveries month by month […]”, Said Respondent Z
These responses are clear that M & E system is available but not intended for monitoring and evaluating CSR.
4.7. Theme 3: management ever involved in M & E of C-section
Managers were asked whether they had ever done monitoring and evaluation of CSR in this health facility, and if so, what they found. The responses got showed that all the four managers never participated in any M & E of CSR in the facility.
One respondent reported as;
“[…] No, we don’t monitor and evaluate CSR. We simply rely of the expertise of the Obstetricians and Medical Officers, because we believe that they are experienced enough to do quality Caesarean sections […]”, said Respondent W
4.8. Theme 4: views about regularizing M & E of C-section
When managers were asked to state their views about regularizing M & E of Caesarean deliveries, the views were mixed between negative and positive views. These were sub-categorized as; Sub-theme (a)-Negative views and Sub-theme (b)—Positive views.
One respondent had this to say,
“[…] whereas regularizing CSR is good, what impact will it have on the independency of the doctors to make decisions. Doctors will be too restricted to the point that many mothers may end up dying of complication because doctors will fear to take them to theatre for Caesarean section. This will increase maternal death […]”, said Respondent X
This view, alongside with others similar to it, was viewed as negative views toward regularizing M & E of Caesarean section.
Conversely, another respondent reported as below;
“For me I think it is ok to regularize M & E of Caesarean delivery, if ministry of health thinks so. This will even eliminate irrational Caesarean deliveries […]”, reports Respondent Z
Respondent W said, “[…] Yes, we may need to follow standard operating procedures. So, regularizing it is good but this must be across the country”
These last two views are in support of regularizing monitoring and evaluation of CSR, hence positive views from health managers.
4.9. Summary of results
The study found the Average CSR for St. Joseph’s Hospital _ Kitovu was 47.6%. It also found a number of determinants were associated or influenced Caesarean delivery in St. Joseph’s Hospital Kitovu. These were; Age of respondent less than 20 years (p = .041), not being married (p = .015), educational level of respondents (p = .000), living in urban setting (p = .001), among others. All the socio-economic determinants (regular household income, p = .000, and occupation, p = .000) highly influenced caesarean delivery in the health facility. On the other hand, gestational age (p = .892) and gravidity (p = .316) of the mothers did not influence Caesarean delivery.
The study found that 53.3% of the respondents who had Caesarean delivery were aged 20–40 years and that being in this age category is 0.4times less likely to predispose one to Caesarean delivery (COR =0.378, CI(0.114–1.256)). Conversely, being more than 40 years of age is 1.3times more likely to make the respondent deliver by Caesarean section (COR = 1.286, CI(0.471–3.514)).
Mothers who lived in urban setting were 2.8times more likely to deliver by Caesarean section as opposed to their rural counterparts (p = .001, COR = 2.764, CI(1.542–4.953). Respondents who earned UGX100.000/ = to UGX300.00/ = and those who earned more than UGX300.000/ = were 11times and 2times more likely to deliver by Caesarean section (COR = 11.106, 2.238, respectively) than those mothers who earned less than UGX100.000/ = .
Lastly, mothers whose reason for preferred choice of mode of delivery was based on doctor’s suggestion were 2.4times more likely to deliver by Caesarean section. Likewise, mothers whose choice of mode of delivery was based on husband’s preference were less likely to deliver by Caesarean section (COR = 0. 135, CI(0.021–0.855)).
The views of the health manager were in support of regularizing monitoring and evaluation of Caesarean Section Rates (CSR).
Qualitatively, there were mixed views about regularizing monitoring and evaluation of Caesarean delivery in the health facility. Some managers believe it is alright to do so while others are very much reserved about it.
5. DISCUSSION
5.1. Average caesarean section rates (CSR)
This study found the average CSR over a seven (7) month period was 47.6%, far much higher the World Health Organization recommendation of 10–15%. According to World Health Organization [WHO] (Citation2015), the ideal Caesarean Sections Rate (CSR) is between 10% and 15%. Over the years, however, caesarean sections have become increasingly common in both developed and developing countries. When medically necessary, a caesarean section can effectively prevent maternal and newborn mortality. They further argued that whereas, when CSR rise toward 10% across a population, the number of maternal and newborn deaths decreases. When the rate goes above 10%, there is no evidence that mortality rates improve. The lack of a standardized internationally accepted classification system to monitor and compare CSR in a consistent and action-oriented manner is one of the factors that has hindered a better understanding of the trend of Caesarean section rates.
Even so, with the immense global interventions to reduce the problem of maternal and child deaths due to complications in pregnancy and delivery, the magnitude of maternal mortality remains high, especially in sub-Sahara Africa region (Sanni et al., Citation2018). According to Rahman et al. (Citation2018), Caesarean section (CS) has been on the rise worldwide and Bangladesh is no exception. In Bangladesh, the CS rate, which includes both institutional and community-based deliveries, has increased from about 3% in 2000 to about 24% in 2014. However, many countries are now taking measures to reduce and/or prevent the increase of Caesarean Section rates to meet the World Health Organization recommendation (Shamshad, 2008; Organization of Economic Co-operation for Development [OECD], Citation2017).
5.2. Determinants of caesarean delivery
This study found a number of determinants were associated or influenced Caesarean delivery in St. Joseph’s Hospital Kitovu. These were Age of respondent less than 20 years (p = .041), not being married (p = .015), educational level of respondents (p = .000), living in urban setting (p = .001), among others. All the socio-economic determinants (regular household income, p = .000, and occupation, p = .000) highly influenced caesarean delivery in the health facility.
This finding is consistent with those studies done elsewhere. According to Organization of Economic Co-operation for Development [OECD] (Citation2017), rates of caesarean delivery have increased over time in nearly all OECD countries, although in a few countries, this trend has reversed, at least slightly, in the past few years. Reasons for the increase include the rise in first births among older women and in multiple births resulting from assisted reproduction, malpractice liability concerns, scheduling convenience for both physicians and patients, and the increasing preference of some women to have a caesarean delivery, among others.
In China, the rate of C-Section increased from 0.8% in 1993 to 16.6% in 2008 in rural areas and from 5.9% to 36.4% in urban areas. The rise among women with a first pregnancy was also dramatic: in the 2008 survey, 28.2% of rural primiparous women and 57.1% of urban primiparous women reported giving birth by caesarean section (Feng et al., Citation2012). The authors then concluded that the large variation in caesarean section rate by socioeconomic region–independent of individual income, health insurance or education–suggests that structural factors related to service supply have influenced the increasing rate more than a woman’s ability to pay.
5.3. Attitude of managers toward monitoring and evaluating CSR
Qualitatively, there were mixed views about regularizing monitoring and evaluation of Caesarean delivery in the health facility. Some managers believe it is alright to do so while others are very much reserved about it. This finding is also similar to those reported elsewhere. In their study in Bangladesh, Rahman et al. (Citation2018) concluded that health system urgently needs policy guideline with monitoring of clinical indications of Caesarean Section deliveries to avoid unnecessary C-Section. Strict adherence to this guideline, along with enhance knowledge on the unsafe nature of the unnecessary C-Section can achieve increased institutional normal delivery in future; otherwise, an emergency procedure may end up being a lucrative practice. This view is substantiated by World Health Organization [WHO], Citation2018b), which argued that Caesarean section rates have been steadily increasing worldwide over the last few decades above levels that cannot be considered medically necessary. They further argued that there is evidence that potentially unnecessary caesarean sections may put the lives and well-being of women and their babies at risk—both in the short- and long term. Therefore, in recognition of the urgent need to address the sustained and unprecedented rise in the use of caesarean section, World Health Organization [WHO], Citation2018b) has produced evidence-based guidance on non-clinical interventions specifically designed to reduce unnecessary caesarean section. High expenditure on C-section could lead to catastrophic health expenditure and thus needs to be monitored and evaluated to prevent catastrophic health expenditure (Paudel, Citation2019).
6. CONCLUSION
The rate of Caesarean delivery is unacceptably high, even in Private-Not-For-Profit healthcare organization and yet, as with any surgery, caesarean section is associated with short- and long-term risks. These can extend many years beyond the current delivery and affect the health of the woman, the child, and future pregnancies. Caesarean section increases the likelihood of requiring a blood transfusion, the risks of anesthesia complications, organ injury, infection, thrombo-embolic disease and neonatal respiratory distress, among other short-term complications. On the other hand, in the long term, Caesarean section has been associated with an increased risk of asthma and obesity in children, and complications in subsequent pregnancies, such as uterine rupture, placenta accreta, placenta praevia, ectopic pregnancy, infertility, hysterectomy and intra-abdominal adhesions. The risk of these morbidities progressively increases as the number of previous caesarean deliveries increases. All these mean that the higher these caesarean delivery rates the more the mothers or women in our communities are suffering from these complications. Probably more of such complications are being reported in other hospitals and this is subject for another research.
This study being a cross-sectional study, does not show the trend of caesarean section in the studied hospital; a major limitation. Thus, many more follow-up studies could be necessary. However, this will be beneficial only if an intervention to reduce CSR has been put in place in the hospital, otherwise similar or same picture will still be found even with future studies.
7. RECOMMENDATIONs
The investigator, therefore, recommends that in recognition of the urgent need to address the sustained and unprecedented rise in the use of caesarean section, World Health Organization [WHO], Citation2018b) recommendation on non-clinical interventions to reduce unnecessary caesarean sections must be adopted and implemented in all healthcare organizations. Based on this, the following recommendations are advised.
7.1. Educational interventions for women
Health education for women is an essential component of antenatal care. Therefore, the following educational interventions and support programs are recommended to reduce caesarean delivery with monitoring and evaluation: (a) providing childbirth training workshops for mothers and couples, (b) relaxation training programs led by nurses, (c) psychosocial couple-based prevention programs and (d) psycho-education for women with fear of pain or anxiety.
7.2. Use of clinical guidelines and second opinion
Use of evidence-based clinical practice guidelines combined with mandatory second opinion for caesarean section indication is recommended to reduce caesarean births in settings with adequate resources and senior clinicians able to provide second opinion for caesarean section indication.
7.3. Use of clinical guidelines, audit and feedback
Use of evidence-based clinical practice guidelines, caesarean section audits, and timely feedback to health-care professionals are recommended to reduce caesarean deliveries.
7.4. Use of collaborative midwifery-obstetrician model of care
For the sole purpose of reducing caesarean sections, collaborative midwifery-obstetrician model of care is recommended but in the context of rigorous research. This is a model of staffing based on care provided primarily by midwives, but with 24-h back-up from an obstetrician, who provides in-house labor and delivery coverage without other competing clinical duties.
7.5. Financial strategies
For the sole purpose of reducing caesarean sections, financial strategies for health-care professionals or health-care organizations are recommended but only in the context of rigorous research. This strategy may include insurance reforms that equalize physician fees for vaginal births and caesarean sections.

CONSENT FOR PUBLICATION
The author does consent for publication of this article under open-access journal. Copy rights are reserved.
Acknowledgements
The author does acknowledge and appreciate the corporation of management of St. Joseph’s Hospital _ Kitovu for the supportive environment accorded while this research was being conducted. I appreciate the support of Ms Florence Nassimbwa from Faculty of Agriculture, Uganda Martyrs University to this study.
Disclosure Statement
The author declares no conflict of interest.
Additional information
Funding
Notes on contributors

Omona Kizito
Dr Omona Kizito is a Medical Doctor and Lecturer in the Faculty of Health Sciences (FHS) of Uganda Martyrs University, Kampala. He holds a PhD in Mgt [Healthcare Mgt], Master of Science in Health Services Mgt (MSc. HSM), Master of Science in Monitoring and Evaluation (MSc. M & E), Post Graduate Diploma in Project Planning and Mgt (PGD PPM), Post Graduate Certificate in Project Monitoring and Evaluation (PGC M & E), and Bachelor of Medicine and Bachelor of Surgery (MBChB) degree from Gulu University. He is currently engaged in teaching Public Health and Health Services Management at graduate and post-graduate levels, Research supervision in the said areas and levels, as well as community engagement, among others. His major Research areas are; Clinical Researches, Public Health, and Maternal and Child health and now Child Focus Research.
References
- Adeline, A. B., Anne, S., Ana, P. B., Aluisio, J. D. B., Ties, B., Maria, R. T., & Cesar, G. V. (2018). Within Country inequalities in cesarean section rates: observational study of 72 low- and middle-income Countries. British Medical Journal, 360(55). (Published 24 January 2018). https://doi.org/https://doi.org/10.1136/bmj.k55
- American College of Obstetricians and Gynecologists [ACOG]. (2017). Cesarean delivery: resource overview. [Blog Post]. Available through: https://www.acog.org/Womens-Health/Cesarean-Delivery
- Anon. (2018). CESAREAN DELIVERY RATE [pdf online]. Available at: https://www-doh.state.nj.us/doh-shad/view/sharedstatic/CesareanDeliveryRate.pdf
- Feng, X. L., Xu, L., Guo, Y. and Ronsmans, C. (2011). Factors influencing rising caesarean section rates in China between 1988 and 2008. Bulletin of the World Health Organization 2012, (90), 30-39A. doi: https://doi.org/10.2471/BLT.11.090399
- Feng, X. L., Xu, L., Guo, Y., & Ronsmans, C. (2012). Factors influencing rising caesarean section rates in China between 1988 and 2008. Bulletin of World Health Organization, 90(1). https://doi.org/https://doi.org/10.2471/BLT.11.090399
- Feng, X. L., Xu, L., Guo, Y., & Ronsmans, C. (2018). Factors influencing rising caesarean section rates in China between 1988 and 2008. Bulletin of the World Health Organization, 90(1), 30–39A. 2012. https://do.org/10.2471/BLT.11.090399. Available at: https://www.who.int/bulletin/volumes/90/1/11-090399/en/.
- Festin, M. R., Laopaiboon, M., Pattanittum, P., Ewens, M. R., Henderson-Smart, D. J., & Crowther, C. A. (2009). Caesarean section in four south east Asian countries: Reasons for, rates, associated care practices and health outcomes. BMC Pregnancy and Childbirth, 9(1). https://doi.org/https://doi.org/10.1186/1471-2393-9-17
- Hodin, S. (2017). The global epidemic of unnecessary cesarean section (part 1). [MHTF Blog Post]. Available at: https://www.mhtf.org/2017/01/24/the-global-epidemic-of-unnecessary-cesarean-sections-part–1/
- Israel, G. D. (1992). Determining sample size [pdf on line]. Available at: https://www.tarleton.edu/academicassessment/documents/Samplesize.pdf
- Ji, H., Jiang, H., Yang, L., Qian, X., & Tang, S. (2015). Factors contributing to the rapid rise of caesarean section: A prospective study of primiparous Chinese women in Shanghai. British Medical Journal, 5(11). Available at: https://bmjopen.bmj.com/content/5/11/e008994. https://doi.org/https://doi.org/10.1136/bmjopen-2015-008994
- Karna, J., & Malhotra, V. M. (2017). Prevalence and determinants of caesarean section in a rural community of Nalgonda District, Telangana. International Journal of Community Medicine and Public Health, 4(8). https://doi.org/https://doi.org/10.18203/2394-6040.ijcmph20173365
- Kitovu Hospital Masaka. (2017). OBSTETRIC FISTULA NARRATIVE REPORT FOR THE SECOND CAMP OF MARCH 2017 [online]. Available at: http://www.kitovu-hospital.org/
- Kreuter, M. W., Lezin, N. A., Kreuter, M. W., & Green, L. W. (2003). Community Health Promotion Ideas That Work (2nd Ed). Jones and Bartlett Publishers.
- Lauer, J. A., Betrán, A. P., Merialdi, M., & Wojdyla, D. (2010). Determinants of caesarean section rates in developed countries: Supply, demand and opportunities for control. World Health Report (2010) Background Paper, 29. Available at: https://www.who.int/healthsystems/topics/financing/healthreport/29DeterminantsC-section.pdf
- Liu, S., Liston, R. M., Joseph, K. S., Heaman, M., Sauve, R., & Kramer, M. S. (2007). Maternal mortality and severe morbidity associated with low-risk planned caesarean delivery versus planned vaginal delivery at term. CMAJ, 176(4), 455–30. https://doi.org/https://doi.org/10.1503/cmaj.060870
- Manyeh, A. K., Amu, A., Akpakli, D. E., Williams, J., & Gyapong, M. (2018). Socioeconomic and demographic factors associated with caesarean section delivery in Southern Ghana: Evidence from INDEPTH network member site. BMC Pregnancy and Childbirth, 2018. 18(1), 405. Available at: https://doi.org/https://doi.org/10.1186/s12884-018-2039-z
- Ministry of Health [MoH]. (2018).
- Mohd-Nor, N., & Bit-Lian, Y. (2019). Knowledge, attitude and practices of standard precaution among nurses in Middle-East Hospital. SciMedicine Journal, 1(4). https://doi.org/https://doi.org/10.28991/SciMedJ-2019-0104-4
- Natasha, S. (2016). Cesarean section rates and indications at MRRH. [Pdf]. Available at: https://nmfonline.org/wp-content/uploads/2016/02/2011-Uganda-Spencer-N.pdf
- Omona, K. (2021). Replication data for determinants of caesarean section rates in private-not-for-profit healthcare facilities: St. Joseph’s Hospital_ Kitovu. Harvard Dataverse, V1. https://doi.org/https://doi.org/10.7910/DVN/BYGYY9
- Oonagh, E. K., Norman, J. E., & Stock, S. J. (2018). Long-term risks and benefits associated with cesarean delivery for mother, baby, and subsequent pregnancies: systematic review and meta-analysis. PLOS, 15(1). https://doi.org/https://doi.org/10.1371/journal.pmed.1002494
- Organization of Economic Co-operation for Development [OECD]. (2017). Health at a Glance 2017: OECD indicators [pdf online]. Available at: https://www.oecd-ilibrary.org/docserver/health_glance-2017en.pdf?expires=1560593145&id=id&accname=guest&checksum=80045C34D5872D3DCEBCAAC704326654
- Parazzini, F., Pirotta, N., La Vecchia, C., & Fedele, L. (1992). Determinants of caesarean section rates in Italy. British Journal of Obstetrics and Gynaecology, 99(3), 203–206. https://doi.org/https://doi.org/10.1111/j.1471-0528.1992.tb14499.x
- Paudel, D. R. (2019). Catastrophic health expenditure: an experience from health insurance program in Nepal. Emerging Science Journal, 3(5). https://doi.org/https://doi.org/10.28991/esj–2019–01195
- Polonia, G. (2013). Analysis of sample size in consumer surveys [pdf on line]. Available at: http://ec.europa.eu/economy_finance/db_indicators/surveys/documents/workshops/2013/pl-gfk_k._pusczak_-_sample_size_in_customer_surveys_v2_2.pdf
- Price, P. C., Jhangiani, R., & Chiang, I. A. (2018). RESEARCH METHODS IN PSYCHOLOGY [blog post]. Available at: https://opentextbc.ca/researchmethods/chapter/reliability-and-validity-of-measurement/
- Puia, D. (2018). First-time mothers’ experiences of a planned caesarean birth. Journal of Perinatal Education, 27(1). https://doi.org/https://doi.org/10.1891/1058-1243.27.1.50
- Rahman, M. M., Haider, M. R., Moinuddin, M., Rahman, A. E., Ahmed, S., & Khan, M. M. (2018). Determinants of caesarean section in Bangladesh: cross-sectional analysis of Bangladesh demographic and health survey 2014 data. Plos One, 13(9). https://doi.org/https://doi.org/10.1371/journal.pone.0202879
- Robson, S. J., & De Costa, C. M. (2017). Thirty years of World Health Organization’s target on caesarean section rate: Time to move on [pdf]. NCBI, 206 (4). Available through: https://www.ncbi.nlm.nih.gov/pubmed/28253469
- Runmei, M., Terence, T. L., Yonghu, S., Hong, X., Yuqin, T., Bailuan, L., Minghui, Y., Weihong, Y., Kun, L., Guohua, L., Hongyu, L., Li, G., Renmin, N., Wenjin, Q., Zhuo, C., Mingyu, D., Bei, Z., Jing, X., Yanping, T., Lan, Z., … Dandan, Z. (2012). Practice audits to reduce caesareans in a tertiary referral hospital in south-western China. Bulletin of World Health Organization, 90(7). https://doi.org/https://doi.org/10.2471/BLT.11.093369
- Sanni, Y., Olalekan, A. U., Agbessi, A., & Ghose, B. (2018). Disparities in caesarean section prevalence and determinants across sub-Saharan Africa countries. BMC Global Health Research and Policy, 3(1).
- Stivanello, E., Rucci, P., Lenzi, J., & Fantini, M. P. (2014). Determinants of cesarean delivery: A classification tree analysis. BMC Pregnancy and Childbirth, 2014. 14(1), 215. Available at: https://doi.org/https://doi.org/10.1186/1471-2393-14-215
- Tidy, C., & Payne, J. (2019). Gravidity and parity definitions: implications in risk assessment [blog post]. Available at: https://patient.info/doctor/gravidity-and-parity-definitions-and-their-implications-in-risk-assessment
- UN General Assembly. (2015). Transforming our world: The 2030 agenda for sustainable development, 21 October 2015, A/RES/70/1. Available at: http://www.refworld.org/docid/57b6e3e44.html.
- University of Twente. (2002). Communication studies theories: theory of planned behaviour (TPB)/reasoned action [blog post]. Available at: https://www.utwente.nl/en/bms/communication-theories/sorted-by-cluster/Health-Communication/theory-planned-behavior/
- Wanjari, S. (2014). Rising caesarean section rate: a matter of concern? International journal of reproduction, contraception, obstetrics and gynecology, 3, 728–731
- World Health Organization [WHO]. (1985). Appropriate technology for birth. Lancet 1985, 2, 436–437.
- World Health Organization [WHO]. (2015). WHO statement on caesarean section rates [pdf]. Available at: http://apps.who.int/iris/bitstream/handle/10665/161442/WHO_RHR_15.02_eng.pdf?sequence=1
- World Health Organization [WHO]. (2018a). WHO recommendations: Non-clinical interventions to reduce unnecessary caesarean sections [pdf]. Available at: https://www.who.int/reproductivehealth/infographic-unnecessary-caesarean-section.pdf
- World Health Organization [WHO]. (2018b). WHO recommendations: Non-clinical interventions to reduce unnecessary caesarean sections [pdf online]. Available at: https://www.who.int/reproductivehealth/infographic-unnecessary-caesarean-section.pdf
- World Health Organization [WHO]. (2018c). WHO recommendations: Non-clinical interventions to reduce unnecessary caesarean sections. Author.
- Yang, F., Zhang, Q., Kong, W., Shen, H., Lu, J., Ge, X., & Zhuang, Y. (2018). A qualitative study on the attitudes of patients with gastrointestinal cancer toward being informed of the truth. Patient Preference and Adherence, 12. Available at: https://www.dovepress.com/a-qualitative-study-on-the-attitudes-of-patients-with-gastrointestinal-peer-reviewed-fulltext-article-PPA. https://doi.org/https://doi.org/10.2147/PPA.S179465
Appendix I:
Questionnaires

Appendix II:
Interview Guide with Post-Operative Mothers
If you delivered by C-Section, please share with me your experiences before delivery
Qn1.Did you anticipate any difficulty with your delivery? [Self-evaluated difficulty in getting pregnant] ………………………………………………………………………………………………………………………………………………………………………………………………………………………………………………………………………………………………
Qn2.What did your husband prefer as the mode of your delivery? [Husband’s preference of delivery mode]
………………………………………………………………………………………………………………………………………………………………………………………………………………………………………………………………………………………………
Qn3.Did the doctor suggest the mode of delivery to you? Explain. [Doctor’s suggestion]
………………………………………………………………………………………………………………………………………………………………………………………………
Qn4.Have you been counselled about delivery? How was the counselling? [Counselling directed toward preferred choice]
………………………………………………………………………………………………………………………………………………………………………………………………
Thank you for your time and response
Appendix III:
Observation Check List
Appendix IV:
Key Informant Interview Guide
SECTION D – Key Informant Interview Guide for Health Managers
Kindly share with me your views on the following questions
Qn1. What do you think about the Caesarean Section Rate (CSR) in this health facility?
………………………………………………………………………………………………………………………………………………………………………………………………………………………………………………………………………………………………
Qn2. Do you do regular monitoring and evaluation of activities in this health facility? If so, how often?
………………………………………………………………………………………………………………………………………………………………………………………………………………………………………………………………………………………………
Qn3. Has top management ever done monitoring and evaluation of CSR in this health facility? If so, what did they find?
………………………………………………………………………………………………………………………………………………………………………………………………………………………………………………………………………………………………
Qn4.What is your view about regularizing monitoring and evaluation of Caesarean Section Rate (CSR) in this hospital?
………………………………………………………………………………………………………………………………………………………………………………………………………………………………………………………………………………………………
Qn5.Do you recommend an internal or external M & E officer to do the exercise?
……………………………………………………………………………………………………
Thank you for your time and response