
 ?Mathematical formulae have been encoded as MathML and are displayed in this HTML version using MathJax in order to improve their display. Uncheck the box to turn MathJax off. This feature requires Javascript. Click on a formula to zoom.
Abstract
The decades-long history of friendly relationship in both countries bore the fruits in the form of Pakistan–China free-trade agreement (PCFTA) in 2006. This paper aims to estimate Pakistan’s bilateral trade potential with China by employing gravity model of trade in a panel data set covering the period 1992–2015. In an attempt to obtain unbiased results we have utilized various estimation methods as suggested by the recent empirical literature on gravity equation to acquire the maximum variation in results. The results from EGLS, REM, two-stage EGLS, GMM, Tobit and PPML have shown that Pakistan’ bilateral trade with all FTA partner countries is positively affected by GDPs, religion, WTO, trade openness in both countries and the common border; whereas negatively affected by geographical distance and inflation. It is also stated that common language and (Trade Agreements) PTA found to be pessimistically exaggerated bilateral trade of Pakistan with FTA partners. The overall PTA effect is negative and highly significant albeit we have found immense trade potential of Pakistan in case of China by most of the estimation techniques. The industry of Pakistan and exporters should adopt new measures to boost and diversify the exports to China and to bring about a reasonable equality in mutual trading relations.
Public Interest Statement
The continuing trend of globalization has made International trade one of the most extensively researched topics in the economic literature. This study examines the Pakistan’s bilateral trade with countries who established the trade agreements to enhance their trade internationally. The world has been continuously transforming in many ways since Pakistan and China established diplomatic relationship 65 years ago. However, in our relations, nothing has changed in terms of mutual understanding and cordiality. Pakistan signed trade agreement with China in 2006, since then Pakistan attempts to enhance their exports to China. We have proved from our gravity estimation by using multiple estimation techniques that both nations have potential to expand their trade. Besides, the findings suggest that Pakistan has weak supporting industries so he has heavily relied on imports for his exports. Pakistan should move towards increasing the export of agricultural, textile and manufactured goods and diversified its exports to China to manipulate his trade balance.
1. Introduction
International Trade relations among nations are becoming increasingly important in a rapidly changing world, and foreign affairs and global issues among states have become more obvious within the international system. International Trade established its own identity in the global world. All the way through human history, people acquired knowledge from their environment and get influenced by immediate nations. The nation learned and developed their lives by the acquisition of skills and mode of life that suits them. Even at present, this process has not congested. Different nations that have dissimilar demographics and history adopt and gain knowledge from each other. The cultural diversity between countries has its consequence on trade in a complex way. Furthermore, trade among nations has its special effects on culture. Correspondingly, there is a high possibility that nations with common cultural attributes might trade more. Although trade is built on comparative advantage, subsequently with diverse culture, higher trading may be possible (Cyrus, Citation2011). The benefits from trade could differ from country to country based on its national welfare, economic, political, regional and strategic state of affairs. Countries tend to agree upon mutual free-trade agreement when multilateral liberalization is unattainable. The more free-trade could facilitate to boost in national welfare.
The politics of modern world is changing every day and all developing countries look for new markets to survive in all situations (Irshad & Xin, Citation2014). Keeping above objective in mind, Pakistan like other nations is also altering its direction of policies towards growing efforts to grasp gains from trade through plurilateral and bilateral agreements. Bilateral relations seek mutually advantageous arrangements with the goal of reducing tariffs and eliminating non-tariff barriers (NTBs). Appendix in appendix demonstrates the recent trade agreements of Pakistan with other regional blocs and nations in the world, especially immediate neighbours particularly China. The Islamic Republic of Pakistan and the People’s Republic of China have adored long-lasting and friendly ties—regardless of their ideological differences, evident in their very names (Irshad, Xin, & Arshad, Citation2015). Pakistan and China are both members of World Trade Organization (WTO) and in accordance with Article XXIV of General Agreement on Tariffs and Trade (GATT), WTO members are allowed to enter into bilateral or regional agreements provided they cover a large number of bilateral trade flows and they do not have net trade diversion effect. Both the nations have dissimilar economic structures and constructed accordingly. According to WTO policy review, China continues to expand its bilateral and regional free-trade agreements (Xin, Irshad, & Hao, Citation2014).
Rising trend in globalization and new realities that are emerging on the international horizon is also pushing Pakistan to reassert its position in East Asia and chase for a pro-active policy towards China (Irshad, Xin, Xuan, & Arshad, Citation2016). Pakistan has recently witnessed a significant increase in exports as a result of rapid improvement in the international trading environment. During 2015, Pakistan’s exports remained at US$ 25.5 billion which is 9.44% of gross domestic product (GDP), while import remained at US$ 44 billion which is 16.29% of GDP in the same year. Similarly, Pakistan imports share with China in the year 2015 account US$ 11.08 billion which is 25.18% of total imports, while Pakistan’s share of exports to China accounts US$ 1.93 billion which is 7.56% of total exports of Pakistan to the world in the same year (Irshad & Xin, Citation2015a). Trade policy in Pakistan has a significant role in growing or lessening overall exports of Pakistan. Pakistan’s economy has depended on the agricultural sector in the premature stages of development, because of lacking in industrial base and infrastructural capability in the early stage of development (Irshad & Xin, Citation2017a). Table reveals the values of Pakistan’s overall imports and exports with the world and specifically with China.
Table 1. Pakistan total imports and exports to world and China (million US$)
After signing FTA, both countries experienced an upward trend in bilateral trade which resulted in rapid increase of imports US$ 11 billion in 2015 which is calculated 278% growth rate compared to US$ 2.91 billion in 2006. China has obtained substantial advantage after signing the FTA with Pakistan. China has established win-win relationships in its targeted market by providing common benefits to its counterparts (Irshad & Xin, Citation2015b). Pakistan exports to China recorded slow growth rate compared to imports from China. Both countries should restudy the tariff elimination processes and reduce the tariff on maximum goods traded between them. Such as, FTA between China and South Korea will officially come into force starting 20 December 2015. Under the deal, both countries eliminated the tariff on more than 90% of highly traded goods within 20 years after the implementation (Hua Xia, Citation2015). That is what Pakistan seeks from China; an elimination of tariff should be on highly traded goods not at the limited goods. Keeping the above intention in mind, current study endeavours to expose the most imperative and the key influential factors of Pakistan’s bilateral trade with China. Trade literature studies confirm that bilateral trades between nations are affected by several factors and variables. These factors range from income to the level of development of countries, the general distinctiveness of a population such as common language, common history or religion to shared border. In this paper, we will use the gravity model of trade to check the influence of Pakistan’s bilateral trade with China and will estimate the trade potential for Pakistan in the Chinese market. Economic hypothesis and empirical evidence have obviously established the relations between trade, productivity and economic development. Countries that have bulky internal markets have also gained from desegregation into the global economy and opening up their economies (Irshad, Xin, Hao, & Arshad, Citation2017; Irshad et al., Citation2018). Gravity model has become the most important tool in international trade analysis over the years. Other “flagship” trade theories are useful for determining the ground of export/imports performances. However, it is gravity that enables to determine and predict actual trade flows or economic consequences of the establishments of preferential trade agreements Brodzicki, Ciołek, and Śledziewska (Citation2017). In this article we have attempted to examine Pakistan’s bilateral trade with only considering FTA countries of Pakistan and to get trade potentials only for China through a gravity model approach by multiple estimation techniques suggested by previous literature. Therefore, this study leads to make new research results for scholars and policymakers.
Its remainder proceeds as follows. Section 2 briefly explained the literature related to our study and on gravity model theoretical and empirical approach. The model specification, data sources and methodological aspects are introduced in Section 3. While Section 4 reports and discusses estimation results from gravity model by using various estimation techniques and the potentials for Pakistan and China future trade. Finally, Section 5 concludes with policy implications.
2. Literature review and gravity model
Today’s world in the epoch of globalization seeing as the beginning of the third millennium because economies started out to be integrated since then in terms of goods, traditions, trade, investments and various others factors (Irshad et al., Citation2016). Before starting off with the gravity model, it might be a good initiative to elucidate the dissimilar trade flow modelling techniques existing and why gravity model is the alternative for this meticulous research work. Trade flow modelling has been broadly explored throughout the past three-four decades using two techniques, simulation models and econometric models (Jong, Hugh, Warren, & Jenny, Citation2002; World Bank, Citation2005). The major fundamental dissimilarity between both models is (a) simulation models intend to study and analyse the trade flows and its impact, while (b) econometric models endeavour to formulate future forecasts anchored in past trade flow patterns. Similarly, econometric approaches for modelling trade flows have focused on the gravity model pattern because of the robust performance of the model and the inadequate need for parameter assumptions. Therefore, the plenteous literature on gravity models and their application in trade flows have materialized during the last decade and for the similar reasons of robustness and simplicity, this article exploits the gravity model of trade. The gravity model is derived from Newton’s Law of Universal Gravitation which states that the gravitational attraction between two objects is directly proportional to their masses and is inversely proportional to the square of their distance. Moreover, plentiful researchers endowed with the theoretical justifications by estimating the model with diverse sets of variables and conditions. For instance, Linnemann’s (Citation1966) presented partial equilibrium model of export and import, and added an additional variable to the model to reflect the trade flow composition, is a traditional application of the gravity model. After that, Leamer (Citation1974) customized the model with additional variables to determine the impact of income and population. Another research by Anderson (Citation1979) derived the model by applying utility functions and product differentiation. In a series of papers, Bergstrand (Citation1985, Citation1989, Citation1990) has formed several attempts so as to explore the theoretical determination of trade by utilizing Constant Elasticity of Substitution (CES) and monopolistic competition models. Helpman and Krugman (Citation1985) derived the gravity model under the assumption of increasing returns to scale in production. Deardorff’s (Citation1998) research proved that gravity model is consistent with Hecksher-Ohlin trade theory. Whereas Anderson and van Wincoop (Citation2001) provided an understanding of how border barriers affect trade. Baier et al. (Citation2002) explained the endogeneity of international trade flows and free-trade agreements by employing gravity approach. Evenett and Keller (Citation2002) theoretically explained the success of gravity equation and they have proved that gravity is the best approach to modelling trade-related flows. In another study, Martinez-Zarzaso (Citation2003) evaluated the effects of preferential agreements on the bilateral trade flows among 47 countries in several economic blocs and areas during 1980–1999. Papazoglou (Citation2007a) endeavored to discover potential trade flows for Greece to the EU member states by employing a gravity model. In his conclusion, he stated that actual exports of Greece fall short of potential ones, while the opposite is true for Greek imports. Xuegang, Zhaoping, and Xuling (Citation2008) used the three explanatory variables GDP, GDP per capita and Shanghai Cooperation Organization (SCO) to construct a gravity model for Xinjiang’s bilateral trade. Their outcome illustrated that all the three variables distress the Xinjiang’s bilateral trade. The dissimilarities in above mention theories are facilitated to explain the various diversities in the outcome of the empirical applications. In a nutshell, in last 50 years, numerous attempts have been put in the empirical analysis of international trade to enlighten bilateral trade through the gravity model of trade (Disdier & Head, Citation2003; Kepaptsoglou, Karlaftis, & Tsamboulas, Citation2010). Irshad et al. (Citation2018) also applied gravity model to estimate China’s trade pattern with OPEC member countries over the period 1990–2016. They have found that China’s bilateral trade with OPEC members positively impacts GDP, income (GDP per capita), trade openness in China and the WTO member countries in OPEC while the negative influence on distance. A multitude of empirical applications of the gravity model exists in the literature of bilateral trade, which has contributed to the perfection of performance in the gravity equation.
A simple baseline gravity model which can be written as an equation:
where refers to the total trade volume between country i and country j,
and
are the gross domestic products of the countries i and j,
taken as the trade cost, a proxy variable for the geographical distance between both countries, whereas
is the stochastic error term and C, β and γ are the coefficients to be derived empirically. The above equation is transformed into log-linear form so that it conforms to the usual regression analysis and can be written as Equation (2):
Equation (2) is the traditional gravity model and once estimated provides with comparatively good results. On the other hand, the actual world situation is not so easy to be represented by such a few factors. In addition to the habitual variables of GDP and distance, researches in this particular field have often employed other factors like GDP per capita (Bun & Klaassen, Citation2007; Kang & Fratianni, Citation2006), population (Elliott, Citation2007; Tzouvelekas, Citation2007; Papazoglou Citation2007b), exchange rates (Kandogan, Citation2005; Tang, Citation2005; Thorpe & Zhang, Citation2005), geographic size (Kucera & Sarna, Citation2006; Soloaga & Winters, Citation2001), infrastructure (Carrere, Citation2006; Martinez et al., Citation2005), common country characteristics like language, border, currency unions, signatories to bilateral trade agreements (Grant & Lambert, Citation2008; Irshad & Xin, Citation2017a; Melitz, Citation2007), etc., to efficiently identify the most imperative factors distressing the bilateral trade between countries.
3. The model, sample and data size
3.1. The model
At first, this study will establish a gravity model of bilateral trade for Pakistan. Then, the estimated model will be used to forecast the potential trade between Pakistan and China. The gravity model of bilateral trade in our case is that trade between Pakistan being country (i) and FTA country (j) is a function of their particular GDPs, and the geographic remoteness between the trading partners and hence can be written as:
After reviewing previous researchers and detailed approaching hooked on the trade patterns of Pakistan with FTA countries and especially to take into consideration current study requirements Pakistan’s bilateral trade with China (before and after) signing FTA, the following set of variables are taken into consideration. Equation (3) then becomes:
where represents natural log of bilateral trade volume between countries i and j in a particular year t,
is the natural log of product of GDPs of the Pakistan and its trade partner in year t. The
is natural log of Inflation in Pakistan and its trading partner country in year t.
and
trade openness in Pakistan and partner country in year t respectively.
is a religion, a dummy variable, given a value of 1 if a country’s national religion or more than 80% of the population of that country follows the same religion as the partner country or 0 otherwise. Meanwhile,
stands for common language also a dummy given a value 1 if both countries speak same language. Where,
Border, dummy variable, which is given a value of 1 if countries i and j shares a common border or a value of 0 otherwise.
is a dummy, with a value of 1 if the country i and country j are members of the World Trade Organization in year t or 0 otherwise.
also a dummy variable, if country i and country j having trade agreement in particular year t then given a value of 1 otherwise 0.
The justification for the inclusion of GDP and trade cost variables in the equation is clearly manifested being these parts of the standard gravity model specification. Whereas GDP of Pakistan and its trading partner in time t are used as a measure of economic size. This variable is expected to be positive and significantly related to trade. Trade cost variable is used in the analysis as a proxy for transportation cost between Pakistan and the trading partners. This variable is expected to have a negative effect to trade as transport cost increases with the distance between countries. The rest of the variables are explained as follows.
To check the effect of inflation at the bilateral trade of Pakistan with her trading partner we have employed inflation as a proxy for GDP deflator in our model. Inflation, as measured by the yearly growth rate of the GDP implicit deflator, demonstrates the rate of price change in the economy as a whole. The GDP implicit deflator is the ratio of GDP in current local currency to GDP in constant local currency. We are expecting the negative sign of the inflation.
The more open a country, the greater its involvement in the trade. The proportion of customs-to-total tax revenues or the trade-GDP ratio can be used as proxies for openness. However, the latter proxy is often professed for obvious reasons. Hence, we also use this variable as a proxy for openness, first and foremost because data is available for the countries concerned.
We have employed four dummy variables in our regression such as religion, border, WTO, PTA. Religion and language are cultural variables included in the estimation to understand their effects on the bilateral trade flow of Pakistan with FTA countries. The hypothesis is that countries with the same culture tend to trade more and vice versa. Countries that share a common border are likely to have strong bilateral trade relations, and hence the variable is expected to have a positive effect on trade. Border variable has a value of 1 if partner country shares a common border. The variable representing the membership of countries into the World Trade Organization, WTO, is included to find whether being part of this organization can have an effect on the bilateral trade between countries or not. This variable is expected to be positive and significant. PTA is another dummy variable used to explain the trade pattern between two countries. A value of 1 is given if country i and country j has a trade agreement or given a value of 0 otherwise. PTA is expected to have positive and a significant effect on the trade.
3.2. Sample size and data source
The dataset is a balanced panel containing annual total merchandize trade volume (merchandize imports+ merchandize exports), GDP, distance, Inflation, Trade openness, and dummies of Pakistan and 25Footnote1 of its trading partners including China. We have selected those countries that have signed a free-trade agreement or any preferential trade agreement with Pakistan, some of the countries have one-to-one signed FTA or some are the part of regional trade agreement (see Appendix in the appendix). Data is collected for the time period ranging from 1992 to 2015 and total observations are (24 × 25 = 600). Our analysis starts in 1992 because several trading partners’ transition took more time and there was no trade data available for the previous years. Table demonstrates the summary of variables that we have used in our model and the data sources from where we get data and make some manipulation to get fit into our model. For the descriptive statistics of the gravity equation used in this study is placed in Appendix .
Table 2. Demonstrates the variables, expected signs and data sources
4. Estimation results and discussion
4.1. Panel cross-section dependence (CD) test
Cross-section dependence in macro panel data has acknowledged loads of consideration in the emerging panel time series literature over the past decade. This kind of correlation possibly will occur from worldwide common shocks with heterogeneous impact across countries, such as the oil crises in the 1970s or the global financial crisis from 2007 onwards. Alternatively, it can be the result of local spillover effects between countries or regions (Eberhardt & Teal, Citation2011; Moscone & Tosetti, Citation2009). Before estimating gravity equation, CD test should be tested to observe whether the sample data are cross-sectionally dependent or independent. Otherwise, based on the assumptions (Breusch & Pagan, Citation1980; Pesaran, Citation2004), the results of our gravity equation would be prejudiced and incompatible. In accordance with the time and cross sections in our gravity equation, Pesaran’s (Citation2004) residual CD test is calculated anchored in the pairwise correlation coefficients in this fashion:
We calculated CD test only for time-variant variables in our gravity equation because of CD test unable to define in case of time-invariant variables (Esfahani & Rasoulinezhad, Citation2017; Irshad, Xin & Arshad, Citation2018). Based on the result of Pesaran’s (Citation2004) CD test, shown in Table , the null hypothesis (no CD in residuals) can be strongly rejected at the 5% level. It implies that all the panel time series have strong evidence for cross-sectional dependence.
Table 3. Pesaran’s (Citation2004) CD test
4.2. Gravity model estimation
In order to determine the CD test, we have endeavoured to apply diverse techniques founded in literature and mostly found that our model accurately fits the gravity theory. The techniques we used to calculate Pakistan’s bilateral trade with FTA countries all appear with highly significant effect. We have found that the results of different estimation techniques somehow comparable such as EGLS predict the similar results as GMM whereas two-stage EGLS appeared with the similar results like Tobit and latterly REM and PPML results are different. We have estimated same model with six estimation techniquesFootnote2 as suggested by recent literature to get maximum variations in our gravity model. At first, we have used panel EGLS with cross-section weights and found that the R-squared 0.87 similar like GMM which is considered as good level and all variables are highly significant with expected signs except common language and regional trade agreements. This may be the interesting finding of this paper as the overall effect of FTA on Pakistan’s bilateral trade is negative because the trade environment is not favourable to Pakistan and it mostly results in the trade deficit. In case of joint GDP, the results reveal that a 1% increase in the joint GDP of Pakistan and FTA partner countries raises the bilateral trade volume by approximately 1.9%Footnote3 to 0.59% (maximum and minimum coefficient value we get) by using different estimation. It can be noticed that REM, TEGLS and Tobit predict little lower increase rate compared to other techniques (see Table ). The distance used as a proxy for trade costs negatively effect on bilateral trade of Pakistan with FTA member counties longer the distance lessen the trade. 1% rise in distance decreases the trade volume by 1.2% [= exp(0.15)] to 0.21%, maximum calculated by PPML whereas minimum by Tobit and TEGLS.
Table 4. Results of gravity model (dependent variable: total trade of Pakistan with FTA partner country)
With regard to the inflation, among our estimations, this variable appears statistically significant and negative at the 1% level. The results show that by 1% increase in the inflation rate in Pakistan, FTA partner country will reduce the bilateral trade by 1.2–0.2% which means people will have more money to buy products. This raises demand, which raises the price of goods in a country which results in need of more money to buy the same product which was earlier bought at low price.
The findings of all the six methods provide the evidence of the strong positive impact on the trade openness in Pakistan and FTA countries. A 1% increase in Pakistan’s trade openness level raises the bilateral trade volume by 10.75% (maximum calculated by PPML and minimum EGLS and GMM) to 2.61%. Similarly, 1% increase trade openness in the FTA partner country raises the bilateral trade volume by 2–0.7%.Footnote4 The results of our model clarified that there is definite potential in Pakistan and FTA partner countries to expand their bilateral trade. In case of common religion, Pakistan tends to trade more with them and our model results also bystander for the theory “the courtiers have common religion tend to trade more”. Religion variable is highly significant and positively influences bilateral trade of Pakistan with FTA partner countries which is calculated as 1% increase in common religion countries leads bilateral trade by 1.18% [= exp(0.78) − 1] to 0.36% [= exp(0.31) − 1]. It is obvious because in our sample of 25 countries and 15 countries have a common religion like Pakistan (Islam). Another phenomenon sharing the same language also boosts trade among partners but in our case, it shows a negative effect on Pakistan bilateral trade with FTA partners because only seven countries have the same language as Pakistan official language is English and the trade ratio is larger with those counties whose language is not the same. In our model, it is estimated as 1% increase in common language countries decreases bilateral trade by 0.21–0.25%Footnote5 respectively.
Similarly, in case of the Common border, it is always a privilege to trade with neighbour countries because many factors might have less impact such as trade cost and cultural influence. Our model estimation also proved that Pakistan tends to trade more with neighbouring countries such as Afghanistan, China, and Iran but with India, there are some political constraints. A 1% increase in common border country enhances bilateral trade by 11.55% [= exp(2.53) − 1] to 0.67% [= exp(0.51) − 1] where the maximum coefficient estimated by REM and the minimum coefficient value by PPML. It is common that countries have WTO membership trading more with each other because they are somehow bound to reduce the tariff on trade. In our case, the coefficient of WTO membership is estimated with a maximum value at 2.53–0.01% respectively. This indicates that bilateral trade of Pakistan increases by nearly 2.53% (by EGLS and GMM) when Pakistan trades with WTO member countries.
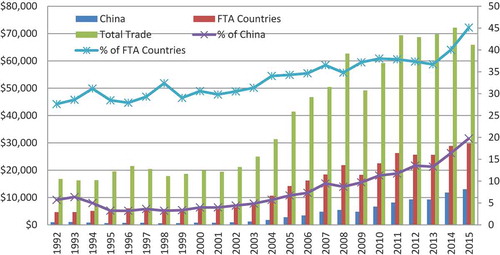
With regard to the trade agreements, surprisingly we have found a negative and highly significant effect on Pakistan bilateral trade with FTA countries which is strange because Pakistan’s trade with countries who have already signed a trade agreement with Pakistan is under potential and not fully utilized. Other researchers also find the negative or ambiguous effect of trade agreements on trade (Robert et al., Citation2015). Figure in the appendix shows that Pakistan’s trade within direction such as trade with China, FTA countries and total trade also with percentage share. Despite this, we have calculated that Pakistan has huge trade potential, particularly with China by most of the estimation methods. China and Pakistan should make fruitful arrangements to enhance their mutual trade and to reduce trade barriers and also provide maximum market access to each other.
Figure 1. Results for Pakistan’s trade potential with China.
Source: Authors estimation based on gravity equation 4 results.
Figure A. Pakistan’s trade with world and FTA countries and percentage share (US$ million).
Source: Authors’ own calculation based on UN Comtrade database and ITC trade map 2017.
The log-linear model is used to tackle the dilemma of heteroskedasticity and serial correlation in the panel regression model. The value of the F-statistic shows the goodness of fit of the regression model. The forecasting efficiency of the model is evaluated using Mean Abs. Error, Thiel Inequality Coefficient, and corresponding Bias and variance proportion. The outcome of diagnostic tests recommends using the model for evaluation of trade potential of Pakistan, particularly for China.
4.3. Estimation of trade potentials
Finally, the estimation of Pakistan’s trade potential for China is calculated. The results obtained from the gravity equation 4 are subject to evaluation of the forecasting efficiency. We have estimated gravity model for Pakistan vis-à-vis 25 countries those who have already signed FTA with Pakistan for a fairly long period (1992–2015) with total 600 observations. We do not have zero trade in our sample. The calculation for estimating Pakistan’s trade potential for China is (). In other words, it represents the absolute difference between the potential (predicted) and the actual level of trade (P − A) where a positive value implies the possibility of trade expansion in the future while a negative value shows that Pakistan has exceeded its trade potential with China. Figure shows the trade potential of Pakistan with China for each technique we used to estimate our gravity model equation. Our results for most of the estimation techniques show that Pakistan has clear trade potential with China. After signing Pakistan–China FTA trade figures between these two countries witnessed that higher trade values and for future is great opportunity for Pakistan to explore markets in China’s huge population. Even though, Pakistan gaining trade deficit whilst trading with China because of less export diversity and lack of expertise in exports competiveness of Pakistan. Pakistan exports to China have more than tripled from US$ 506 million in beginning of FTA year 2006 to US$ 1.9 billion in year 2015 but are still far below the potential. Pakistan lacks a comprehensive country-specific strategy. The private sector and all the ministries and state-run institutions need to coordinate their efforts to penetrate into the Chinese markets. Pakistan continues to run a huge trade deficit with China. Whereas China has moved to high value-added, high-tech exports Pakistan still exports low value-added items. There is need to step up production of globally competitive products and improve marketing skills to create additional demand for exports. Pakistan should also focus on exporting some value-added raw materials to China like cotton yarn of higher counts and fabrics of better quality. A huge potential exists there for exports of leather, chromium ore, copper and chemicals, surgical instruments, sport goods, light engineering products, finished granites, onyx and marbles, gem and jewellery, furniture, handicrafts, food items and fruits and vegetables. But as higher incomes have made Chinese consumers quality-conscious, all exports must meet new standards.
From the above graphs, we can see that only REM and PPML have shown that Pakistan trading potential with China is getting exhausted and other all estimation results clearly predict the huge trade potential for Pakistan to expand its trade with China. The study urges Pakistan to develop domestic supply potential and diversify its exports to potential economies particularly China and Pakistan should talk with China to reduce more tariff barriers on Pakistan imports and provide extra market access to Pakistani products.
5. Conclusion and policy implication
In our study, we investigated the effect of Pakistan bilateral trade with FTA partner countries and regional trade agreements, particularly for China to evaluate with trade potential. The data form years 1992–2015 were analysed to estimate Pakistan–China bilateral trade potential. We have tried to use maximum estimation techniques such as EGLS, REM, two-stage EGLS, GMM, Tobit and PPML. All the estimation results appeared with highly significant and expected signs except language and PTA. Our estimation proved that both countries’ GDPs and trade openness have great influence on Pakistan bilateral trade with China and other FTA countries. The border effect also factors Pakistan to maximize its trade relation with China. Both counties are members of WTO, therefore, it is also a huge opportunity for both countries to minimize tariff on greatly traded goods and to provide maximum market access to each other’s products. From our study, most of the potential equations show that Pakistan has room to expand its bilateral trade with China especially the exports to China. Pakistan and China signed an agreement in the year 2006 since then the trade between both counties has been growing rapidly but China’s share getting larger in Pakistan imports and Pakistan failed to increase its exports to China. In South Asia, China only has FTA with Pakistan which is the great opportunity for both counties to maintain their trade balance and continue mutual economic cooperation. Impact of free-trade agreements on the economy of a country still lingered a contentious concern and these effects vary from country to country. Sometimes, free-trade agreement and trade liberalization policies may also adversely impact local industry of a country. Successful implementation of free-trade agreement would lead to a reduction or elimination of import tariffs that could have a negative impact. Pakistan–China FTA is helpful in achieving export-led growth policy of Pakistan. Our results show that trade between Pakistan has increased exports to China but less than imports so that both countries must continue their policies to further improvement in bilateral cooperation and to minimize the trade deficit.
Taken as a whole, it can be noted that following other factors influencing Pakistan’s bilateral trade with FTA countries such as geopolitical concerns, tariffs and pricing and import substitution policy, the authors recommend future research studies with larger data about these factors giving better results and fewer errors. Additionally, future avenues of research should consider the estimation of the gravity model with some other variables or industrial and product level for exports and imports separately. However, from our point of view, this research, proves useful and has some interesting findings, which can help economists and policymakers to achieve a better view of Pakistan’s bilateral trade with FTA countries and specifically with China.
Additional information
Funding
Notes on contributors
Muhammad Saqib Irshad
Muhammad Saqib Irshad is a Pakistani national, He earned PhD from Tianjin University of Finance and Economics in major International Economics and Trade. His research mainly focused on Asia’s foreign trade, China’s Belt and Road initiative and China-Pakistan economic corridor & various Macroeconomics fields. He earned Master degree also from China, Northeast Normal University in major International Trade.
Qi Xin
Prof. Qi Xin is the head of department of international education in Tianjin University of Finance and Economics. Her primary research fields include International trade and economics and Intellectual property rights.
Zhang Hui
Mr Zhang Hui earned his master’s degree in Arts from the foreign language department, Tianjin University of Finance and Economics and planning to pursue PhD in the major of International Economics & Trade.
Hamza Arshad
Hamza Arshad is a Pakistani national, doing master in Tianjin University of Finance and Economics in major International trade.
Notes
1. Afghanistan, Argentina, Azerbaijan, Bangladesh, Brazil, China, Egypt, India, Indonesia, Iran, Kazakhstan, Kyrgyzstan, Malaysia, Maldives, Mauritius, Nepal, Nigeria, Paraguay, Sri Lanka, Tajikistan, Turkey, Turkmenistan, Uruguay, USA and Uzbekistan.
2. EGLS (Estimated Generalized Least Square with cross-sectional weights), REM (Random Effects Model), Two-stage EGLS (Two-Stage Estimated Generalized Least Square), GMM (Generalized Method of Moment—one step estimator), PPML (Poisson pseudo-maximum likelihood).
3. [= exp(coefficient)], Coefficients estimated by Poisson Pseudo-Maximum Likelihood (PPML) method as suggested by Silva and Tenreyro (Citation2006).
4. Maximum estimation results by PPML techniques and minimum results by REM.
5. It is calculated as 0.21 [= exp(0.19) − 1] and 0.25 [= exp(0.22) − 1].
References
- Anderson, J. E. (1979). A theoretical foundation for the gravity equation. American Economic Review, 69(1), 106–116.
- Anderson, J. E., & van Wincoop, E. (2001). Border, trade and welfare. Boston College Working Paper 508, Boston.
- Baier, S. L., & Bergstrand, J. H. (2002). On the endogeneity of international trade flows and free trade agreements. Manuscript March 2002.
- Bergstrand, J. H. (1985). The gravity equation in international trade: Some microeconomic foundations and empirical evidence. Review of Economics and Statistics, 67, 474–481. doi:10.2307/1925976
- Bergstrand, J. H. (1989). The generalized gravity equation, monopolistic competition and the factor—Proportions theory in international trade. Review of Economics and Statistics, 71, 143–153. doi:10.2307/1928061
- Bergstrand, J. H. (1990). The Heckscher-Ohlin-Samuelson model, the Linder hypothesis and the determinants of bilateral intra-industry trade. Economic Journal, 100, 1216–1229. doi:10.2307/2233969
- Breusch, T. S., & Pagan, A. R. (1980). The Lagrange multiplier test and its applications to model specification in econometrics. Review of Econometric Studies, 47(1), 239–253. doi:10.2307/2297111
- Brodzicki, T., Ciołek, D., & Śledziewska, K. (2017). What really determines Polish exports? The semi-mixed effects gravity model for Poland. Argumenta Oeconomica, 2(39), 5–19.
- Bun, M. J. G., & Klaassen, F. J. G. M. (2007). The Euro effect on trade is not as large as commonly thought. Oxford Bulletin of Economics and Statistics, 69(4), 473–496. doi:10.1111/j.1468-0084.2007.00448.x
- Carrere, C. (2006). Revisiting the effects of regional trade agreements on trade flows with proper specification of the gravity model. European Economic Review, 50(2), 223–247. doi:10.1016/j.euroecorev.2004.06.001
- Cyrus, T. (2011). Cultural proximity and bilateral trade in the European Union. Retrieved from http://www.euce.org/eusa/2011/papers/12d_cyrus.pdf.
- Deardorff, A. V. (1998). Determinants of bilateral trade: Does gravity work in a neoclassical world? In J. A. Frankel (Ed.), The regionalization of the world economy. Chicago, IL: University of Chicago Press.
- Disdier, A. C., & Head, K. (2003). Exaggerated reports on the death of distance. Mineo: Lessons from a Meta-Analysis.
- Eberhardt, M., & Teal, F. (2011). ‘Econometrics for grumblers: A new look at the literature on cross-country growth empirics’. Journal of Economic Surveys, 25(1), 109–155. doi:10.1111/joes.2011.25.issue-1
- Elliott, D. R. (2007). Caribbean regionalism and the expectation of increased trade: Insights from a time-series gravity model. Journal of International Trade and Economic Development, 16(1), 117–136. doi:10.1080/09638190601165830
- Esfahani, M. N., & Rasoulinezhad, E. (2017). Iran’s trade policy of Asianization and de-Europeanization under sanctions. Journal of Economic Studies, 44(4), 552–567.
- Evenett, S., & Keller, W. (2002). On theories explaining the success of the gravity equation. Journal of Political Economy, 110(2), 281–316. doi:10.1086/338746
- Grant, J. S., & Lambert, D. M. (2008). Do regional trade agreements increase members’ agricultural trade? American Journal of Agricultural Economics, 90(3), 765–782.
- Helpman, E., & Krugman, P. R. (1985). Market structure and international trade. Cambridge, MA: MIT Press.
- Irshad, M. S., & Xin, Q. (2014). A new perspective of the China-ASEAN free trade area and the story of top ten products. European Journal of Business and Management, 6(18), 1–8.
- Irshad, M. S., & Xin, Q. (2015a). Pakistan China free trade agreement (PCFTA) treaty model: Capability, prospects and disputes. Academic Research International, 6(3), 53–60.
- Irshad, M. S., & Xin, Q. (2015b). Rising trend in import and exports of Pakistan FTA partners in recent years. Academic Research International, 6(4), 320–331.
- Irshad, M. S., & Xin, Q. (2017a). Determinants of exports competitiveness: An empirical analysis through revealed comparative advantage of external sector of Pakistan. Asian Economic and Financial Review, 6(3), 623–633.
- Irshad, M. S., & Xin, Q. (2017b). The gravity behind South Korea’s international trade: A panel data approach. The Myanmar Journal, 4(2), 76–89.
- Irshad, M. S., Xin, Q., & Arshad, H. (2015). One belt one road: Does China-Pakistan Economic Corridor benefit for Pakistan’s economy? Journal of Economics and Sustainable Development, 6(24), 200–207.
- Irshad, M. S., Xin, Q., Ayaz, M., & Ali, F. (2016). The role of charismatic world trade organization and the expansion of free international trade. International Journal of Management Science and Business Administration, 2(3), 17–23.
- Irshad, M. S., Xin, Q., Hao, H., & Arshad, H. (2017). SWOT analysis of Pakistan–China free trade agreement: PROS and CONS. International Journal of Asian Social Sciences, 7(1), 45–53. doi:10.18488/journal.1
- Irshad, M. S., Xin, Q., Shahriar, S., & Ali, F. (2018). South Korea’s potential export flow: A panel gravity approach. Asian Journal of Empirical Research, 8(4), 124–139.
- Irshad, M. S., Xin, Q., Shahriar, S., & Arshad, H. (2018). A panel data analysis of China’s trade pattern with OPEC members: Gravity model approach. Asian Economic and Financial Review, 8(1), 103–116.
- Irshad, M. S., Xin, Q., Xuan, L., & Arshad, H. (2016). Deltoid analysis of Pakistan-ASEAN-China free trade agreements and opportunity for Pakistan. Asian Economic and Financial Review, 6(5), 228–237. doi:10.18488/journal.aefr/2016.6.5/102.5.228.237
- Irshad, M. S., Xin, Q., & Arshad, H. (2018). Competitiveness of Pakistani rice in international market and export potential with global world: A panel gravity approach. Cogent Economics & Finance, 6, 1-8. https://doi.org/10.1080/23322039.2018.1486690
- Jong, G. D., Hugh, G., Warren, W., & Jenny, W. (2002). Study on ideas on a new national freight model system for Sweden. Norway: RAND Corporation.
- Kandogan, Y. (2005). Evidence for the natural trade partners theory from the Euro-Mediterranean region. Working Paper Series No. 2005-01.University of Michigan-Flint School of Management.
- Kang, H., & Fratianni, M. (2006). International trade, OECD membership, and religion. Open Economic Review, 17(4–5), 493–508. doi:10.1007/s11079-006-0361-y
- Kepaptsoglou, K., Karlaftis, M. G., & Tsamboulas, D. (2010). The gravity model specification for modelling international trade flows and free trade agreements effects. The Open Economics Journal, 3, 1–13. doi:10.2174/1874919401003010001
- Kucera, D., & Sarna, R. (2006). Trade union rights, democracy, and exports: A gravity model approach. Review of International Economics, 14(5), 859–882. doi:10.1111/roie.2006.14.issue-5
- Leamer, E. E. (1974). The commodity composition of international trade in manufactures: An empirical analysis. Oxford Economic Papers, 26(3), 350-374.
- Linnemann, H. (1966). Modeling international trade flows: An econometric approach. Amsterdam: North-Holland.
- Martinez, et al (2005). Transport costs and trade: Empirical evidence for Latin American imports from the European Union. Journal of International Trade and Economic Development, 14(3), 353–371. doi:10.1080/09638190500212121
- Martinez-Zarzaso, I. (2003). Gravity model: An application to trade between regional blocs. Atlantic Economic Journal, 31(2), 174–187. doi:10.1007/BF02319869
- Melitz, J. (2007). North, South and distance in the gravity model. European Economic Review, 51(4), 971–991. doi:10.1016/j.euroecorev.2006.07.001
- Moscone, F., & Tosetti, E. (2009). A review and comparison of tests of cross-section independence in Panels. Journal of Economic Surveys, Vol. 23(3), pp.528–561. doi:10.1111/joes.2009.23.issue-3
- Papazoglou, C. (2007a). Greece’s potential trade flows: A gravity model approach. International Advances in Economic Research, 13(4), 403–414. doi:10.1007/s11294-007-9107-x
- Papazoglou, C. (2007b). Greece’s potential trade flows: A gravity model approach. International Advances in Economic Research, 13(4), 403–414. doi:10.1007/s11294-007-9107-x
- Pesaran, M. H. (2004), General diagnostic tests for cross section dependence in panels, IZA Discussion Paper No. 1240, Retrieved from: http://repec.iza.org/dp1240.pdf
- Robert, B., Felix, B., Jared, G., Wayne, C., & Paul G. (2015). Exploring the links between bilateral and regional trade agreements and merchandise trade. Asian and Pacific Policy Studies, 2(3), 467–484.
- Silva, J. S., & Tenreyro, S. (2006). The log of gravity. The Review of Economics and Statistics, 88, 641–658. doi:10.1162/rest.88.4.641
- Soloaga, I., & Winters, A. (2001). Regionalism in the Nineties: What effect on trade? The North American Journal of Economics and Finance, 12(1), 1–29. doi:10.1016/S1062-9408(01)00042-0
- Tang, D. (2005). Effects of the regional trading arrangements on trade: Evidence from the NAFTA, ANZCER and ASEAN countries, 1989–2000. Journal of International Trade and Economic Development, 14(2), 241–265. doi:10.1080/09638190500093562
- Thorpe, M., & Zhang, Z. (2005). Study of the measurement and determinants of intra-industry trade in East Asia. Asian Economic Journal, 19(2), 231–247. doi:10.1111/asej.2005.19.issue-2
- Tzouvelekas, V. (2007). Accounting for pairwise heterogeneity in bilateral trade flows: A stochastic varying coefficient gravity model. Applied Economic Letters, 14(12), 927–930. doi:10.1080/13504850600705919
- World Bank. (2005). Global Economic Prospects. Washington, DC.
- Xia, H. (2015). Spotlight: China South Korea to deepen economics ties with FTA implementation. Available from http://news.xinhuanet.com/english/2015-12/19/c_134933148.htm
- Xin, Q., Irshad, M. S., & Hao, H. (2014). Boon or bane: Assessing the environment of China’s free trade agreements with other nations. International Journal of Business and Management Review, Vol. 2(No.5), 1–13.
- Xuegang, C., Zhaoping, Y., & Xuling, L. (2008). Empirical analysis of Xinjiang’s bilateral trade: Gravity model approach. Chinese Geographical Science, Vol. 18(No. 1), pp. 9–16. doi:10.1007/s11769-008-0009-5
Appendix
Appendix A1. Pakistan’s free-trade agreements with Regional trading blocs and specific countries
Appendix A2. Pakistan’s historical trade share with FTA countries in terms of US$ million
Appendix A3. Pakistan trade composition with the world in the year 2015 (US$ million)
Appendix A4. Pakistan trade composition with China in the year 2015 (US$ million)
Appendix A5. Descriptive statistics of variables used in gravity equation
