
 ?Mathematical formulae have been encoded as MathML and are displayed in this HTML version using MathJax in order to improve their display. Uncheck the box to turn MathJax off. This feature requires Javascript. Click on a formula to zoom.
ABSTRACT
With increased length of the crest in a certain width range, the labyrinth weirs increase the discharge capacity. In this study, a laboratory flume was used with a length of 8 m and a width and height of 0.6 m, in which the hydraulic loss of linear/non-linear, labyrinth, triangular, and trapezoidal weirs were investigated. Dimensional analysis using the Buckingham methodology showed that the discharge coefficient (Cd) is a function of parameters such as hydraulic head ratio (Ht/P), weir shape factor (Sf), and hydraulic loss ratio (Hf/P). The results showed that the ATRL weir has a lower discharge coefficient than the ALR by 44% and ATPL a lower discharge coefficient than ALR by 50%. The ATRL weir has a higher hydraulic loss than ALR by 2300% and a higher hydraulic loss than ATPL by 2000%. The TRL weir has a higher hydraulic loss than LR by 4900% and a higher hydraulic loss than TPL by 5700%. The TRL weir has a lower discharge coefficient than LR by 41% and TPL by 43%. The best correlation with the Cubic statistical model was obtained in the TPL weir in terms of discharge coefficient and in the ALR weir in terms of hydraulic loss.
Introduction
Labyrinth weirs are hydraulic structures that are used to control the flow and increase the discharge capacity to a fixed width. Lux stated that, from a hydraulic point of view, labyrinth weirs are in one of the four basic stages: a) The clinging stage where the hydraulic head on the weir crest (Ht) is negligible and the flow freely passes through the entire length of the crest, b) The complete aeration phase where, as the value of (Ht) increases, the water level increases in the channel downstream the weir (especially between the nappe flow and the wall downstream the weir) and due to the interference and compression of the nappe flows in the upstream apex, the aeration under the nappe flow is limited, which results in the reduction of the discharge coefficient. c) The transfer stage (partial aeration), in which, with a further increase in Ht, the falling nappe flows become more compressed in parts of the length of the crest and the flow depth in the downstream channel also increases. d) Compression stage (drowning). Finally, with a very large increase in the value of Ht, the nappe flow over the weir becomes compressed without air bubbles, and with the progression of this process, the labyrinth weir will reach full submergence, which limits its hydraulic efficiency (Lux, Citation1993). shows the hydraulic conditions of the flow on the weir.
Figure 1. Hydraulic conditions of the flow on the weir (Lux, Citation1993).
When the weir does not have high efficiency and we do not see the proper hydraulic performance, we must carefully evaluate the geometric and hydraulic factors involved in its design, one of the hydraulic factors to be considered is the hydraulic loss in weirs, which in this research, it has been discussed in detail.
In general, from the hydraulic point of view, labyrinth weirs have good performance at low hydraulic heads, but with the increase in discharge capacity, due to the interference of the nappe flows with the weir outlet keys, the hydraulic efficiency decreases. The discharge coefficient in these weirs depends on several factors such as the hydraulic head on the weir, the angle of the walls, as well as the thickness and the shape of the weir crest (Ghare et al., Citation2008; Tullis et al., Citation1995). In , the main geometric and hydraulic factors of the labyrinth weir are presented in the form of a three-dimensional view, the longitudinal profile, and plan of the weir.
Figure 2. a) Three-dimensional view, b) Plan and c) Longitudinal profile of trapezoidal labyrinth weir.
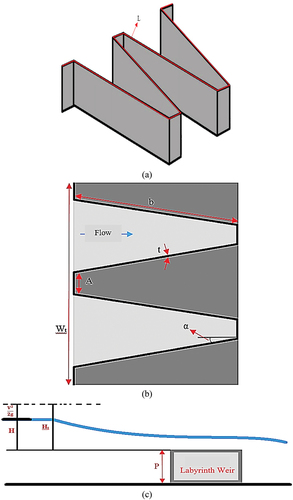
In , L is the total length of the weir crest, A the apex width of the weir, α the angle of the side wall of the weir with the main flow direction, P the height of the weir, Ht the hydraulic head upstream of the weir, w the width of a cycle, b the lateral crest length, Wt the total width of the weir, and ts the thickness of the weir crest.
Majedi-Asl et al. (Citation2024) studied a performance comparison of the meta-model methods for discharge coefficient prediction of labyrinth weirs. The prediction results revealed that the ANN as a superior model has the following performance metrics: R2 = 0.998, DC coefficient = 0.996, and RMSE = 0.006. The sensitivity analysis results indicated that HT/P is the most effective factor in determining the labyrinth weir discharge coefficient in all methods. This suggests that the ratio of HT (total water head) to P (weir height) has a significant impact on the overall model performance. Upon comparing the results of this research with those of other researchers, it is evident that the evaluation indicators for all methods employed in this study are relatively superior.
Idrees and Al-Ameri (Citation2023) investigated the flow characteristics and energy dissipation over a new shape of the trapezoidal labyrinth weirs. The results showed that the compound labyrinth weirs could dissipate the energy of flow by 93%, 92%, 89%, 85%, 83%, 79%, and 75% for α° = 6, 8, 10, 12, 15, 20°, and 35, respectively. The amount of improvement in energy dissipation over a compound labyrinth weir was better than that of a linear weir by 17%, 15%, 14%, 12%, 11%, 10%, and 8% for α° = 6, 8, 10, 12, 15, 20, and 35, respectively. The residual energy (E1/Emin) at the base of downstream compound labyrinth weirs was closer to the minimum potential amount of residual energy as yc/P' increased. For a given value of yc/P', the relative residual energy at the base of compound labyrinth weirs increased as the sidewall angle (α) increased. An empirical equation has been provided to predict the compound coefficient of discharge when relative energy dissipation data are available.
Haghiabi et al. (Citation2022) investigated the hydraulic loss of the flow passing through labyrinth weirs. They found that labyrinth weirs can dissipate the flow energy between 85% and 70% considering the range of relative head (Ht/P) between 0.1 and 1. The lowest efficiency of labyrinth weirs in terms of hydraulic loss occurs when the value of (Ht/P) is around 0.25. For (Ht/P) values greater than 0.3, the performance of labyrinth weir models is the same and is around 75% (Haghiabi et al., Citation2022).
Mattos-Villarroel et al. (Citation2021) investigated the effect of the weir crest geometry on the efficiency of the discharge coefficient of labyrinth weirs. The results showed that the correlation between the experimental and simulated data using CFD is very high (R2 = 0.984). Meanwhile, weirs with a circular crest are more efficient than those with trapezoidal crest, because they have a higher discharge coefficient (4.7% more) (Mattos-Villarroel et al., Citation2021).
Bonakdari et al. (Citation2021) used gene expression programming (GEP) to predict the discharge capacity of the labyrinth weir. They used the crest height to weir hydraulic head ratio (w/y or P/y), crest length to channel width ratio (L/W), crest length to weir hydraulic head (L/y), Froude number (Fr), and vortex angle (θ) to represent a mathematical relation using gene expression programming (GEP) methodology (EquationEquation (1)(1)
(1) ). The results of the study showed that the vortex angle parameter (θ) is less effective in predicting the discharge coefficient (Cd) than other models. On the other hand, they stated that it is necessary to use all the parameters of EquationEquation (1)
(1)
(1) simultaneously to predict the discharge coefficient. Also, EquationEquation (2)
(2)
(2) is presented to predict the discharge coefficient, which is obtained from the non-linear regression analysis (NLR) method. Other results of the study showed that the GEP method is more accurate compared to the NLR method (Bonakdari et al., Citation2021).
Feili et al. (Citation2020) conducted an experimental study of the discharge coefficient of arched trapezoidal labyrinth weir with different intermediate cycles. The results of the study showed that reducing the apex width ratio of the arched double trapezoidal labyrinth weir with a different intermediate cycle (w2/w1) from 0.42 to 0.30 increases the discharge coefficient from 13% to 33% (Feili et al., Citation2020)
Ghaderi et al. (Citation2020) investigated the effect of hydraulic loss and flow hydraulics on trapezoidal-triangular labyrinth weirs. The results showed that the numerical and experimental models are substantially in line with each other. Also, the discharge coefficient decreases with the decrease in the angle of the side wall, which is due to the collision of the nappe flow with the increase in Ht/P values (Ht: hydraulic head, P weir height). Flow hydraulics in TTLW has free flow conditions for low values of discharge capacity and submerged flow conditions for high values of discharge capacity. In addition, increased angle of the side wall and the height of the weir would lead to hydraulic loss (Ghaderi et al., Citation2020).
Karimi et al. (Citation2019) conducted an experimental study on the effect of flow characteristics on the asymmetric triangular labyrinth weir with different placement angles. They found that the symmetrical triangular labyrinth lateral weirs have a higher discharge coefficient than their asymmetrical counterpart. On the other hand, the angle of deviation in the placement of asymmetric weirs causes them to have a higher discharge capacity than symmetrical ones. In other words, this leads to a 50% increase in the discharge capacity of the asymmetric weirs compared to their symmetrical counterparts (Karimi et al., Citation2019).
Monjezi et al. (Citation2018) conducted an experimental study on the discharge coefficient of arched labyrinth weirs with a triangular plan. The results showed that the increase in hydraulic head causes a decrease in the discharge coefficient. Also, arch-shaping the weir can improve the efficiency of linear arched weirs by up to 21% and arched labyrinth weirs by up to 57% (Monjezi et al., Citation2018).
Despite many studies on labyrinth weirs, so far only few studies have been performed on the hydraulic loss of linear and non-linear labyrinth weirs.
Materials and methods
In the present study, an experimental method was used to investigate the parameters affecting the hydraulic loss of labyrinth weirs. Experiments were performed on an experimental flume with a length of 8 m, width of 0.6 m, and height of 0.6 m. shows the longitudinal profile and plan of the experimental flume in the current study. and show the components and the overall view of the experimental flume.
Figure 3. Longitudinal profile and plan of the experimental flume in the current study.
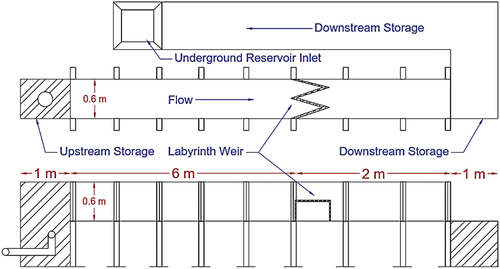
Figure 4. Components of the experimental flume in the current study.
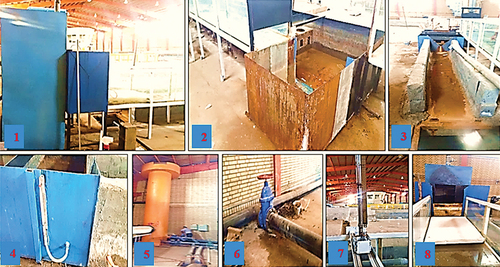
Figure 5. Overview of the experimental flume in the current study (from two different directions).
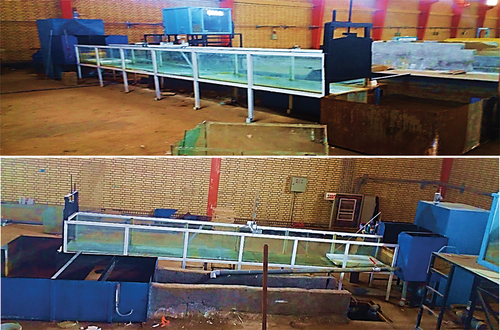
In , there are inlet tank 1, outlet tank 2, flow transfer channel to the underground tank 3, manometer 4, head tank 5, inlet flow angle valve 6, mechanical depth gauge 7 and flume inlet with flow energy dissipator 8.
Dimensional analysis
One of the important and basic steps in conducting laboratory research is the recognition and relationship between important parameters and variables in an element, and it makes us step in the right direction and achieve the desired result. This work is known as dimensional analysis.
The first step in the dimensional analysis is to determine the dimensionless variables affecting the discharge rate of labyrinth weirs using Buckingham’s π theory. After determining the dimensionless variables, the way they affect the discharge rate of the weirs is investigated in order to obtain reasonable and suitable results. EquationEquation (1)(1)
(1) is the general formula for calculating the discharge capacity of weirs, which was used by Tullis et al. (Citation1995) for labyrinth weirs (Tullis et al., Citation1995).
In EquationEquation (3)(3)
(3) , Q is the discharge capacity of the weir, L is the total length of the weir crest, g is the acceleration of gravity, Ht is the total hydraulic head and Cd is the discharge coefficient, the value of which is determined in experiments. The parameters affecting the discharge coefficient of labyrinth weirs are shown in EquationEquation (4)
(4)
(4) .
In EquationEquation (4)(4)
(4) , the discharge coefficient (Cd) is a function of parameters such as discharge capacity Q, the lateral crest length B, the slope of the channel S, the width of one cycle of the weir w, the total width of the weir Wt, the thickness of the weir crest ts, the height of the weir P, the number of cycles N, the total hydraulic head Ht, the acceleration of gravity g, the dynamic viscosity µ, the fluid density ρ, the surface tension of the fluid ϭ, the weir shape factor Sf (trapezoidal, triangular), and the weir hydraulic loss Hf. To perform the dimensional analysis, parameters Q, ρ, and P were considered as repeated variables, and, as a result, dimensionless parameters are presented in the form of EquationEquation (5)
(5)
(5) .
Considering that in this study, dimensionless parameters such as channel slope (S), thickness of weir crest (ts/P), total weir width (Wt/P), weir cycle width (w/P), and number of cycles (N) were constant, and they were eliminated. Also, due to the turbulent flow and high-flow depth in the channel, the effects of Reynolds number (µP/ρQ) and Weber number (ϭ/ρP) were ignored. The influence of the acceleration of gravity (gP5/Q2), which indicates the Froude number, was considered in the dimensionless parameter (Ht/P). The influence of the lateral crest length of the weir (B/P) was considered in the dimensionless parameter (Sf). After removing the constant dimensionless parameters, EquationEquation (6)(6)
(6) was presented as the final dimensionless equation to calculate the discharge coefficient.
In EquationEquation (6)(6)
(6) , Cd represents the discharge coefficient, Ht/P the ratio of total hydraulic head (total hydraulic head) to weir height, Sf the shape factor of the weir and Hf/P the ratio of hydraulic loss of the weir. In this study, for a better understanding of the dimensions and design of physical models of linear and labyrinth weirs, their geometric and hydraulic characteristics are presented in .
Table 1. Geometrical and hydraulic characteristics of linear and labyrinth, trapezoidal and triangular weirs.
Experimental
After turning on the pump, a period of 20 min was considered to establish a uniform flow in the flume. The flow entering the flume was read and measured using a sharp crested triangular weir and a manometer. The hydraulic information of the flow was collected at 2 points and at intervals of 40–100 cm from the upstream of the weir. In the present study, all experiments were performed without downstream control.
In this study, plexiglass with a thickness of 3 mm was used to build the physical model of weirs. Weirs were installed at a distance of 6 m from the beginning of the flume in order to avoid the negative effect of momentary changes in the flow level on the accuracy of the hydraulic head reading.
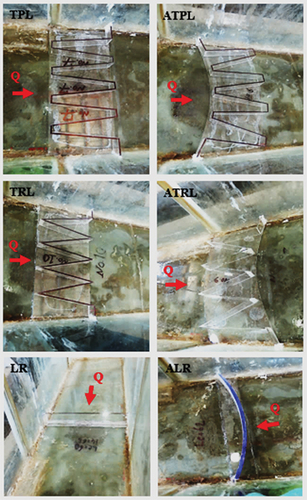
shows the physical model of linear and labyrinth trapezoidal and triangular weirs in the current study.
Figure 6. The physical model of linear, labyrinth, trapezoidal and triangular weirs (arc and linear plan) in this study.
Results and discussion
In this study, the experimental analysis of discharge coefficient and hydraulic loss of linear, labyrinth, triangular, and trapezoidal weirs was performed, the results of which are presented below.
In to , the results of measured data as well as hydraulic loss calculations for each weir are presented.
Table 2. Results of measured data and calculations related to ATRL weir energy consumption.
In , Cd represents the discharge coefficient, Ht/P the ratio of the total hydraulic head to the height of the weir, Q the discharge capacity, B the width of the channel, q the flow rate per unit width, g the acceleration of gravity, hc critical hydraulic head, A the flow cross section, Vc2 the critical flow velocity, hv the height equivalent to speed, Ht the total hydraulic head, and Hf/P the ratio of weir hydraulic loss to height.
Table 3. Results of measured data and calculations related to TRL weir energy consumption.
Table 4. Results of measured data and calculations related to ATPL weir energy consumption.
Table 5. Results of measured data and calculations related to TPL weir energy consumption.
Table 6. Results of measured data and calculations related to ALR weir energy consumption.
Table 7. Results of measured data and calculations related to LR weir energy consumption.
Investigation hydraulic loss of arched linear weirs (ALR), arched labyrinth trapezoidal weirs (ATPL), and arched triangular labyrinth weirs (ATRL)
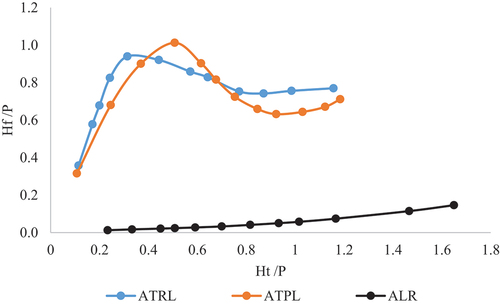
shows that the hydraulic loss (Hf/P) in ATRL and ATPL weirs has an increasing trend from Ht/P = 0.12 to Ht/P = 0.36. From Ht/P = 0.36 to Ht/P = 0.80, the value of Hf/P gradually decreases, and from Ht/P = 0.80 to Ht/P = 1.20, the value of Hf/P gradually increases. In the ALR weir, it was observed that the increase in hydraulic head (Ht/P) has increased the hydraulic loss (Hf/P). In other words, there is a direct relationship between Ht/P and Hf/P in the ALR weir. shows that the hydraulic loss in ALR weir is much lower than ATRL and ATPL. In the ratio of Ht/P = 0.32, ATRL has more hydraulic loss than ALR by 2300% and ATPL more hydraulic loss than ALR by 2000%.
Figure 7. Variations of Hf/P vs. Ht/P values.
Investigation discharge coefficient of arched linear weirs (ALR), arched trapezoidal labyrinth (ATPL), and arched triangular labyrinth (ATRL) weirs
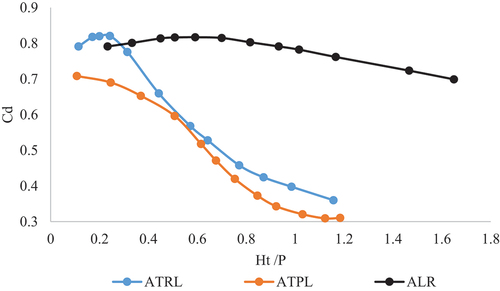
shows that in all ATRL, ATPL, and ALR weirs, the discharge coefficient gradually decreases with the increase in the hydraulic head. The slope of the decrease in discharge coefficient in ATRL and ATPL weirs is higher than that of ALR. From Ht/P = 0.1 to Ht/P = 0.24, the discharge coefficient of ATRL and ATPL weirs is increasing, and these weirs have completed the clinging stage and are in the complete aeration stage. From Ht/P = 0.24 to Ht/P = 0.80, the discharge coefficient of ATRL and ATPL weirs is gradually decreasing, and these weirs are in partial aeration conditions. From Ht/P = 0.80 to Ht/P = 1.20, the discharge coefficient of ATRL and ATPL weirs has decreased greatly, and these weirs are in the drowning stage. The ALR discharge coefficient has the highest value compared to ATRL and ATPL weirs. In the ratio of Ht/P = 0.80, the ATRL weir has a lower discharge coefficient than the ALR by 44% and the ATPL a lower discharge coefficient than the ALR by 50%.
Figure 8. Variation of Cd values against Ht/P.
Investigation hydraulic loss of linear (LR), trapezoidal labyrinth (TPL), and triangular labyrinth (TRL) weirs
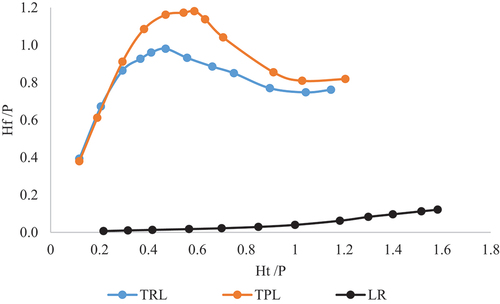
shows that the hydraulic loss (Hf/P) in TRL and TPL weirs has an increasing trend from Ht/P = 0.12 to Ht/P = 0.48. The value of Hf/P gradually decreases from Ht/P = 0.48 to Ht/P = 0.92 and gradually increases from Ht/P = 0.92 to Ht/P = 1.20 for Hf/P values. In the LR weir, it was observed that the increase in hydraulic head (Ht/P) causes an increase in the hydraulic loss (Hf/P); in other words, there is a direct relationship between Ht/P and Hf/P in the LR weir. shows that the hydraulic loss in LR weir is much lower than in TRL and TPL. In the ratio of Ht/P = 0.48, TRL weir has a higher hydraulic loss than LR by 4900% and TPL weir a higher hydraulic loss than LR by 5700%.
Figure 9. Changes of Hf/P vs. Ht/P.
Investigation discharge coefficient of linear weirs (LR), trapezoidal labyrinth weirs (TPL), and triangular labyrinth weirs (TRL)
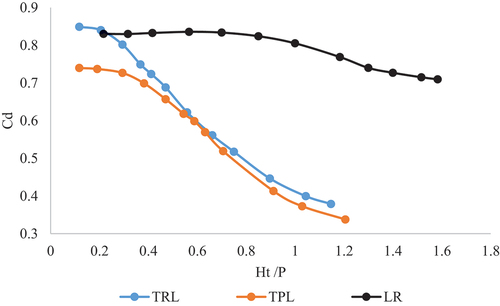
shows that in all TRL, TPL, and LR weirs, the discharge coefficient decreases gradually with the increase in hydraulic head. The range of changes in discharge coefficient is from Cd = 0.38 to Cd = 0.92, and the range of hydraulic head changes is from Ht/P = 0.10 to Ht/P = 1.58. The reduction slope of discharge coefficient in TRL and TPL weirs is higher than that of LR weir. From Ht/P = 0.10 to Ht/P = 0.20, the discharge coefficient of TRL and TPL weirs is the highest, and these weirs have completed the clinging stage and are in the full aeration stage. From Ht/P = 0.20 to Ht/P = 0.88, the discharge coefficient of TRL and TPL weirs gradually decreased and these weirs are in partial aeration conditions. From Ht/P = 0.88 to Ht/P = 1.20, the discharge coefficient of TRL and TPL weirs has decreased greatly, and these weirs are in the drowning stage. The discharge coefficient of LR has the highest value compared to TRL and TPL. In the ratio of Ht/P = 0.80, TRL weir has a 41% lower discharge coefficient than LR and TPL 43% lower discharge coefficient than LR.
Figure 10. Changes in Cd values against Ht/P.
Comparison of the results of this and other studies
In , the geometric and hydraulic characteristics of labyrinth weirs in this study are presented to be compared with other studies (trapezoidal labyrinth weir).
Table 8. Geometrical and hydraulic characteristics of labyrinth weirs in this and other studies.
In , Sf is the shape factor of the weir, N the number of cycles, w/P the ratio of the width of the cycle to the height of the weir, B/w the ratio of the lateral crest length to the width of the cycle, L/B the ratio of the length of the weir to the lateral crest length, L/w the ratio of the length of the weir to the width of the cycle, Ht/P the ratio of the total hydraulic head to the height of the weir, Hf/P the ratio of the hydraulic loss of the weir to the height of the weir, and Cd represents the discharge coefficient.
shows the comparison of the results of this and other studies. In , for all weirs, Ht/P changes from 0.08 to 1.22 and Hf/P from 0.34 to 1.18. shows that the increase in hydraulic head in all weirs first causes an increase in hydraulic loss and gradually reduces hydraulic loss.
Figure 11. Comparison of the results of this and other studies.
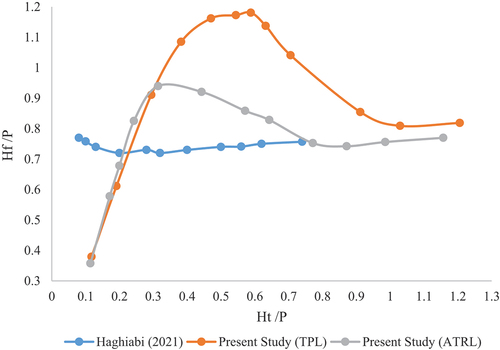
For the TPL weir, from Ht/P = 0.12 to Ht/P = 0.54, the hydraulic loss has an increasing trend and from Ht/P = 0.54 to Ht/P = 0.92, the hydraulic loss has a decreasing trend. For the ATRL weir, from Ht/P = 0.12 to Ht/P = 0.32, the hydraulic loss has an increasing trend and from Ht/P = 0.32 to Ht/P = 0.82, it has a decreasing trend.
In Haghiabi et al. (Citation2022), from Ht/P = 0.08 to Ht/P = 0.74, the hydraulic loss has an almost constant trend. In the ratio of Ht/P = 0.28, ATRL weir has a higher discharge coefficient by 24%, and TPL has a higher discharge coefficient by 19% than the Haghiabi et al. (Citation2022) weir.
Energy loss and discharge coefficient using statistical model
In this study, SPSS, which is applicable software in statistical analysis (with the ability to approximate the function between two or more variables), was used to determine the relationship between hydraulic loss and discharge coefficient in labyrinth weirs.
To obtain the best equation, different functions were extracted for the dependent variable (Cd) in relation to the independent variables (Ht/P, Hf/P, Sf).
shows the results of measured data for each of the labyrinth weirs.
Table 9. Results of measured data for each labyrinth weir.
In SPSS, there are different methods including Linear, Logarithmic, Inverse, Quadratic, Cubic, Compound, Power, S, Growth, Exponential, and Logistic for statistical analysis, each of which was used separately for evaluating ATRL, TRL, ATPL, TPL, ALR, and LR weirs. Taking into account the statistical analysis results, the weirs that had the highest correlation with a specific statistical model are presented in .
Table 10. Characteristics of statistical models for each labyrinth weir.
According to , TPL and ALR weirs have the best correlation with Cubic statistical model in terms of discharge coefficient and hydraulic loss, respectively.
EquationEquation (7(7)
(7) ) to (Equation12
(12)
(12) ) were used to calculate the discharge coefficient of ATRL, TRL, ATPL, TPL, ALR, and LR weirs. Also, EquationEquation (15)
(15)
(15) to (Equation18)
(18)
(18) were used to calculate the hydraulic loss of ATRL, TRL, ATPL, TPL, ALR, and LR weirs.
Conclusion
Investigation hydraulic loss in linear, trapezoidal, and triangular labyrinth weirs and non-linear weirs
The experimental studies showed that the increase in hydraulic head increases the hydraulic loss in weirs. This increase was observed in linear weirs as a linear relationship, but in trapezoidal and triangular labyrinth weirs, it was observed in a sine form.
In linear weirs, due to the lack of sharp collision of the nappe flow passing through the weir, less hydraulic loss occurs, but in triangular and trapezoidal labyrinth weirs, due to the collision of the nappe flows, a high hydraulic loss occurs, and the hydraulic efficiency of the weir is, thus, affected. Strong interference of nappe flows causes a standing wave.
Standing wave shows that the hydraulic loss in labyrinth weirs has increased and as a result, their hydraulic efficiency is decreasing. Therefore, in this study, ATRL, ATPL, and ALR weirs have less hydraulic loss than TRL, TPL, and LR, and as a result, they will have high hydraulic efficiency.
The increase of the hydraulic head causes interference of the nappe flows in the outlet keys of the labyrinth weirs.
Investigation discharge coefficient in linear, trapezoidal labyrinth, and triangular labyrinth weirs and non-linear weirs
Experimental studies showed that the increase in the hydraulic head causes a decrease in the discharge coefficient in the weirs.
The hydraulic performance of linear, triangular labyrinth, and trapezoidal labyrinth weirs (arched and non-arched) are almost the same (considering the range of changes in the discharge coefficients in the diagrams).
The reduction slope in the discharge coefficients of ATRL, ATPL, and ALR weirs is gentler than that of TRL, TPL, and LR, which shows the control and hydraulic performance of these weirs. At the same time, ATRL, ATPL, and ALR weirs go through the four stages of clinging, full aeration, partial aeration, and drowning, which is a sign of the proper design of these weirs.
Linear weirs (LR, ALR) have a high discharge coefficient compared to labyrinth weirs due to the noninterference of the nappe flows with each other.
Notation
| Parameter | = | Symbol |
| Arc linear | = | ALR |
| Curve radius | = | R |
| Trapezoidal labyrinth | = | TPL |
| Arc trapezoidal labyrinth | = | ATPL |
| Triangular labyrinth | = | TRL |
| Arc triangular labyrinth | = | ATRL |
| Linear | = | LR |
| Fluid density | = | ρ |
| Weir cycle width ratio | = | w/P |
| = | B/w | |
| The length of the weir to the lateral crest length | = | L/B |
| Hydraulic head ratio | = | Ht/P |
| Hydraulic loss ratio | = | Hf/P |
| Flow rate per unit width | = | q |
| Critical hydraulic head | = | hc |
| Critical flow velocity | = | Vc2 |
| The height equivalent to speed | = | hv |
| Parameter | = | Symbol |
| Residual energy | = | E1/Emin |
| Discharge | = | Q |
| Acceleration of gravity | = | g |
| Discharge coefficient | = | Cd |
| Channel slope | = | S |
| Width of the one-cycle | = | w |
| Number of cycle | = | N |
| Weir side wall angle | = | α |
| Lateral crest length | = | b |
| Total width of the weir | = | Wt |
| Weir thickness | = | ts |
| Crest height to weir hydraulic head ratio | = | w/y or P/y |
| Length of the weir to the width of the cycle | = | L/w |
| Crest length to weir hydraulic head | = | L/y |
| Froude number | = | Fr |
| Vortex angle | = | θ |
| The non-linear regression | = | NLR |
| Parameter | = | Symbol |
| Hydraulic head | = | Ht |
| Dynamic viscosity | = | µ |
| Weir shape factor | = | Sf |
| Hydraulic loss | = | Hf |
| Weir height | = | P |
| Total length of the weir crest | = | L |
| Weir apex width | = | A |
Disclosure statement
No potential conflict of interest was reported by the author(s).
References
- Bonakdari, H., Ebtehaj, I., Gharabaghi, B., Sharifi, A., & Mosavi, A. (2021). Prediction of discharge capacity of labyrinth weir with gene expression programming. Intelligent Systems and Applications: Proceedings of the 2020 Intelligent Systems Conference (IntelliSys) (Vol. 1. pp. 202–217). Springer International Publishing. https://doi.org/10.20944/preprints202001.0313.v1
- Feili, J., Heidarnejad, M., Masjedi, A. R., & Asadilour, M. (2020). Experimental study of discharge coefficient of trapezoidal arced labyrinth weirs with different arc radius and cycle length. Iranian Journal of Soil and Water Research, 51(5), 1115–1126. https://doi.org/10.22059/ijswr.2020.293163.668411
- Ghaderi, A., Daneshfaraz, R., Dasineh, M., & Francesco, S. (2020). Energy dissipation and hydraulics of flow over trapezoidal–triangular labyrinth weirs. Water, 12(7), 1992. https://doi.org/10.3390/w12071992
- Ghare, A. D., Mhaisalkar, V. A., & Porey, P. D. (2008). An approach to optimal design of trapezoidal labyrinth weirs. World Applied Sciences Journal, 3(6), 934–938. https://www.idosi.org/wasj/wasj3(6)/13.pdf
- Haghiabi, A. H., Nou, M. R. G., & Parsaie, A. (2022). The energy dissipation of flow over the labyrinth weirs. Alexandria Engineering Journal, 61(5), 3729–3733. https://doi.org/10.1016/j.aej.2021.08.075
- Idrees, A. K., & Al-Ameri, R. (2023). Investigation of flow characteristics and energy dissipation over new shape of the trapezoidal labyrinth weirs. Flow Measurement and Instrumentation, 89, 102276. https://doi.org/10.1016/j.flowmeasinst.2022.102276
- Karimi, M., Jalili-Ghazizadeh, M. R., Saneie, M., Atari, J., Saneie, M., & Atari, J. (2019). Flow characteristics over asymmetric triangular labyrinth side weirs. Flow Measurement Instrument, 68, 101574. https://doi.org/10.1016/j.flowmeasinst.2019.101574
- Lux, III F. (1993). Design methodologies for labyrinth weirs. Water Power and Dam Construction Proceeding, Nashville, Tenn. https://apps.dtic.mil/sti/pdfs/ADA307714.pdf#page=654
- Majedi-Asl, M., Ghaderi, A., Kouhdaragh, M., & Omidpour Alavian, T. (2024). A performance comparison of the meta model methods for discharge coefficient prediction of labyrinth weirs. Flow Measurement and Instrumentation, 96, 102563. https://doi.org/10.1016/j.flowmeasinst.2024.102563
- Mattos-Villarroel, E., Díaz-Delgado, C., Flores-Vel´azquez, J., Ojeda-Bustamante, W., & Salinas-Tapia, H. (2021). Influence of crest geometric on discharge coefficient efficiency of labyrinth weirs. Flow Measurement and Instrumentation, 81, 102031. https://doi.org/10.1016/j.flowmeasinst.2021.102031
- Monjezi, R., Heidarnejad, M., Masjedi, A. R., Purmohammadi, M. H., & Kamanbedast, A. (2018). Laboratory investigation of the discharge coefficient of flow in arced labyrinth weirs with triangular plans. Flow Measurement and Instrumentation, 64, 64–70. https://doi.org/10.1016/j.flowmeasinst.2018.10.011
- Tullis, J. P., Amanian, N., & Waldron, D. (1995). Design of labyrinth spillways. Journal of Hydraulic Engineering, 121(3), 247–255. https://doi.org/10.1061/(ASCE)0733-9429(1995)121:3(247)