
ABSTRACT
Teacher orchestration of the classroom is a demanding task because of the multitude of activities and the rapid pace at which these activities occur. Teachers must constantly be aware of the activities students engage in and the progress students are making, in order to be able to make informed decisions. Recent years have seen the development of learning analytics (LA) to support teachers, in the form of interfaces that capture and visualise data about learner activities. LA are hypothesised to deliver actionable knowledge, because the provided information would enable teachers to immediately translate the information into concrete intervention of some kind. This paper provides a short discussion of the hypothesised affordances of LA for supporting teachers, and subsequently, a case study is presented in which a teacher’s sense making strategies of LA were investigated within a digital environment, which enabled the teacher to monitor and regulate the activities of five collaborating groups of students. Besides automatically logged teacher behaviour, eye tracking was used to examine eye movements, and cued retrospective reporting was used to evaluate the choices and decisions made by the teacher. The case study is used to discuss directions for future research concerning learning analytics to support teachers.
Introduction
Teachers are responsible for the design and real-time management of classroom activities and students’ learning processes. Teacher orchestration of the classroom is a demanding task because of the multitude of activities and the rapid pace at which these activities occur. Learning analytics (LA), the measurement and reporting of data about learners, has been advocated as a support tool for teacher orchestration. Although more research is focusing on the design of such LA supporting tools, there is a lack of research examining how exactly teachers respond to and make use of LA. This paper provides a short discussion of the hypothesised affordances of LA to support teachers, and subsequently, a case study is presented in which a teacher’s sense making strategies of LA were investigated with multiple data sources while monitoring student activity in multiple collaborative groups within a digital environment. The case study is used to discuss directions for future research concerning learning analytics to support teachers.
Teacher orchestration of the classroom
The classroom is a complex context characterised by a multitude of activities and a multitude of interactions between teachers and students, that generally occur at a rapid pace (Doyle, Citation2006). Teachers are the “orchestrators” of the classroom, in the sense that they are responsible for the design and real-time management of multiple classroom activities and multiple learning processes (Dillenbourg & Jermann, Citation2010). Proper orchestration requires a number of competencies from the teacher. Across activities, teachers have to structure, group students, and flexibly manage the design and ordering of the activities (Dillenbourg & Jermann, Citation2010). Within activities, teacher support should be contingent, that is, adapted to the needs of an individual student or a group of students (Kaendler, Wiedmann, Rummel, & Spada, Citation2015; Vogt & Rogalla, Citation2009). The core of these competencies is that teachers must constantly be aware of the activities students engage in and the progress students are making, in order to be able to make informed decisions. These requirements become more demanding when more self-regulation is asked of students, for example when students collaborate (Van Leeuwen, Janssen, Erkens, & Brekelmans, Citation2015a). Maintaining an overview of student activities is highly challenging, also given that teachers’ time and cognitive resources are limited (Feldon, Citation2007).
With the current possibilities in educational technology, opportunities are available to automatically collect and analyse learner data. The analyses of these data could aid teachers in orchestrating the classroom by informing them about students’ learning processes (see Sergis & Sampson, Citation2016, for a recent overview). Using data to optimise teacher orchestration is an application of LA. LA is defined as “the measurement, collection, analysis and reporting of data about learners and their contexts, for purposes of understanding and optimizing learning and the environments in which it occurs” (Siemens & Gasevic, Citation2012, p. 1). In fact, the teacher has been advocated as one of the central stakeholders on which LA will have an impact (Drachsler & Greller, Citation2012). The promise of LA to support teachers lies in the assumption that “instructors, armed with the data provided by learner analytics, are the most important weapons against student underperformance in the classroom” (Arnold & Pistilli, Citation2012, p. 270). LA could support teachers “so that they no longer need to ‘drive blind’” (Duval, Citation2011, p. 9). Teachers “driving blind”, as this metaphor suggests, is directly related to the complexity or near impossibility of keeping up with the activity and progress of all groups of students in the classroom at the same time. The intuitive idea is thus that when teachers are better informed by “arming” them with information, they are provided with more “vision”.
Learning analytics as teacher support
The Learning Analytics Cycle (Clow, Citation2012) is a framework to analyse the process of implementing LA. It is divided into four steps: (1) the identification of “learners” (for example, whether it concerns high school students or university freshmen), (2) collecting “data” about the learners (for example, the amount of activity in a learning management system), (3) processing data into “metrics” or “analytics” (for example, a visualisation that shows whether activity is significantly lower than that of the class average), and (4) the design and execution of one or more “interventions” that have some effect on the learner. This last step could take the shape of automatic feedback to the learner, but as we discuss in this paper, could also take the shape of providing teachers with information about learners, who subsequently use the information to support learners. LA may, for example, offer information that helps the teacher to offer individualised student guidance or to plan activities for subsequent lessons (e.g., Matuk, Linn, & Eylon, Citation2015).
As Clow (Citation2012) denotes, the loop of the LA Cycle is only closed effectively when the LA are used to instigate an intervention of some kind that influences students’ learning. In case of applying LA to support teachers, the Cycle would be closed when teachers are able to make sense of the LA and as a result be able to have a positive impact on student learning. The premise is that LA offer “actionable knowledge” (Lockyer, Heathcote, & Dawson, Citation2013) that enables the teacher to immediately translate the information into concrete learner support of some kind. However, between the step of providing teachers with metrics about learners and actual changes in student learning lies a process of “sense making” and “decision making” from the teacher. The teacher has to reflect on and interpret the metrics, and decide whether and if so, how, to act (Hoogland et al., Citation2016; Verbert, Duval, Klerkx, Govaerts, & Santos, Citation2013).
This raises the question how, on a micro level, teachers use LA. LA are an additional source of information in the classroom context, in which already a magnitude of stimuli require the teacher’s attention. Information should therefore be visualised in such a way that allows for effective allocation of the teacher’s resources and which helps to achieve the teacher’s goals (Sergis & Sampson, Citation2016). LA visualisations differ in complexity and also in the interpretability by the teachers using them (Papamitsiou & Economides, Citation2014). Several researchers have taken a teacher co-design approach when developing LA applications for teachers (e.g., Xhakaj, Aleven, & Mclaren, Citation2016). However, if LA are to be of help to teachers, we not only need to analyse teacher needs before implementing LA, but also need to know how exactly teachers use the implemented LA. In other words, we need to analyse the teacher’s behaviour while interacting with LA as input for effective design of LA tools for teachers. When LA are not tailored to the one responsible for driving the interventions, in this case the teacher, no actual changes in student learning will occur and LA will not be effective.
Several systematic reviews show that there is a lack of research concerning the phase of teacher sense making of LA, with very few studies focusing on how teachers translate data into actions (Sergis & Sampson, Citation2016). Although sometimes teachers are asked about their opinion of the usefulness of LA, it is suggested that other evaluation techniques such as user data analysis could provide better insight in the way LA may support teachers (Verbert et al., Citation2014).
Goal of the present paper
The present paper provides a case study in which such user data analysis is employed. We demonstrate how we used a multi-sourced approach to study real-time teacher sense making of LA. The paper therefore offers a contribution on two levels, namely as an illustrative case of how a teacher made sense of LA in a specific context, as well as a methodological contribution that shows an approach on combining several data streams as a way to “measure and analyse” teacher sense making of LA.
The case study is situated in the context of collaborative learning, in which the teacher’s orchestration consists of monitoring student activity in multiple small groups and providing support when needed (Kaendler et al., Citation2015). By means of a controlled lab study, we studied the teacher’s reactions to LA and how this influenced his orchestration of student collaboration. This was done using multiple measuring instruments, namely log file analysis, eye tracking, and cued retrospective reporting. While we realise the case study in itself does not allow to draw generalised conclusions concerning how teachers respond to LA, we use the findings as input for discussing the employed methodology as well as implications and possible hypotheses for future research.
Methodology
Design and participant
The case study was conducted in the context of computer-supported collaborative learning. A controlled, exploratory lab study was conducted to examine the way the participating teacher made sense of information provided by LA concerning the activities of online collaborating groups. Based on student data gathered in classrooms, simulated vignettes were created that re-played student activities as if they were happening in real time. The teacher was presented with an interactive vignette that was enhanced with LA, and asked to orchestrate this situation as if it was a real classroom situation (for an elaborate description of this methodology, see also Van Leeuwen, Janssen, Erkens, & Brekelmans, Citation2015b). With multiple data sources, the teacher’s reaction to the vignette was measured.
The participating teacher was a male history teacher aged 26 years, with two years of teaching experience at secondary school. He has taught history at the level of pre-university education, in the age categories of 8–11th grade. At the time of the data collection, the teacher was a member of the technology committee at his school and had experience with using technology in his teaching, so it can be said that he had adequate technological skills.
The LA cycle
To describe which LA were provided for the teacher, we discuss the four steps of the LA Cycle in the specific case of applying LA to support teachers (see Section 1.2).
Learners – what is the setting and in what way do the LA support the teacher?
The student data used in the vignette concerned 9th grade secondary school students at the level of pre-university education. They worked on a collaboration task in the subject of History that required them to discuss task materials, for example, historical sources, resulting in a collaboratively written essay. The assignment was to explore why the Cold War had not resulted in a Third World War. The collaboration occurred through the digital learning environment Virtual Collaborative Research Institute (VCRI, see Jaspers, Broeken, & Erkens, Citation2004), and was input for the simulated vignette.
The task of the teacher during collaboration is to offer timely and adaptive support (Kaendler et al., Citation2015). Orchestrating collaborative activities in the sense of real time support is heavily demanding, especially because there are so many aspects to be aware of that could indicate effectiveness of collaboration (Prieto, Sharma, Wen, & Dillenbourg, Citation2015; Van Leeuwen et al., Citation2015a). The aim of LA in this case was therefore to support the teacher to monitor the groups’ activities to deliberately focus attention and be able to make informed decisions.
Data – what data is captured about learners?
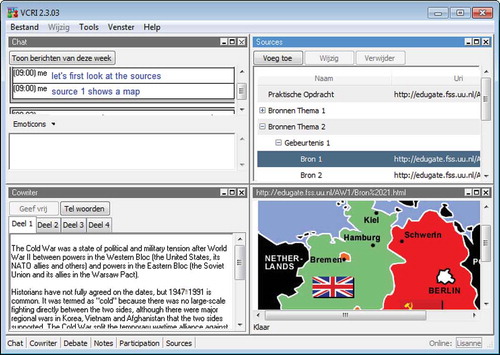
All materials for solving the task are included within VCRI: tools for communicating and writing as well as the domain specific materials. displays a screenshot of VCRI as students use it. The collaborating groups have to read and analyse historical sources (using the Sources-tool), discuss the information (using the Chat-tool), and write an essay (using the Cowriter-tool). The students’ actions are automatically logged, and thus available for metrics or analytics. These include the opening and closing of tools, sent messages, written words in the Cowriter, and so on.
Figure 1. Screenshot of VCRI student interface, with Chat-tool (top left), Cowriter-tool (bottom left), Sources-tool (top right) and one opened source (bottom right).
Metrics – how is the teacher provided with insights into the learning process?
The VCRI learning environment has a separate teacher interface that allows the teacher to monitor the activities of each collaborating group (the chat discussions and the written essays in the Chat- and Cowriter-tools). The teacher may open each of the Chat windows, and is able to request the content of each of the groups’ Cowriters. In the lab study, the teacher interface was enhanced with two LA tools that supported the teacher in monitoring student activity.
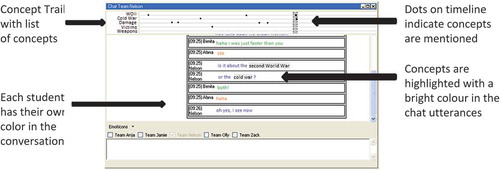
The first tool, the Concept Trail (CT), is a timeline that marks the occurrence of a predefined set of task-related concepts within the groups’ discussions. shows a screenshot of a Chat window from a small group with the integrated CT on top. The dots on the timeline indicate one of the students has mentioned a particular concept. In the discussion itself, the concepts are highlighted in a bright colour to facilitate quick idenitification.
Figure 2. Chat-tool with integrated Concept Trail.
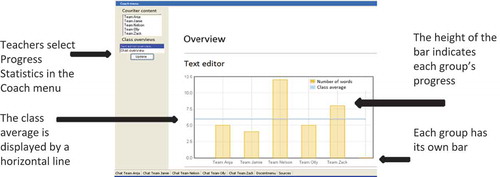
The second LA tool is the availability of Progress Statistics (PS), which informs teachers of the progress of each group in terms of the number of written words in the text editor and the Chat-tool, see . The five bars represent the progress of the five groups concerning the number of words they have written in the text editor or in the chat conversation. The horizontal line indicates the current class average.
Figure 3. The Progress Statistics tool.
For an elaborate description of these tools, we refer the reader to Van Leeuwen et al. (Citation2015b).
Intervention – how does the teacher make sense of LA to drive interventions?
As noted, the teacher’s role during collaboration is to offer timely and adaptive support (Kaendler et al., Citation2015). In VCRI, based on monitoring student activity and the information in the LA tools, teachers are able to support collaborating groups by sending messages (interventions) in the Chat discussions. The question was therefore how the teacher made sense of LA and what role LA played in the teacher’s decision making concerning interventions.
In the interactive vignette, collaboration among students was shown (i.e., played back) to the teacher in real-time. Chat messages appeared, the texts in the Cowriter changed, and the LA tools were constantly updated to reflect the current situation. During the vignette, the teacher was able to monitor the groups’ activities by looking at the written essays, the chat discussions, and the LA tools. The teacher could send messages (interventions) to the groups through the chat screens.
The vignette that the teacher interacted with concerned five collaborating groups, of which one was slightly manipulated to show deviating behaviour from the other groups (Group 4). This particular group engaged in a lively discussion, but was behind in writing their essay. The other groups’ activities were average, with a comparable number of chat messages, comparable mention of task related concepts, and comparable length and quality of essays.
Measurement and analysis of teacher sense making
Because the teacher had access both to the students’ ongoing activities as well as to the LA that showed information about these activities, we were interested in how the teacher would divide his attention over these sources of information and how the teacher would make sense of the LA in this dynamic, fast paced situation. We examined the teacher’s sense making strategies by means of three data sources.
Automatically, the teacher’s mouse-keyboard operations during the vignette were logged by the system. Thus, a log file was saved of the teacher’s behaviour in terms of opening and closing tools and of the interventions sent to the groups.
During the vignette, the teacher’s eye movements were recorded using a SMI RED 250 eye-tracker which recorded eye movements binocularly at 250 Hz (SensoMotoric Instruments GmbH, Teltow, Germany). Using the “Screen Recording” utility in Experiment Center (Version 3.6; SensoMotoric Instruments), the teachers’ eye movements and actions were captured whilst working in the VCRI teacher interface.
After interacting with the vignettes, a video was created in BeGaze (Version 3.6, SensoMotoric Instruments) of the activities by the students and the activity of the teacher during the vignette, with a superimposed record of the teacher’s eye movements and mouse-keyboard operations. Cued retrospective reporting was conducted with the teacher by using this video as a cue for retrospection (“cued retrospective reporting”, see Van Gog, Paas, Van Merrienboer, & Witte, Citation2005), during which the teacher was instructed to think aloud about what he was doing and what he was thinking during the vignette.
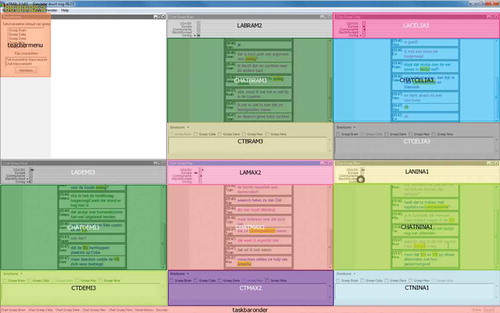
The three data sources were combined, and two lines of analyses followed. First, the obtained eye tracking data was analysed to examine how the teacher divided his attention over the various data sources available during the vignette. To this end, Areas of Interests (AoI) were created in the VCRI teacher interface, distinguishing between the different sources of information (for example, the Chat windows, and within them, the Concept Trail and the students’ discussion). shows an example of the VCRI teacher interface split up into the several AoIs. Then, it was determined how often the teacher consulted each of these sources (i.e., visits) and how much time he spent fixating this information (i.e., a fixation was defined as peak velocity <40°/s and fixation duration >50 ms). It was calculated what relative proportion of time the teacher spent on each AoI (relative fixation time). Furthermore, the number of visits, the average fixation time per visit, and the total relative fixation duration on each source was determined. In other words, this provided a measure of how often the teacher switched his attention between sources and how long a visit to a source lasted on average. Combined with the log files and the cued report, this allowed us to describe general strategies the teacher employed for orchestrating collaboration and dividing attention over the available information during the vignette. The results of this analysis are reported in Section 3.1.
Figure 4. Screenshot of created areas of interests in the VCRI teacher interface, with each marked rectangle representing a different area of interest.
Second, the data from the cued retrospective report was coupled to the log file of teacher behaviour, enabling us to analyse the specific reasons for specific teacher behaviour. An open, bottom up approach was taken to analyse the teacher’s verbal reports. Open coding (Boeije, Citation2010) was used to analyse the teacher’s reaction to the two LA tools, and the teacher’s reasons for intervening. Then, the results were synthesised by removing duplicate codes and creating overarching categories. The results of this analysis are reported in Sections 3.2 and 3.3.
Procedure
The data collection was carried out as follows: the teacher was informed of the goal and the procedure of the study, after which he signed informed consent. Then, background information such as age and teaching experience was collected. The teacher was then shown an instructional video (lasting 4 minutes) about how to use the VCRI simulation system. This was followed by calibration of the eye tracker (calibration accuracy was 0.3° and 0.4° for x- and y-direction, respectively) as well as an example vignette (lasting 4 minutes), during which the teacher could try opening and interacting with all the tools. After indicating the setup was clear, the actual vignette started (lasting 8 minutes). Afterwards, the screen recording was created and the participant was instructed about the procedure for cued retrospective reporting. As the participant already had experience with this procedure, no elaborate explanation was needed. The teacher was shown the screen recording and asked to think aloud (also 8 minutes), after which the data collection was completed.
Results
General strategies for orchestrating collaboration and dividing attention
Of the 8 minutes the vignette lasted, the teacher fixated relevant areas of interest of the VCRI teacher interface in 80% of the time. During the remaining 20%, the teacher looked at white space or made saccades or blinks. Of this 80%, the allocation of attention over the different sources of information (AoIs) is specified in . At class level, the teacher looked at the Statistics for Chat or Cowriter 6% of the time. Group 4 received most attention (29%), followed by Groups 1 (26%) and 2 (15%). The teacher looked more at the Chat windows compared to the content of the Cowriter (54% versus 30%). Within the Chat windows of the groups, the information source used most often were the Chat discussions (34%). The Concept Trails were fixated 7% of the time.
Table 1. Relative fixation duration for the different sources of information for class level and per group.
shows the number of visits to each source of information and the average fixation time on a particular source per visit. Within the 8 minutes, a total of 201 switches between AoIs were made. Again, the teacher consulted information about Group 4 most often (63 visits) followed by Group 1 (56 visits) and Group 2 (27 visits). Even though some groups were consulted more often, the average duration per visit was similar across groups (varying between 1.41 and 1.97 s). It can be seen that the teacher looks relatively often at the chat window of Group 4 and Group 1 and that average fixation times per visit were somewhat longer on these groups compared to the other three groups (3.59 s and 3.65 s versus 2.78 s, 2.30 s, and 2.61 s). As we will see in the sections below, these differences were mainly due to the longer fixation times on the typing window, which was used to send an intervention to Group 4 and Group 1. Intervention in the other groups did not occur. The same findings are observed for the content of the Cowriter: the teacher looked at the contents of Groups 4 and 1 most often (10 and 12 visits, respectively). Group 2 was not consulted that often (two visits), but when consulted, the teacher spent much time per visit reading the content.
Table 2. Number of visits and average fixation time per visit (in seconds) for the different sources of information on class level and per group.
Together, and make clear that the teacher focused his attention and zoomed in on three out of five groups (1, 2, and 4), but also that the teacher made quite some switches between AoIs. Information from the log file of teacher behaviour provided information on the allocation of the teacher’s attention over time. Combining information from the eye tracker with information about which tools were opened or focused on at any given time, as well as the teacher’s verbal reports, the development of the vignette could be made visible, see . We distinguish broadly between phases of “Orientation”, during which the teacher often switched between AoIs, and “Focused attention”, during which the teacher zoomed in on one of the five groups. For each phase, more specific information about the teacher’s strategy is provided in .
Figure 5. Schematic overview of the teacher’s orchestration strategies during the vignette.
Sense making strategies
We now focus on the specific way the teacher reported making sense of the situation by means of the LA and the ongoing student activity. In the initial minutes of the vignette, the teacher tried to obtain an overview of the groups and how they were currently doing concerning the writing of the essay. The teacher tried doing so by means of the Chat discussions and the contents of the Cowriter, but all this information was too much to interpret and to decide which group might need support. The teacher had opened all five Chat windows and was scrolling through the contents of the Cowriter. This is when the teacher decided to look at the Progress Statistics. The visual layout of this tool, with the five bars representing each group, immediately drew the teacher’s attention to Group 4, which showed less progress on the essay than the other groups, but above average discussion activity. A phase followed in which the teacher focused solely on Group 4. This mechanism of pointing the teacher’s attention was later also noticeable for the other LA tool, the CT. Once the teacher had opened all five Chat windows at the same time, this allowed him to compare the groups concerning the number of concepts and the frequency in which concepts were mentioned. Both tools thus were made sense of by the teacher as a quick comparison mechanism that could support in guiding attention.
After the initial minutes, the teacher did not change the composition of his interface anymore. He left all five Chat windows opened, and also had the menu opened from which he could select Statistics or Cowriter content.
Once the teacher zoomed in on one of the groups, and there were several instances of this (see ), the Concept Trail served another function. The teacher then started looking more in-depth at which concepts were mentioned in the Chat discussions and which were not. The teacher then compared this information to what the students had written in their essays, and checked whether the missing concepts as indicated by the CT were also missing in the essay. In this case, the CT thus constituted a sort of compass by which the teacher could evaluate the breadth of the essays and use it as a starting point to read in-depth the sentences the students had written. In one case, the teacher eventually initiated an intervention to a group (Group 1) that indeed seemed to have neglected an important aspect in their essay, and prompted them to think about this aspect. The information from the CT was then thus directly usable as input for the intervention. In another group (Group 2), there was the same indication from the CT that an aspect was missing. In this case, the teacher “overruled” the CT when it turned out the students had written about this aspect in the essay, although they did not use the exact wording as the one in the CT.
It can be noted that the underlying assumptions of the CT, that it is important that students discuss multiple aspects of a particular task, was shared by the teacher. The teacher agreed with this principle and actively used it in monitoring the groups. Sense making of the LA tools was achieved by using the tools to compare between groups as well as to evaluate individual groups.
Deciding whether or not to intervene
During the vignette, there were two instances of interventions, and we found one instance of non-intervention, in which the teacher deliberately refrained from intervening. In this section, we discuss the reasons the teacher had for these decisions.
The primary role of the LA in driving teacher interventions was that the LA pointed the teacher towards the groups that might need support. As discussed above, once the teacher had zoomed in on a group, the CT was a further means to evaluate the progress a group was making. The teacher looked for the task related concepts mentioned by the CT, and evaluated whether the groups had adequately described them. Reading and evaluating the actual content was not supported by the LA, but especially the CT provided indicators what to look for. The instance of deliberately refraining from intervening was when the teacher decided the content of the essay was appropriate, even though the group had not used the precise wording that the CT picks up on.
The final decision of whether and how to intervene involved several other considerations that the teacher took into account. One of these was the goal of the task, which stressed the importance of providing pro and counter arguments in the essay. This was a deciding factor for the teacher when intervening in Group 4, who were showing a good discussion but who were not getting further with the aim of the task of writing their arguments down.
Another consideration was that the teacher tried to distinguish between the contributions of the members within a group. The teacher said he was trying to figure out whether he should target his intervention at a specific student, but as he could not easily determine each member’s role, he addressed the interventions to the group as a unit.
Thus, the decision making concerning interventions was an interplay between using the information from the LA, reading the content of the Cowriter, and making the final decision based on what the teacher deemed important in this specific context.
Discussion
The aim of the present paper was to demonstrate an approach to study teacher sense making of LA. In this section, we use the findings to discuss implications and possible avenues for future research. This is done on two levels, namely by discussing the teacher’s sense making strategies, and, on a methodological level, by discussing the specific method we used for “measuring” these strategies.
Discussion of teacher sense making strategies
The teacher’s sense making strategies were broadly described in terms of orientation and focused attention, and we found LA played a role during both of these phases. During orientation, LA provided a means to compare groups and to decide which group to focus on. During focused attention, LA helped to evaluate the progress a group was making. The beneficial role of focusing attention was helpful because the ongoing activity of the five groups was quite a lot to maintain an overview on, as the teacher remarked. We would therefore hypothesise LA for aggregating information is especially helpful in classes with a larger number of students or larger number of collaborating groups (Chounta & Avouris, Citation2014; Van Leeuwen et al., Citation2015a).
In other words, the LA were a means of comparing activity. The analyses underlying the LA were quite simple, yet a helpful tool in managing the teacher’s attention. The teacher spent quite some time of the vignette on orienting (see ). Because the teacher seemed to use quantity of activity as an initial indicator for comparing groups, this orientation phase could easily be automated by the system. The LA could then automatically alert the teacher which group to focus on, possibly freeing up more cognitive resources for the teacher to actually provide support to students.
In terms of actionable knowledge, the teacher showed direct use of the information from the CT in one of his interventions when he recommended the students look into one of the task related concepts. Here we saw the information being translated into action quite directly. Another important aspect is that the LA helped the teacher to direct his attention, although this did not always lead to action in terms of intervention. Focusing attention and finding the relevant information to tend to is an essential pedagogical aspect of making sense of information, however (Hoogland et al., Citation2016). In that respect, although not directly observable as “teacher action”, we would categorise this as actionable knowledge delivered by the LA as well.
The teacher remained the central figure in determining the right course of action and who could “overrule” the initial indication of the LA. The final decision whether and how to intervene involved a combination of the LA, careful reading of the content of the students’ essays, and the teacher’s own pedagogical considerations. One of those was that the teacher liked to have insight into each group member’s role, which was hard to determine in such short notice and without having any prior knowledge about the students. This finding shows that differing LA tools may be more or less helpful in making sense of a complex situation depending on the specific context, and even for different teachers in the same context, depending on their goal and pedagogical beliefs. Future research could further point out how LA play a role in helping teachers to allocate their attention and resources effectively.
Methodological reflections
Our methodological approach included the combination of three data sources, namely the behavioural log file, eye tracking data, and the verbal report obtained with cued retrospective reporting. Adding the eye tracking and verbal data provided a more complete understanding of how the teacher made sense of the available information, and what specific aspects were costing him effort.
First of all, the eye tracking data was more specific than the behavioural log file generated by the system, because once the teacher had opened all windows at once and was reading their contents, only his eye movements were informative of which screen he allocated his attention to. The data from the eye tracker was also very informative in providing a measure of the amount of effort needed from the teacher for orchestrating this situation, in the sense that many switches between areas of interest were detected. This might signify that a lot of stimuli were attracting the teacher’s attention. Although it was a demanding task for the teacher, the eye tracking data suggests, in line with the log data and reflections from the verbal reports, that the teacher differentiated between the groups, paying more attention to the groups that needed most guidance and support and paying less attention to the groups that needed less guidance and support.
Second, the teacher’s verbal report provided additional information because it clarified the teacher’s reasons for his behaviour. This helped to confirm or complete the profile of his behaviour we composed based on the other data sources, but also gave additional insights that were not obtained with these other sources. For example, the considerations the teacher had in driving his interventions, as well as his refraining from intervention, were illuminated with the verbal report. While actionable knowledge is propagated as the ideal goal of LA, we suggest that “non-actionable” knowledge in the sense of knowing when not to act is also of high importance. In the case of collaborative learning, the teacher should not exert too much control and be aware of moments where interrupting students’ discussions could hinder their opportunities for learning (Kaendler et al., Citation2015).
How could these three data sources inform the design of LA to support teachers? Looking at the specific data about the teacher’s use of the two LA tools, the eye tracking data informed us that the teacher spent relatively little time fixating them. At the same time, the verbal report indicated the LA played a very important role in indicating which group might need help. Combined, this could mean that the LA were simple yet informative enough for the teacher to use them. However, the high number of switches between areas of interest also indicates that the teacher had to move a lot between resources. This could mean that the design of the interface could be improved; for example, by placing information about each group closer together. The Chat discussion and Cowriter content of each specific group might, for example, be placed together instead of in different windows.
Concerning the controlled lab setting we employed, the elaborate considerations of behaviour reported by the teacher indicate the teacher took the task very seriously, as has been our experience in earlier studies (e.g., Van Leeuwen et al., Citation2015b). At one point during the vignette, the teacher revisited one of the groups to see whether they had shown progress since the teacher’s intervention. Of course, the simulated situation means the students could not have responded to the teacher’s intervention, and this is the primary disadvantage of this lab setting: effects of the teacher’s behaviour based on the LA cannot be examined in terms of changes in student behaviour. This is related to a general methodological challenge. When investigating the effects or effectiveness of LA as a supporting tool for teachers, the subject under investigation is primarily the teacher and the context in which the teacher is observed. This means that the unit of analysis or the number of participants in a study is determined by the number of teachers, not the number of students. As a consequence, it is labour-intensive to acquire a sufficient sample size that enables claims that are valid beyond a single case study. Lab studies like the one presented here could be a means to answer some of the research questions or to test initial hypotheses. However, the fact remains that the employed methodology did not allow us to examine the effect of the teacher’s orchestration on students, and as a future direction, ecologically valid classroom studies are of vital importance.
Conclusion
To conclude, this paper described a case study of teacher orchestration of collaborating groups whilst supported by LA. The description of the teacher’s behaviour and reported considerations shows the complexity of how to make sense of combined information provided by LA and by monitoring ongoing student activity; it is clear there are many open questions for future research. As a methodological contribution, we illustrated the combination of log file data, eye tracking, and cued retrospective reporting as a means to studying teacher sense making of LA. Our findings suggest this could be a viable route towards a more complete understanding of the sense making process that is essential to ensuring LA deliver actionable knowledge for teachers.
Acknowledgements
The authors would like to thank the reviewers as well as Pierre Dillenbourg for their feedback on earlier versions of this paper.
Disclosure statement
No potential conflict of interest was reported by the authors.
Additional information
Funding
References
- Arnold, K. E., & Pistilli, M. D. (2012). Course signals at Purdue: Using learning analytics to increase student success. In Proceedings of the 2nd international conference on learning analytics and knowledge (pp. 267–270). doi:10.1145/2330601.2330666
- Boeije, H. (2010). Analysis in qualitative research. London: SAGE.
- Chounta, I.-A., & Avouris, N. (2014). Towards the real-time evaluation of collaborative activities: Integration of an automatic rater of collaboration quality in the classroom from the teacher’s perspective. Education and Information Technologies, 21(4), 815–835. doi:10.1007/s10639-014-9355-3
- Clow, D. (2012). The learning analytics cycle: Closing the loop effectively. In S. Buckingham Shum, D. Gašević, & R. Ferguson (Eds.), Proceedings of the 2nd conference on learning analytics and knowledge (pp. 134–138). Vancouver, BC: ACM.
- Dillenbourg, P., & Jermann, P. (2010). Technology for classroom orchestration. In M. S. Khine & I. M. Saleh (Eds.), New science of learning (pp. 525–552). New York, NY: Springer New York. doi:10.1007/978-1-4419-5716-0
- Doyle, W. (2006). Ecological approaches to classroom management. In C. M. Evertson & C. S. Weinstein (Eds.), Handbook of classroom management: Research, practice, and contemporary issues (pp. 97–125). Mahwah, NJ: Erlbaum.
- Drachsler, H., & Greller, W. (2012). Translating learning into numbers: A generic framework for learning analytics. Educational Technology & Society, 15(3), 42–57. doi:10.1145/2330601.2330634
- Duval, E. (2011). Attention please! Learning analytics for visualization and recommendation. In P. Long, G. Siemens, G. Conole, and D. Gašević (Eds.), Proceedings of the 1st international conference on learning analytics and knowledge (pp. 9–17). New York, NY: ACM.
- Feldon, D. F. (2007). Cognitive load and classroom teaching: The double-edged sword of automaticity. Educational Psychologist, 42(3), 123–137. doi:10.1080/00461520701416173
- Hoogland, I., Schildkamp, K., Van der Kleij, F., Heitink, M., Kippers, W., Veldkamp, B., & Dijkstra, A. M. (2016). Prerequisites for data-based decision making in the classroom: Research evidence and practical illustrations. Teaching and Teacher Education, 60, 377–386. doi:10.1016/j.tate.2016.07.012
- Jaspers, J., Broeken, M., & Erkens, G. (2004). Virtual collaborative research institute (VCRI). Utrecht: Department of Education.
- Kaendler, C., Wiedmann, M., Rummel, N., & Spada, H. (2015). Teacher competencies for the implementation of collaborative learning in the classroom: A framework and research review. Educational Psychology Review, 27(3), 505–536. doi:10.1007/s10648-014-9288-9
- Lockyer, L., Heathcote, E., & Dawson, S. (2013). Informing pedagogical action: Aligning learning analytics with learning design. American Behavioral Scientist, 57(10), 1439–1459. doi:10.1177/0002764213479367
- Matuk, C., Linn, M. C., & Eylon, B.-S. (2015). Technology to support teachers using evidence from student work to customize technology-enhanced inquiry units. Instructional Science, 43(2), 229–257. doi:10.1007/s11251-014-9338-1
- Papamitsiou, Z., & Economides, A. A. (2014). Learning analytics and educational data mining in practice: A systematic literature review of empirical evidence. Educational Technology & Society, 17, 49–64. Retrieved from http://www.ifets.info/journals/17_4/4.pdf
- Prieto, L. P., Sharma, K., Wen, Y., & Dillenbourg, P. (2015, June). The burden of facilitating collaboration: Towards estimation of teacher orchestration load using eye-tracking measures. Proceedings of the 11th international conference on Computer-Supported Collaborative Learning (CSCL 2015), Gothenburg, Sweden.
- Sergis, S., & Sampson, G. (2016). Teaching and learning analytics to support teacher inquiry: A systematic literature review. In A. Peña-Ayala (Ed.), Learning analytics: Fundaments, applications, and trends: A view of the current state of the art. Springer. doi:10.1007/978-3-319-52977-6
- Siemens, G., & Gasevic, D. (2012). Guest editorial – Learning and knowledge analytics. Educational Technology & Society, 15(3), 1–2. Retrieved from http://www.ifets.info/journals/15_3/1.pdf
- Van Gog, T., Paas, F., van Merrienboer, J. J. G., & Witte, P. (2005). Uncovering the problem-solving process: Cued retrospective reporting versus concurrent and retrospective reporting. Journal of Experimental Psychology: Applied, 11, 237–244. doi:10.1037/1076-898X.11.4.237
- Van Leeuwen, A., Janssen, J., Erkens, G., & Brekelmans, M. (2015a). Teacher regulation of multiple computer-supported collaborating groups. Computers in Human Behavior, 52, 233–242. doi:10.1016/j.chb.2015.05.058
- Van Leeuwen, A., Janssen, J., Erkens, G., & Brekelmans, M. (2015b). Teacher regulation of cognitive activities during student collaboration: Effects of learning analytics. Computers & Education, 90, 80–94. doi:10.1016/j.compedu.2015.09.006
- Verbert, K., Duval, E., Klerkx, J., Govaerts, S., & Santos, J. L. (2013). Learning analytics dashboard applications. American Behavioral Scientist, 57(10), 1500–1509. doi:10.1177/0002764213479363
- Verbert, K., Govaerts, S., Duval, E., Santos, J. L., Van Assche, F., Parra, G., & Klerkx, J. (2014). Learning dashboards: An overview and future research opportunities. Personal and Ubiquitous Computing, 18, 1499–1514. doi:10.1007/s00779-013-0751-2
- Vogt, F., & Rogalla, M. (2009). Developing adaptive teaching competency through coaching. Teaching and Teacher Education, 25(8), 1051–1060. doi:10.1016/j.tate.2009.04.002
- Xhakaj, F., Aleven, V., & Mclaren, B. M. (2016). How teachers use data to help students learn: Contextual inquiry for the design of a dashboard. In Proceedings of the EC-TEL conference. doi:10.1007/978-3-319-45153-4_26