
 ?Mathematical formulae have been encoded as MathML and are displayed in this HTML version using MathJax in order to improve their display. Uncheck the box to turn MathJax off. This feature requires Javascript. Click on a formula to zoom.
ABSTRACT
Ultrafast optical spectroscopy delivers unparalleled insights into the dynamic response of photoactive materials, including semiconducting, photonic and phase-change materials. The most applied experimental tool – transient absorption spectroscopy – derives signals from induced changes in the intensity of transmitted light, assumed to relate to the imaginary part of the refractive index. However, the entire complex refractive index of materials changes in the excited state; changes in the real part of the refractive index can have significant effects on transient absorption spectra and the function of optical devices. In this review, we introduce an emerging ultrafast spectroscopy method – frequency domain interferometry. This simple adaptation of transient absorption spectroscopy provides a model-independent means of spectrally resolving photoinduced changes in a materials refractive index. After introducing the theory and implementation of the method, we describe several case studies, including the optical response of metal-halide perovskites and phase modulators, and surface displacement of phase-change materials. Finally, we describe recent and future improvements that can enhance the time-resolution and signal sensitivity of this technique. The advances and applications highlighted in this review demonstrate the potential of the method to become a standard part of the ultrafast spectroscopy toolbox for characterising optoelectronic and photonic materials and devices.
GRAPHICAL ABSTRACT
1. Introduction
Knowledge of the wavelength-dependent complex refractive index provides a fundamental understanding of the optical properties of optoelectronic materials such as light absorption, reflection and phase velocity [Citation1–3]. Whereas the imaginary part of the refractive index is related to the absorption of light, the real part governs the phase velocity inside the medium and the boundary reflections [Citation4]. Understanding these optical properties is crucial to optimise device design for solar panels [Citation3,Citation5,Citation6], light-emitting diodes [Citation7], photodetectors [Citation8,Citation9], waveguides [Citation10,Citation11] and photonic crystals [Citation12,Citation13]. To obtain this information, techniques such as ellipsometry and UV-visible absorption spectroscopy are routinely applied to obtain the ground state real and imaginary part of the complex refractive index [Citation1,Citation14–17].
While the steady-state complex refractive index describes the optical properties of a material in the ground state, a change in the refractive index is expected when the material is put into an excited state, due to the increased excited state carrier concentration. The redistribution of excitations in a material will generate a change in both the real (Δn) and imaginary part (Δk) of the refractive index [Citation18–21]. Understanding the excited state complex refractive index is crucial for high-concentration optoelectronic devices such as fiber and solid-state lasers [Citation22,Citation23], concentrating solar cells [Citation24,Citation25] and all-optical phase modulators [Citation26].
Transient absorption spectroscopy infers the change in transmission upon photoexcitation [Citation27]. The obtained transient spectrum is assumed to solely depend on the change in absorption, related to the change in the imaginary part of the refractive index, to reveal the excited state kinetics such as carrier cooling, carrier and/or exciton recombination and charge separation [Citation28–32]. For the obtained transient absorption spectrum, the assumption is made that the change in the real part of the refractive index does not contribute to the signal. The real part, however, changes the reflection at the boundaries of the sample, which results in a modulated total transmittance, impacting the shape of the transient absorption spectrum [Citation33]. This is not an issue for materials with a low refractive index as the absolute change is small; however, the next-generation organic and perovskite photovoltaic materials come with a significantly high ( 2) refractive index where the absolute change of the refractive index becomes a significant contributor to the transient absorption spectrum [Citation1,Citation34]. The change in reflection can lead to ambiguity and misinterpretation of the spectral features, especially in the sub-bandgap region where the change in reflection can be significant [Citation34,Citation35].
Techniques such as transient deflection and transient reflection are applied to measure the change of the real part of the refractive index [Citation30,Citation36–38]. These techniques, however, have their respective drawbacks. The transient deflection probes the real part of the refractive index only at a single wavelength, and transient reflection is strongly model dependent due to multiple internal reflections within the sample and substrate and has limited applications as it is only sensitive to the surface of the sample.
Alternatively, models based on the Kramers–Kronig relations exist to retrieve the change in the real part of the refractive index from the imaginary part [Citation18,Citation39]. Here, the change in the imaginary part is modeled by the sum of bandgap renormalisation, state-filling and free-carrier absorption. This, however, requires full prior understanding of the excited state absorption dynamics. Another option is to use the transient absorption signal to iteratively retrieve the change in real and imaginary parts of the refractive index by fitting the Kramers–Kronig-related contributions from absorption and reflection [Citation35,Citation40]. The equations used to obtain the contributions from the absorption and reflection, however, are dependent on the sample and substrate geometry and require elimination of the contribution from stimulated emission to the transient absorption spectrum. This renders this technique prone to user input errors.
In this review, we will discuss the ultrafast frequency domain interferometer (FDI) – a model-independent technique capable of measuring the wavelength-dependent change in the real part of the refractive index upon photoexcitation on a femtosecond timescale [Citation33,Citation41]. This technique is an adaptation of transient absorption spectroscopy, and measures the relative phase between a broadband reference and probe laser pulse pair after transmission through the sample, where the excitation occurs between the arrival time of the reference and probe pulses at the sample. The wavelength-dependent phase change of the probe pulse after excitation between the two pulses is directly related to the change in the real part of the refractive index via the change in optical path length.
The obtained change in the real part of the refractive index spectrum of a material provides information regarding the phase, propagation direction, reflection and nonlinear interactions of light impinging on the sample after photoexcitation. This knowledge can be directly used in laser physics, phase modulators, waveguides, photovoltaics and nonlinear optics, and can be used to provide supporting information for other optical measurements, such as transient absorption spectroscopy [Citation23,Citation33,Citation42–44]. Furthermore, the change in the real part of the refractive index can then be used to calculate the change in the imaginary part using the Kramers–Kronig relations, indirectly providing transient absorption information as well [Citation45].
1.1. Relation between optical constants
The complex refractive index determines the reflection at the surface boundaries, absorption of light within the sample and the intensity of the transmitted light [Citation4]. Besides this, the real part of the refractive index governs the phase velocity of light in the medium. The real and imaginary part of the refractive index are not free parameters but are related to one another via the Kramers–Kronig integral dispersion relations. These Kramers–Kronig relations are given by
where is the real part of the refractive index,
is the speed of light,
is the Cauchy principal value,
is the centered wavelength,
is all wavelengths and
is the absorption coefficient related to the imaginary part of the refractive index,
, according to
The absorption within a medium is related to the imaginary part of the refractive index via the Beer–Lambert law, where
with the intensity right after the first interface and
the intensity at the second-interface. Here,
is the travel distance within the medium.
The real part of the refractive index dictates the phase velocity of light in the material and the reflection of light at the material boundaries. The phase velocity within the material is given by
showing that that the speed of light is decreased in a material when . This also shows that modulation of
corresponds to a wavelength-dependent phase change of the transmitted light, as will be discussed throughout this review.
As for the reflection, the reflection at an interface for normal incidence is given by
where is the refractive index of the initial material and
the refractive index after the interface. This means that, by modulating the real part of the refractive index, the portion of reflected light is altered. More complex reflection equations can include the incidence angle, for which the polarisation of light has to be included. Furthermore, multiple internal reflections, also known as Fabry–Perot reflections, can be included to fully describe the reflected portion of light. These internal reflections further alter the total reflection intensity depending on the sample thickness, wavelength and refractive index.
1.2. Nonlinear refractive index
The total refractive index of a system during and after excitation is given by the sum of the steady-state, non-resonant and excitation induced, or resonant, refractive index according to
Here, the refractive index change induced by a strong electric field is described by a resonant and non-resonant nonlinear refractive index [Citation18,Citation46]. The non-resonant nonlinear refractive index , however, is only non-zero, while an intense electric field is present in the sample and can be measured via the Z-scan method [Citation46,Citation47]. For this review, we will focus on the resonant nonlinear refractive index change,
, which is the refractive index change as a direct result of and excited state distribution. This excited state refractive index contains contributions from state filling, bandgap renormalisation and free carrier absorption.
Models have been created to recreate using the Kramers–Kronig relations by modelling the change in absorption coefficient [Citation18,Citation48,Citation49]. For this, however, a full picture of the excited state absorption is required to accurately use this calculation. Recently, numerical techniques are published to approximate the refractive index change from the steady-state absorption and transient absorption spectra [Citation35,Citation40]. These techniques are limited as they require the full transient spectrum for the Kramers–Kronig relations to describe the refractive index accurately. Besides this, transient absorption spectra contain contributions from stimulated emission, which will have to be extracted first. To overcome these limitations and verify the results obtained by these models, techniques, such as transient deflection, transient reflection and FDI are developed to measure the real part of the refractive index in an isolated fashion.
1.3. Transient deflection and transient reflection spectroscopies
To measure the time-dependent refractive index change of a material, a deflector technique can be used [Citation50–53]. An overview of this technique is shown in . This technique uses a pump pulse with a relative large spot size to excite the sample. This pump pulse generates a nonuniform excited state population in the sample, which in turn generates a nonuniform excited state refractive index, creating a gradient. When the probe pulse is sent through this refractive index gradient, the beam gets deflected via refraction, which provides information regarding the induced refractive index gradient [Citation4].
Figure 1. (a) Schematic of a transient deflection system. A large pump spot creates a refractive index gradient and the probe beam is refracted. A segmented detector is used to observe the deflection. (b) Transient deflection trace of air containing N2 and O2 and numerical fitting. (c) Diagram of a transient reflection system where a perovskite sample is excited by a 400 nm pump pulse and a broadband probe pulse is reflected off the sample. The change in reflection between the ground and excited state is then measured to obtain the spectrally dependent reflection change. (d) Results of the transient reflection measurement and the inverse Hilbert transform of the transient reflection, which is related to the change in absorption. Adapted with permission from [Citation36] © The Optical Society and [Citation58].
![Figure 1. (a) Schematic of a transient deflection system. A large pump spot creates a refractive index gradient and the probe beam is refracted. A segmented detector is used to observe the deflection. (b) Transient deflection trace of air containing N2 and O2 and numerical fitting. (c) Diagram of a transient reflection system where a perovskite sample is excited by a 400 nm pump pulse and a broadband probe pulse is reflected off the sample. The change in reflection between the ground and excited state is then measured to obtain the spectrally dependent reflection change. (d) Results of the transient reflection measurement and the inverse Hilbert transform of the transient reflection, which is related to the change in absorption. Adapted with permission from [Citation36] © The Optical Society and [Citation58].](/cms/asset/a8d74219-6747-424d-aecc-bc4756c53ed6/tapx_a_2065218_f0001_oc.jpg)
Transient deflection spectroscopy is a sensitive technique, capable of measuring phase changes as small as λ/20,000 and is therefore capable of measuring the refractive index change of gases and generated plasma [Citation36,Citation37,Citation54]. An example is shown in , where the normalised energy difference between two segments of the detector is shown for air, containing N2 and O2, after photoexcitation at 800 nm and probed at 650 nm. The obtained kinetics are fitted using equations describing the rotation states of these molecules [Citation36], showing excellent agreement between theory and the experimental results. On top of that, by changing the relative polarisation of the pump and probe beam, the bound-electronic response can be separated from the different-symmetry nuclear dynamics [Citation36].
However, the refractive index change, calculated from transient deflection measurement, is conventionally obtained under the assumption that there is no change in absorption upon photoexcitation, which can lead to misinterpretation of the intensity change. Besides this, the technique is sensitive to the beam geometry at the sample position and device structure, as the total deflection of the beam is dependent on where the probe arrives at the excited spot and the geometry of the excited material [Citation55,Citation56]. This allows for errors in the calculated refractive index. Finally, transient deflection generally measures a single wavelength at a time, thereby requiring a series of measurements to uncover the full spectrally dependent refractive index change, making this highly sensitive method less suitable for materials with overlapping spectral features.
One technique to overcome these drawbacks is transient reflection spectroscopy. This technique measures the difference in reflection of a broadband probe beam of a sample between the excited and ground state [Citation57]. An overview of this technique is shown in , in the case of a perovskite sample, excited at 400 nm. The result of this measurement is shown in [Citation58]. Due to the relation between the real and imaginary part of the refractive index, the inverse Hilbert Transform can be applied to obtain the change in transmission.
To retrieve the spectrally resolved refractive index change from the change in reflection, models are required [Citation30,Citation34,Citation38]. These models include the sample geometry to accurately describe the reflected spectrum, often requiring the transient absorption spectrum as well to eliminate absorption effects [Citation30,Citation35]. The strong model dependency of this technique allows for inaccuracies in the retrieved transient refractive index spectrum. Furthermore, the transient reflection signal is dominated by the sample surface, for which the properties can deviate from the bulk due to surface defects [Citation29]. This also means that this technique is unsuited to measure the refractive index change of dissolved materials or gases as the overall change of the refractive index of these states is too small to resolve due to the low density of photoactive material [Citation40].
2. Frequency domain interferometry
2.1. Concept
In 1992, Tokunaga et al. published the first ultrafast frequency domain interferometer, an adaptation of transient absorption spectroscopy [Citation41]. Here, instead of the change in intensity of the probe pulse after transmission or reflection upon photoexcitation of a sample, as in transient absorption or reflection spectroscopy, respectively, the change in relative phase between a broadband reference-probe pulse pair after photoexcitation is measured. This is done by measuring the phase of the interference pattern in the frequency domain of the interfering reference-probe pulses on a detector allowing for the observation of time-dependent and spectrally resolved refractive index change.
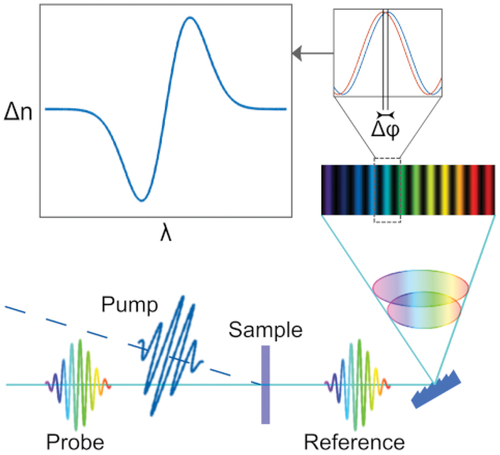
The basic components of the frequency domain interferometer are shown in [Citation33]. A broadband pulse is split into an equal reference-probe pulse pair using a 50/50 beam splitter. A Michelson interferometer configuration is used with a manual translation stage in one of the arms to set a delay for the probe with respect to the reference pulse and recombine the beams onto the same optical path. All reference, probe and pump pulses are then focused onto a sample, with the pump pulse arriving at the sample at a time between the reference and probe arrival time, to only modulate the phase of the probe pulse. The reference and probe pulses are collimated and sent to a spectrometer. Here, the pulses temporally stretch due to the spectral dispersion of a grating so that they temporally overlap at the detector, creating an interference pattern in the frequency domain [Citation59,Citation60].
Figure 2. (a) Schematic of the FDI experiment. A broadband pulse is split into an equally intense reference and probe pulse and delayed by a Michelson interferometer. Both beams are then directed onto a sample, with a pump pulse arriving between the reference-probe pair arrival time. The reference and probe are then spectrally dispersed, which result in a temporal dispersion so that the reference-probe pair temporally overlaps at the detector, creating an interference pattern in the frequency domain. (b) Interferogram obtained by the detector and just the probe pulse, multiplied by 2. (c) Close-up of the ground and excited state interferograms showing a small displacement of the peak position. (d) Obtained phase shift of microcrystalline CsPbBr3 perovskite after excitation with a 400 nm pump pulse, generating an excitation density of 1.5 1017 cm−3. Reprinted with permission from reference [Citation33]. Copyright 2019 American Chemical Society.
![Figure 2. (a) Schematic of the FDI experiment. A broadband pulse is split into an equally intense reference and probe pulse and delayed by a Michelson interferometer. Both beams are then directed onto a sample, with a pump pulse arriving between the reference-probe pair arrival time. The reference and probe are then spectrally dispersed, which result in a temporal dispersion so that the reference-probe pair temporally overlaps at the detector, creating an interference pattern in the frequency domain. (b) Interferogram obtained by the detector and just the probe pulse, multiplied by 2. (c) Close-up of the ground and excited state interferograms showing a small displacement of the peak position. (d) Obtained phase shift of microcrystalline CsPbBr3 perovskite after excitation with a 400 nm pump pulse, generating an excitation density of 1.5 × 1017 cm−3. Reprinted with permission from reference [Citation33]. Copyright 2019 American Chemical Society.](/cms/asset/dfe731dd-fcd8-4aaa-b5eb-05b98ba8ca11/tapx_a_2065218_f0002_oc.jpg)
To obtain the change in refractive index from the ground state to the excited state, the sample has to be excited between the arrival time of the reference and the probe pulses. The total accessible time delay is determined by the temporal stretching of the reference and probe pulses within the spectrometer and is typically limited to several ps. This stretching temporally overlaps the reference and probe pulses after the sample so that an interference pattern can be observed. In the case of Tamminget al., used as example in , the time delay between the reference and probe pulse is limited by the 1200 grooves/mm grating and set at 2 ps to obtain sufficient contrast in the interference pattern.
The interference in the frequency domain occurs when the reference and probe pulses arrive at a detector with a time delay. The electric fields of the reference and delayed probe pulses individually are given by
where is the time delay between the reference and probe pulse and
is the frequency. The intensity of the interference pattern is described by taking the Fourier transform of the sum of the electric fields, assuming equal intensity of the reference and probe pulses,
shows the interference pattern from the reference and probe pulses and the intensity of the probe signal alone. Note that the intensity of the valley of the interference pattern is non-zero, which is the result of the partial temporal overlap of the reference and probe pair, where the part of the pulses which do not interfere adds to a baseline intensity.
The change in the real part of the refractive index changes the optical path length within the sample, which extends or reduces the time delay between the reference and probe pulse pair. The intensity of the reference-probe pulse pair on the detector after excitation is given by
where is the change in the imaginary part of the refractive index,
is the frequency,
is the thickness of the sample and
is the change in refractive index after excitation. This shows that both the intensity of the spectrum and phase changes if the complex refractive index change. This can be seen in , where the intensity has increased, and the phase has slightly shifted to lower energy.
Note that any chirp of the broadband reference and probe pulses does not impact the obtained phase as the pulses are exact replicas, created from a single pulse, containing the same amount of chirp. This means that both beams have the same time delay at the spectrometer for each individually measured wavelength when the sample is in the ground-state. The chirp, however, might create a relative delayed observed response between wavelengths, which is commonly observed with transient absorption spectroscopy [Citation61,Citation62]. Therefore, similar chirp correction procedures as routinely applied for transient absorption spectra, or transform limited reference and probe pulses can be used to eliminate this artefact [Citation63,Citation64].
Tokunaga et al. used the minima of the interferogram to retrieve the shifts of phase after excitation of CdSexS1-x microcrystallites dispersed in glass [Citation41]. This sample was chosen as it has a large nonlinear refractive index required to resolve the phase shift using the minima position. The interferogram at 20 fs is shown in the top plot of , and the retrieved phase shift, and differential transmission signal, is shown in the bottom plot, showing a large phase shift close to 0.5 rad below the band edge. The time-dependent differential transmission and phase shift are shown in . The phase shift shows a derivative like shape with a negative sign compared to ground state plasma resonances, with the zero crossing at the band edge, which is in agreement with models for an excited system [Citation18,Citation48].
Figure 3. FDI and transient absorption results of dispersed CdSexS1-x microcrystallites. The top plot of (a) shows the excited state, a, and ground state, b, transmitted interferogram, 20 fs after excitation with a 620 nm pump pulse. c shows the difference in the transmitted interferograms. (b) shows the time-dependent differential transmission signal and the obtained phase shift. Here, a is the excited state transmission spectrum, b is the ground state transmission spectrum and c is the differential transmission signal. The open dots indicate the retrieved phase shift. Reprinted with permission from [Citation41] © The Optical Society.
![Figure 3. FDI and transient absorption results of dispersed CdSexS1-x microcrystallites. The top plot of (a) shows the excited state, a, and ground state, b, transmitted interferogram, 20 fs after excitation with a 620 nm pump pulse. c shows the difference in the transmitted interferograms. (b) shows the time-dependent differential transmission signal and the obtained phase shift. Here, a is the excited state transmission spectrum, b is the ground state transmission spectrum and c is the differential transmission signal. The open dots indicate the retrieved phase shift. Reprinted with permission from [Citation41] © The Optical Society.](/cms/asset/7dcd629f-2485-46e9-b76d-5b44eef50028/tapx_a_2065218_f0003_b.gif)
An improved method to extract the phase information written in the interferogram is via windowed Fourier extraction methods [Citation65–67]. This technique takes small spectral windows, in the order of nanometers, and takes the Fourier transform of this window. The phase corresponding to the dominant frequency is then extracted for both the ground and excited state and subtracted to give the phase difference. This allows for the extraction of sub-pixel phase shifts observed for thin-film photovoltaics [Citation33,Citation35]. These results are shown in for a thin microcrystalline CsPbBr3 perovskite film.
Finally, the change of phase can be used to extract the change in the refractive index using
where is the thickness of the photoactive material. This means that, if the thickness of the sample is known, the wavelength-dependent change in refractive index can directly be retrieved.
2.2. Reflection frequency domain interferometry
Besides transmission, this technique can also be applied in the reflection configuration [Citation68]. The reflection FDI can measure the spatially dependent plasma dynamics and surface deformation after photoexcitation simultaneously [Citation69–71]. The experimental details of this technique are discussed in section 3.3. This technique relies on a reference and probe beam with equal intensity distribution between P- and S-polarisation and independent detection of both polarisations after the sample surface.
Considering a probe beam arriving at a 45° incident angle with respect to a flat sample surface, the reflection part of the Fresnel equations results in
and
where and
are the intensity of the reflection and
and
are the phase of the P- and S-polarised components [Citation4]. Note that these equations are independent of the refractive index itself. When a pump pulse excites the sample, excited state carriers and possibly surface deformations are induced. The excited state carriers change the refractive index and thereby change the reflection
, showing that the intensity difference of the reflected beam can be used to obtain the complex refractive index change using the Fresnel equations. Note that Equationequation 11a
(11a)
(11a) is still valid under changing refractive index and only breaks once the free plasma is expanding off the surface [Citation71,Citation72].
The surface deformation changes the optical path length resulting in a phase shift between the reference and probe pulse, where the surface deformation can be obtained by
This shows that a surface deformation breaks the condition of Equationequation 11b(11b)
(11b) . Therefore, by measuring the phase difference of both the P- and S-polarisation components of the probe beam, the total surface deformation can be obtained.
3. Applications of ultrafast FDI spectroscopy
3.1. How reflection affects the transient absorption spectrum of metal-halide perovskite
Metal-halide perovskite materials have gained a significant amount of attention since its first application in solar panels. Since 2009, the power conversion of a single active layer solar cell has increased from 3.8% to 25.8% present day [Citation73,Citation74]. The optical properties of these materials can be adjusted by the composition, dimensionality and size, allowing for a broad range of absorption and emission wavelengths, exciton binding energies and carrier diffusion lengths, which makes them excellent candidate materials for solar, LED and laser applications [Citation75–77].
A key technique often applied to analyse the excited state dynamics of the photovoltaic perovskite materials is transient absorption spectroscopy [Citation30,Citation78,Citation79]. From the shape and dynamics of the transient absorption spectrum, information regarding bandgap renormalisation, carrier-lifetime and hot carrier cooling is obtained. The latter has shown that photovoltaic perovskite has a long hot-carrier lifetime, in the order of ps [Citation80]. This is relevant for hot-carrier solar cell applications, where carriers with energy exceeding the band gap are extracted from the active material before cooling down to the band edge. This is done to reduce the thermal losses and to maximise the energy that can be extracted [Citation81,Citation82].
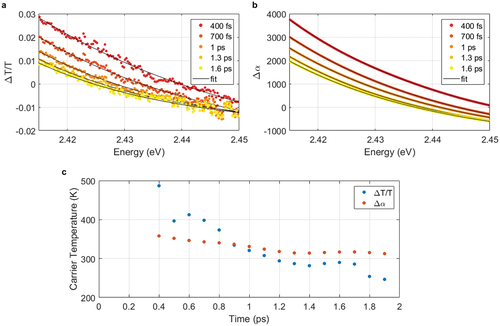
To investigate the carrier temperature, and the cooling rate of the carriers, the Fermi–Dirac distribution is fitted to the transient absorption spectrum at the high energy side of the ground state bleach [Citation30]. This is the region between 2.4 and 2.45 eV in the case for the CsPbBr3 perovskite sample shown in [Citation33]. The transient absorption spectrum, however, contains information regarding both change in transmission and reflection. This has sparked a debate about the origin of the negative signal observed in the region above the band edge, that is, above 2.43 eV.
Figure 4. Results of FDI on CsPbBr3 perovskite after excitation at 400 nm with a carrier density of 1.5 1017 cm−3 with (a) the change in real refractive index, (b) change of the imaginary refractive index, (c) change in the absorption coefficient. (d) shows the retrieved transient absorption spectrum using Fresnel equations and (e) shows the change in transmission and reflection normalised to the sum of the ground state transmission and reflection. Reprinted with permission from reference [Citation33]. Copyright 2019 American Chemical Society.
![Figure 4. Results of FDI on CsPbBr3 perovskite after excitation at 400 nm with a carrier density of 1.5 × 1017 cm−3 with (a) the change in real refractive index, (b) change of the imaginary refractive index, (c) change in the absorption coefficient. (d) shows the retrieved transient absorption spectrum using Fresnel equations and (e) shows the change in transmission and reflection normalised to the sum of the ground state transmission and reflection. Reprinted with permission from reference [Citation33]. Copyright 2019 American Chemical Society.](/cms/asset/247c0344-76b5-4f0f-8aa6-dfa2b29ccb41/tapx_a_2065218_f0004_oc.jpg)
Whereas Price et al. [Citation30] suggested that the origin is from the change in reflection due to the refractive index change, others have used indirect methods and models to obtain information regarding the impact of the change in reflection and found that the change in absorption is the dominant contribution to this transient absorption signal [Citation83]. The latter is supported by results from transient reflection spectroscopy, where the difference in the excited state reflectivity between the air–perovskite and substrate–perovskite boundary is measured [Citation34]. This is further supported by results from density functional theory modelling, which show a small variation in the real part of the refractive index [Citation84].
While the impact of the real part of the refractive index is small, it does impact the spectral shape of the transient absorption spectrum. Therefore, full understanding of the refractive index change, and thereby reflection change, is required to properly interpret the spectral features within a transient absorption spectrum. The techniques to obtain the change in the refractive index discussed so far obtain the result in an indirect and model-dependent fashion. Tamming et al. have used the FDI technique to directly measure the change in the refractive index of a microcrystalline CsPbBr3 perovskite film [Citation33]. The resulting refractive index change in shown in after excitation with a 400 nm pump pulse, resulting in an excitation density of 1.5 1017cm–3. They have applied Kramers–Kronig relations, allowed for this technique [Citation45], to obtain the imaginary part of the refractive index and the actual change in absorption coefficient, shown in ), respectively.
The refractive index change obtained with this method is validated by calculating the transient absorption spectrum from the ground and excited state complex refractive index using Fresnel equations, and comparing it to an actual transient absorption measurement under identical conditions [Citation4]. The result is shown in , showing excellent agreement between the results of both techniques.
Besides the transient absorption signal, the actual change in reflection, normalised to the sum of the transmission and reflection, is calculated as well. This shows that the change in the real part of the refractive index has an impact on the spectral shape of the ground state bleach observed with transient absorption. The negative transient absorption signal at the high energy side of this bleach, whose origin is under debate, corresponds to a region where the change in reflection goes to zero, indicating that the photoinduced absorption signal in this region is actually from a change in the imaginary part of the refractive index, and thus absorption rather than reflection as previously suggested [Citation30].
As mentioned earlier, perovskite materials are an excellent candidate for hot carrier solar panels due to their long hot-carrier lifetime [Citation81,Citation85]. The hot-carrier lifetime is further extended when under high photon illumination, where the hot-phonon bottleneck starts to play a significant role [Citation86]. The spectral shape obtained by transient absorption spectroscopy is relevant to determine the carrier temperature, where the Fermi–Dirac distribution is fitted to the high energy side of the ground state bleach as shown in ) for the transient absorption spectrum and differential absorption coefficient, respectively, [Citation30,Citation87]. This means that the observed temperature is sensitive to the spectral shape and that, without taking the change in reflection into account, the carrier temperature directly after excitation is significantly overestimated by over 100 , as shown in [Citation33]. Furthermore, the temperature, obtained via transient absorption spectroscopy, has a steeper decrease with a final temperature at 1.9 ps is 250°C, which is below room temperature. This indicates that separation of the optical constants is required to obtain reliable information from the spectral shape of a transient absorption spectrum.
Figure 5. Fitting of the Fermi–Dirac distribution to the high energy side of the bleach signal with an initial excitation density of 1.5 1017 cm−3 using the (a) transient absorption spectrum and (b) Δn spectrum as obtained using FDI, and (c) the obtained carrier temperature over time.
The lower initial temperature obtained by fitting the Fermi–Dirac distribution to the change in absorption coefficient indicates that the carriers in perovskite materials have less initial excess energy than thought previously, meaning that there is less energy to extract per charge carrier. This is relevant for hot-carrier solar cell applications, as these devices extract the charges before they cool down to the band edge. Therefore, when choosing the electron and hole extraction layers based on the temperature obtained via transient absorption spectroscopy, less carriers would be extracted. Furthermore, the change in the real part of the refractive index was found to increase the total reflection of a concentrating solar-cell device, lowering the short-circuit current of these type of devices by 2.3% and 6.3% for 100 and 250 sun equivalents, respectively, [Citation33].
3.2. Phase modulation by colloidal nanoplatelets
Besides providing a better understanding of the transient absorption spectrum, the intrinsic knowledge of the Δn spectrum is relevant for phase modulating applications as well. Instead of using the intensity of light, control of the phase of light provides an additional information manipulation pathway, which can be implemented in optical logic gates and photonic on-chip devices [Citation88,Citation89].
A potential candidate for electronic and photonic phase modulators are colloidal nanoparticles, due to their strong quantum confinement [Citation78,Citation90]. This strong quantum confinement results in a excitonic dominated response with corresponding sharp absorption edges and nonlinear optical absorption. The strong photoinduced absorption change, measured via transient absorption spectroscopy, indicates a strong modulation of the refractive index as well [Citation40]. This is further supported by modeling, which has shown a refractive index change of nanoparticles with strong quantum confinement, extending far below the absorption band [Citation91].
To verify this prediction, the FDI technique is applied to directly measure the change in the refractive index of CdSe nanoplatelets after photoexcitation [Citation40]. The transient phase spectrum is obtained for a small spectral window and is used to verify the results from a Kramers–Kronig-based model, using the transient absorption spectrum as input. The results from the model, and the steady-state refractive index of CdSe nanoplatelets, dissolved in hexane, are shown in , showing a broad negative signal below the heavy hole band edge at 510 nm.
Figure 6. (a) Real part of the refractive index change of CdSe nanoplatelets in hexane. Inset is the ground state refractive index. (b) Comparison between the phase change obtained via FDI and a Kramers–Kronig-dependent model, using a transient absorption spectrum of the CdSe nanoplatelets. LH and HH indicate the energies corresponding to the light and heavy holes respectively. (c) Excitation density-dependent refractive index change obtained via the Kramers–Kronig model. (d) Excitation-dependent refractive index change near the intraband transition. Adapted with permission from [Citation40]. Copyright 2021 American Chemical Society.
![Figure 6. (a) Real part of the refractive index change of CdSe nanoplatelets in hexane. Inset is the ground state refractive index. (b) Comparison between the phase change obtained via FDI and a Kramers–Kronig-dependent model, using a transient absorption spectrum of the CdSe nanoplatelets. LH and HH indicate the energies corresponding to the light and heavy holes respectively. (c) Excitation density-dependent refractive index change obtained via the Kramers–Kronig model. (d) Excitation-dependent refractive index change near the intraband transition. Adapted with permission from [Citation40]. Copyright 2021 American Chemical Society.](/cms/asset/cd177a8d-926c-4606-ad20-a1a0ce261afa/tapx_a_2065218_f0006_oc.jpg)
The model is verified by comparing the retrieved differential phase spectrum to the differential phase spectrum of CdSe dissolved in hexane obtained with FDI, as shown in . This shows excellent agreement between the differential phase spectrum obtained by FDI and the Kramers–Kronig model. The larger spectral window obtained for the Δn spectrum based on the Kramers–Kronig model shows a large negative Δn signal below the bandgap. This Δn is strongly dependent on exciton density, as shown in ), with a maximum Δn of −1.6 at the heavy hole resonance with an exciton density of 110 excitons per nanoplatelet.
In the region below the band edge, between 510 nm and 1100 nm, there is a broad negative feature as an effect of the strong quantum confinement, which was not observed with bulk materials [Citation33]. This spectrum has an additional dip at 1050 nm as shown in . This feature is the result of the additional intraband transition, which is enabled in the presence of excited state carriers [Citation92], creating an additional transition frequency with corresponding Drude-Lorentz oscillator feature. This feature is mirrored in wavelength to the state-filling feature, as this is an additional absorption rather than a reduction of absorption.
In this same region, the absorption coefficient of these nanoparticles is close to zero [Citation40]. This means that the phase of light with the wavelength in this region, traveling through this material, can be controlled at a femtosecond timescale, while minimising absorption losses within the material.
Using FDI on these type of materials can help understand the phase modulation properties in an excitation density-dependent manner and at a femtosecond timescale. In the future, the FDI can be used to capture a broader spectrum by obtaining multiple spectral windows consecutively to directly obtain the full differential phase spectrum, rather than relying on models. This technique is fast to implement as it does not require full device structures to analyse the phase modulation and provides spectrally dependent information.
3.3. Surface displacement of phase-change material
Another application of the FDI technique is in the field of optical phase-change materials [Citation93,Citation94]. These materials have the capability to rearrange the atomic structure between a resistive and conductive state upon photoexcitation, depending on the excitation density [Citation95,Citation96]. While the resulting resistivity change is easily observed, the actual mechanism behind the switching is strongly material dependent and remains poorly understood. The lack of understanding regarding the phase-change process limits the ability to design new materials with shorter switching times, required to optimise real-life implementation of this technique.
To obtain a better understanding of the phase change process, Martinez et al. used the FDI technique in the reflection configuration to measure the surface displacement and dielectric response of amorphous GeTe thin films after photoexcitation [Citation72,Citation93]. The system used to measure the interferograms is shown in . Here, a time delay of 8.7 ps between the reference and probe is set, limited by the thickness of the calcite crystal used to delay the probe with respect to the reference pulse. This larger time delay, compared to the delay used for the transmission FDI, is allowed due to the larger dispersion of the 1800 grooves/mm grating used for this experiment. This grating creates a stronger spectral dispersion and thereby temporal stretching of the pulse. The surface displacement at increasing fluences is calculated from the phases of the frequency domain interferograms of both S- and P-polarisations, which are measured simultaneously. An example of the obtained interferograms is shown in .
Figure 7. (a) Reflection FDI set-up used to measure the surface displacement and dielectric change of an amorphous 500 nm thick GeTe sample, (b) obtained interferograms, 8.5 ps after photoexcitation with a fluence of 80 mJ/cm2, (c) time-dependent displacement and d) dielectric function change for various fluences. Reprinted with permission from [Citation93].
![Figure 7. (a) Reflection FDI set-up used to measure the surface displacement and dielectric change of an amorphous 500 nm thick GeTe sample, (b) obtained interferograms, 8.5 ps after photoexcitation with a fluence of 80 mJ/cm2, (c) time-dependent displacement and d) dielectric function change for various fluences. Reprinted with permission from [Citation93].](/cms/asset/79030378-5038-41b0-b7e5-d162748971e3/tapx_a_2065218_f0007_oc.jpg)
From here, the phase of the interferograms after photoexcitation is obtained and used to calculate the displacement according to Equationequation 12(12)
(12) for the case of a 45 probe incidence angle, which is shown in . As the phase change can only be measured between the reference and probe arrival time, this measurement is limited to an 8.7 ps time window. This shows a continuously increasing displacement in time after a delay of about 1 ps at fluences higher than 26 mJ/cm2, up to −4 nm with an excitation density of 80 mJ/cm2. The shrinkage is attributed to the melting or generation of a higher density solid state of the GeTe film. Phase-contrast microscopy of the sample after the measurement has shown the formation of fingerprint patterns at the surface, indicative of the formation of a liquid state under these fluences, which is further verified by ab initio molecular dynamics simulations. The slow decrease of the surface displacement at high fluences is contributed to thermal diffusion from the excited surface to the back of the sample, as the absorption depth of the pump is calculated at 125 nm at 800 nm excitation wavelength, while the sample has a thickness of 500 nm. As for low fluences, a non-thermal direct solid–solid transition is found as a result of the bond-softening after excitation. For both transitions, it is found that the motion of the Ge atoms dictates the phase transition as they shift from a tetrahedral environment to an octahedral configuration directly after excitation, while the Te atoms remain mostly undisturbed.
At the same time, the intensity of the interferograms is measured and used to calculate the change in the complex dielectric function, shown in . Here, the dielectric function shows an immediate response upon photoexcitation as the excited state carriers occupy the available states above the Fermi level. This results in a non-equilibrium condition where the carriers and lattice have two distinct temperatures. At a ps timescale, the additional carrier energy is transferred to the lattice via electron-phonon coupling to reach an equilibrium temperature. This lattice heating is what drives the phase transition at high fluence excitation, explaining the 1 ps delay of the surface displacement.
Using the FDI has allowed to verify the results ab initio molecular dynamics simulations on these materials to unravel the phase change mechanism of GeTe. Understanding this phase transition provides pathways to improve this material and develops new materials with increased switching speeds required for phase change memory devices. Furthermore, full understanding is required to apply these type of materials in the field of ultrafast optical switching [Citation97].
4. Emerging improvements to FDI techniques
While capable of directly measuring the phase change upon photoexcitation, the FDI presented so far comes with some drawbacks. The first one is the available temporal range of the FDI over which the kinetics can be measured. This temporal range is determined by the temporal stretching of the pulses after the grating in the spectrometer. Depending on the specifications of the grating and the required spectral resolution, the temporal separation between the reference and probe pulses is realistically limited to a few ps. This makes it hard, or even impossible, to measure dynamics with a lifetime longer than a few ps.
The second drawback is determined by the light sources used for this experiment. Martinez et al. use a NOPA to generate the probe pulse and use the fundamental pump beam. This sets limitations on the wavelength range, which is probed by this technique, and the excitation wavelength [Citation93]. As for the transmission FDI, lower resolution is sufficient to obtain the refractive index change of materials at a 10–4 level [Citation40]. Here, to obtain a broad spectrum, bulk supercontinuum generation is used to cover a significant spectral window, whilst using second harmonic generation for the pump pulse to excite above the band edge. These systems are limited in measuring short-lived excitations by their pulse durations, where the pulse durations determine the duration of the instrument response function. Furthermore, the relative high resolution, compared to transient absorption or reflection spectroscopy, required for these experiments to resolve the small phase changes demands a high spectral density of the reference and probe pulses to obtain sufficient photon count on the detector to reduce the impact of background noise.
Recently, two improvements have been made to improve the FDI system [Citation35]. The first is the implementation of a Sagnac interferometer configuration, which enables measurements on timescales, which are only limited by the available delay line used to delay the pump with respect to the probe beam. A slight variation of this technique has previously been implemented to measure the phase of CS2 [Citation61], where one of the mirrors in the Sagnac interferometer is slightly misaligned to obtain an interference pattern perpendicular to the spectral axis. The Sagnac configuration has the added benefit of being a common-path interferometer, which passively stabilises the phase of the reference and probe pulse. The second development is the Multiple Plate Compression (MPC) light source, first implemented in transient absorption spectroscopy [Citation64,Citation98,Citation99]. This light source uses a series of thin plates to generate a broad and intense supercontinuum, which can be compressed down to the single cycle [Citation100]. Due to its high spectral density, a single MPC light source provides sufficient photons to generate the pump, reference and probe pulses with a high photon count on the detector.
4.1. Extended temporal range and improved stability via Sagnac FDI
The time delay limitation is overcome by implementing a Sagnac interferometer configuration [Citation35,Citation61]. For the Sagnac configuration, the sample is placed off-center on the beam path so that the reference pulse travels through the sample before the probe pulse does, allowing for excitation between the arrival times of these pulses. After the interferometer, the pulses are temporally overlapped with only the time difference induced by the difference of the refractive index of the sample. This means that the temporal separation of the reference and probe pulse is not limited by the temporal overlap at the detector but is determined by the path length difference of the reference and probe path to the sample. This allows for the observation of slower kinetics due to a longer possible time delay between the pump and probe pulses. On top of that, the Sagnac interferometer is a common-path configuration, which has the added benefit of eliminating mechanical, thermal and air flow-induced instabilities that come with a two-armed interferometer [Citation101].
As the correlation between shots decreases over time due to changing environmental conditions, shot-to-shot observation of the phase modulation is critical to obtain a high sensitivity in ultrafast pump-probe spectroscopy [Citation102,Citation103]. To achieve this, the Sagnac configuration is used with a frequency domain interferometry system, using a fast 1D camera to capture each individual shot. This system is used to measure the optically induced phase change in a 100 nm-thick pentacene sample [Citation35].
The basic components of this system are shown in . In this system, a polariser is used to create the reference and probe pulse pair with S- and P-polarisation, respectively. Making use of the polarisation of these pulses, a birefringent wedge pair is placed after the interferometer section to delay the probe with respect to the reference pulse, resulting in an interference pattern in the frequency domain at the detector. This wedge pair allows for a tunable time delay to account for the wavelength-dependent period of the interference pattern and thereby maximising the sensitivity of the system over a broad wavelength range. Furthermore, by moving the polariser out of the common-path interferometer, this technique is converted into a regular transient absorption spectrometer.
Figure 8. (a) Schematic of the set-up used for the Sagnac-FDI experiment on pentacene. (b) Absorption (red) and excitation (blue) spectrum. (c) False colour plot showing the refractive index change of pentacene with a fluence of 400 μJ/cm2. (d) Time traces centered at 640 and 700 nm. (e) Measured spectrum (dots) and obtained by the model of Ashoka et al. [Citation35], 500 fs after excitation.
![Figure 8. (a) Schematic of the set-up used for the Sagnac-FDI experiment on pentacene. (b) Absorption (red) and excitation (blue) spectrum. (c) False colour plot showing the refractive index change of pentacene with a fluence of 400 μJ/cm2. (d) Time traces centered at 640 and 700 nm. (e) Measured Δn spectrum (dots) and obtained by the model of Ashoka et al. [Citation35], 500 fs after excitation.](/cms/asset/1e007a77-1d7e-47f4-b018-edc9bc3b8c82/tapx_a_2065218_f0008_oc.jpg)
4.2. Multiple plate compression as a single broadband light source
The pulses for the Sagnac-frequency domain interferometer discussed in the previous section are generated by a novel light source in the field of ultrafast pump-probe spectroscopy, the MPC [Citation35,Citation99,Citation104,Citation105]. This light source uses a series of thin plates with a high nonlinear susceptibility to generate intense broadband pulses, which are compressible to the single cycle [Citation100]. This method has recently been implemented in transient absorption spectroscopy as a single 3.3 fs light source for both pump and probe pulses [Citation64,Citation98]. A double-stage MPC is used, based on a 100 fs Ti:Sapphire amplifier system, to obtain spectral broadening to a spectrum spanning from 500 to 950 nm with a spectral density of over 10 nJ/nm.
The MPC combined with the Sagnac-FDI configuration is applied to measure the refractive index change of Pentacene [Citation35]. This organic photovoltaic material has gained a lot of attention due to its capability of singlet fission, providing a pathway to overcome the Shockley-Queisser limit for the efficiency of photovoltaic cells [Citation106]. As this organic semiconductor material has an absorption spectrum with multiple optical resonances, as shown in , the transient absorption and refractive index is expected to be complex as well.
An evaporated pentacene sample with a thickness of 100 nm is excited with the spectrum shown in , using a short-pass filter in the pump path. The obtained wavelength-dependent refractive index change is shown in , where 13 phase spectra with a window width of 45 nm are merged to show the full wavelength range. The wavelength range per spectrum is limited by the physical width of the detector and the spectral resolution required for this method. The required amount of spectra can be reduced by using a physically wider detector. The kinetics at 640 nm and 700 nm are shown in , showing that the refractive index change as short as 100 fs up to 890 ps is observed. This allows this technique to measure both fast and slow dynamics after photoexcitation.
Finally, this measurement is used to verify a model developed by Ashoka et al. to obtain the complex refractive index change from the steady-state absorption spectrum and transient absorption or reflection spectrum [Citation35]. The comparison between the obtained transient refractive index spectrum at 500 fs after excitation is shown in . Here, the spectrum obtained via the model has been rescaled to match the amplitude of the FDI results, as the excitation density of the transient absorption measurement was lower. This shows that the spectral features of both the results from the FDI and the model match, with the exception of the sharp dip at 790 nm in the FDI spectrum, which is an experimental artifact associated with the fundamental laser wavelength.
5. Discussion
The results so far have shown the versatility of this technique as the configuration can be adapted to suit the needs and capabilities of the user. The Michelson FDI is a straightforward implementation to existing transient absorption systems and provides crucial information of the refractive index on a short timescale. The Sagnac-FDI requires some modification, but provides information on longer timescales and can be adapted to measure transient absorption as well.
The FDI technique is capable of measuring the phase change induced by organic and inorganic photovoltaic materials and obtaining the corresponding refractive index change in the transmission configuration. In the reflection configuration, it can measure ultrafast surface displacement. When required, it is possible to tune the phase resolution by increasing both the time delay between the reference and probe pulse and spectral dispersion at the detector.
As the FDI technique measures the phase rather than the refractive index directly, information regarding the sample thickness is required. However, the spectral shape and timescales of the kinetics can still be obtained when the thickness cannot be measured. Furthermore, it is possible to measure dissolved and blended materials as well where, in the case for the blended material, the obtained refractive index change is the average over the blended material similarly to transient absorption spectroscopy [Citation40].
To measure a large spectral range, multiple measurements are required to obtain sufficient spectral resolution to measure the small phase shifts. However, spectral windows of 100 nm can be obtained at once, compared to the single wavelength of the transient deflection technique, providing the ability to distinguish time-dependent spectral shifts from decay kinetics [Citation107].
Whereas models have recently been developed to extract the refractive index information from transient absorption spectra, small discrepancies are observed [Citation35]. These discrepancies can have various origins. The contribution from stimulated emission has to be subtracted from the transient absorption spectrum before calculating the transient refractive index spectrum as it does not contribute to the phase of the beam. Besides that, the numerical methods rely on the Kramers–Kronig relations, for which the spectrum from zero to infinite wavelength is required. Missing spectral features in the transient absorption spectrum near the observed wavelengths can result in false refractive index spectra [Citation33]. Therefore, the results obtained by these models will always have to be verified with a direct measurement.
Since the initial publication of the FDI technique in 1992, technology has advanced [Citation41]. Improved computation power allows a routine use of the Fourier transform to extract the phase of the interference pattern at small spectral windows [Citation66,Citation108]. This increases the spectral resolution of the observed phase shift as the spectral window used to calculate the phase can be shifted over by a single pixel, circumventing the direct use of the intensity of the minima of the interferogram.
6. Future outlook
The next-generation photovoltaic materials that are currently being investigated have a high refractive index [Citation1,Citation109]. This higher refractive index generally results in a lower exciton binding energy due to the dielectric screening, making it easier for an exciton to dissociate and generate free charges [Citation110]. A high refractive index suggests that a large change in refractive index after photoexcitation can be expected. This means that the change in refractive index starts to contribute to the signal obtained via transient absorption spectroscopy, often used to obtain information regarding the excited state dynamics. Therefore, applying the FDI technique in association with transient absorption spectroscopy can help to avoid misinterpretation of these spectra.
This technique can be used to measure the dynamics of photoinduced plasma generation in solid-state materials or gases [Citation111]. This can help, for example, to obtain a better understanding of laser ablation on a femtosecond timescale, where a plasma is formed in a material to remove material, and photonic crystal damage mechanisms [Citation112–114].
Recently, epsilon-near-zero materials have gained interest because of their strong nonlinear behaviour [Citation115–117]. These materials, such as ITO and fabricated meta-materials, have a zero crossing in their dielectric function, resulting in a zero refractive index [Citation118]. In a zero-refractive index medium, the phase velocity and wavelength of light become infinite. It also means that all light transmitted is emitted perpendicular to the surface of this material [Citation119]. Small modulations of the refractive index result in large modulation effects, as the relative change goes to infinity. As the refractive index is modulated upon photoexcitation, FDI can be applied to provide time-dependent information regarding the refractive index change of these materials at and near the zero crossing.
Furthermore, understanding the refractive index of a material in the ground and excited state is important for laser applications, as the refractive index affects the final emission conditions [Citation22,Citation33,Citation120,Citation121]. As these lasing materials operate under high excitation conditions, a large refractive index change is expected. This refractive index change impacts the self-focusing, emission wavelength, beam quality and output power of the lasing device [Citation23,Citation122]. To optimise laser application, this excited state refractive index has to be accounted for in device design.
7. Conclusion
The transmission FDI is an adaptive technique, which can be applied to obtain direct information regarding the real part of the refractive index and surface displacement after photoexcitation, depending on the geometry of the technique. This is done by measuring the phase between a temporally delayed broadband reference and probe pulse, where the excitation occurs between the sample arrival time of the reference and probe pulse. Temporal stretching of these pulses as a result of spectral dispersion caused by a grating allows for temporal overlap of the reference and probe pulse after the sample, creating an interference pattern in the frequency domain on the detector. The excited state phase of the interferogram is then extracted and compared to the ground state phase to obtain the phase change, which is directly related to the change in optical path length induced by either a refractive index change of the sample or additional path length of the probe pulse due to surface deformation of the sample.
The transmission FDI measures the spectrally dependent change of the phase of light traveling through a material after photoexcitation at a fs timescale. This technique has been applied to a microcrystalline CsPbBr3 perovskite film and CdSe nanoplatelets in solution to uncover the refractive index change after photoexcitation. The results obtained by FDI for the perovskite sample have settled a debate regarding the origin of the ambiguous signal above the band edge, indicating that this signal is the result from a change in absorption rather than reflection. Furthermore, while the change in reflection is not the dominant contribution, it does have an impact on the spectral shape obtained by transient absorption spectroscopy. This shape is important when measuring the carrier temperature, which is obtained by fitting the Fermi–Dirac distribution to the high energy side of the band edge. Here, the temperature obtained via FDI is significantly lower, more than 100 , than previously obtained via transient absorption spectroscopy. These results are relevant for hot-carrier extraction applications, where carriers with excess energy are extracted from the material before cooling down to the band edge.
The FDI results obtained with the suspended CdSe nanoplatelets, on the other hand, were used to verify a model based on the Kramers–Kronig relations to obtain the refractive index change from transient absorption spectra. This model demonstrates that a broad negative feature below the band edge is expected as a result from the strong excitonic behaviour of these nanoplatelets. As the absorption in this region is negligible, these materials are excellent candidates for phase modulation applications in the wavelength range between 510 and 1100 nm. Further FDI measurements, covering a larger spectral range, can further verify these results in the future.
Whereas a Michelson-FDI configuration is a straightforward adaptation of transient absorption and can be implemented in most existing systems, there are limitations on the available temporal range as the reference and probe pulse have to temporally overlap to create an interference pattern on the detector. This is overcome when implementing the Sagnac-FDI configuration, which requires a more significant modification to existing transient absorption spectroscopy systems. However, the Sagnac-FDI is backwards compatible and can be used for transient absorption measurements as well.
The second configuration, the reflection FDI, measures the surface displacement at a fs timescale after photoexcitation. This technique is applied to measure the surface deformation of amorphous GeTe upon photoexcitation. Here, the FDI has shown that the GeTe layer shrinks at a fluence of 26 mJ/cm2 or higher. This surface deformation is triggered by the lattice heating as a result of electron-phonon coupling. Further ab initio molecular dynamics modelling has supported this two-temperature model and found that a state similar to the liquid state is formed after photoexcitation, where the Ge atoms redistribute to form a new amorphous state. Understanding the role of each atom during the phase transition of this material provides information regarding the macroscopic behaviour, which helps to design new materials and optimise the operation of devices such as 3D resistive memory arrays.
In conclusion, the FDI is a simple adaptation of transient absorption or reflection spectroscopy and is capable of extracting the spectrally dependent refractive index change and surface deformation of a sample upon photoexcitation at a fs timescale. The results obtained by applying the FDI technique discussed in this review are validated via other measurements or are supported by models, and have provided critical insights in the shape of transient absorption spectra, phase modulation and surface deformation of optoelectronic and photonic materials. Furthermore, this technique can be applied in the future to obtain information regarding the excited state real part of the refractive index of epsilon-near-zero and laser materials to predict and improve device performance. Due to the advances made in technology, signal processing and photonics, this technique has seen significant improvements in the past few years, allowing for a high phase resolution and long observable time-delays. These recent developments and possible applications demonstrate the potential for the FDI method to become a standard part of the ultrafast spectroscopy toolbox.
Acknowledgments
The authors are grateful to several collaborators for valuable discussions, particularly Justinas Butkus, Michael Price, Chih-Hsuan Lu, Pieter Geiregat, and Arjun Ashoka.
Disclosure statement
No potential conflict of interest was reported by the author(s).
Additional information
Funding
References
- Kerremans R, Kaiser C, Li W, et al. The optical constants of solution-processed semiconductors—new challenges with perovskites and non-fullerene acceptors. Adv Opt Mater. 2020;8:2000319.
- Bisschop S, Geiregat P, Aubert T, et al. The impact of core/shell sizes on the optical gain characteristics of CdSe/CdS quantum dots. ACS Nano. 2018;12:9011–34.
- Dubey RS, Saravanan S, Kalainathan S. Performance enhancement of thin film silicon solar cells based on distributed Bragg reflector & diffraction grating. AIP Adv. 2014;4:127121.
- Born M, Wolf E. Principles of optics. Seventh ed. Cambridge: Cambridge University Press; 1999.
- ElAnzeery H, El Daif O, Buffière M, et al. Refractive index extraction and thickness optimization of Cu2ZnSnSe4 thin film solar cells. Phys Status Solidi (A) Appl Mater Sci. 2015;212:1984–1990.
- Brandsrud MA, Lukacs R, Blűmel R, et al. Optimized solar cells based on changes in resonance structure as a function of the refractive index and the thickness. In: Freundlich A, Sugiyama M, Lombez L, editors. Physics, simulation, and photonic engineering of photovoltaic devices VIII. Bellingham, Washington USA: SPIE; 2019 February. p. 21.
- Salehi A, Chen Y, Fu X, et al. Manipulating refractive index in organic light-emitting diodes. ACS Appl Mater Interfaces. 2018;10:9595–9601.
- An KH, O’Connor B, Pipe KP, et al. Organic photodetector with spectral response tunable across the visible spectrum by means of internal optical microcavity. Organic Electron. 2009;10:1152–1157.
- Yang G, Wang Z, Duan Y, et al. High-Performance organic photodetectors by introducing a non-fullerene acceptor to broaden long wavelength detective spectrum. Nanoscale Res Lett. 2019;14:201.
- Tsai WS, Ting SY, Wei PK. Refractive index profiling of an optical waveguide from the determination of the effective index with measured differential fields. Opt Express. 2012;20:26766.
- Ackert JJ, Doylend JK, Logan DF, et al. Defect-mediated resonance shift of silicon-on-insulator racetrack resonators. Opt Express. 2011;19:11969.
- Lavrinenko A, Borel PI, Frandsen LH, et al. Comprehensive FDTD modelling of photonic crystal waveguide components. Opt Express. 2004;12:234.
- Schwartz BT, Piestun R. Dynamic properties of photonic crystals and their effective refractive index. J Opt Soc Am B. 2005;22:2018.
- Li H, Cui C, Xu X, et al. A review of characterization of perovskite film in solar cells by spectroscopic ellipsometry. Solar Energy. 2020;212:48–61.
- Löper P, Stuckelberger M, Niesen B, et al. Complex refractive index spectra of CH3NH3PbI3 perovskite thin films determined by spectroscopic ellipsometry and spectrophotometry. J Phys Chem Lett. 2015;6:66–71.
- Nosidlak N, Jaglarz J, Danel A. Ellipsometric studies for thin polymer layers of organic photovoltaic cells. J Vacuum Sci Technol B. 2019;37:062402.
- Chen LC, Chen JC, Chen CC, et al. Fabrication and properties of high-efficiency perovskite/PCBM organic solar cells. Nanoscale Res Lett. 2015;10:2–7.
- Bennett BR, Soref RA, Del Alamo JA. Carrier-Induced change in refractive index of InP, GaAs, and InGaAsP. IEEE J Quantum Electron. 1990;26:113–122.
- Hori T, Totani K, Hirata S, et al. Large refractive index variations induced by accumulating triplet excitons under photoexcitation at low power. Chem Phys Lett. 2018;704:5–10.
- Boyd RW. Nonlinear optics. 2nd ed. New York: Elsevier; 2003.
- Hasegawa T, Mouri SI, Yamada Y, et al. Giant photo-induced dielectricity in SrTiO3. J Phys Soc Jpn. 2003;72:41–44.
- Margerie J, Moncorgé R, Nagtegaele P. Spectroscopic investigation of variations in the refractive index of a Nd:YAG laser crystal: experiments and crystal-field calculations. Phys Rev B Condens Matter Mater Phys. 2006;74:1–11.
- Antipov OL, Bredikhin DV, Eremeykin ON, et al. Electronic mechanism for refractive index changes in intensively pumped Yb:YAG laser crystals. Opt Lett. 2006;31:763.
- Shanks K, Senthilarasu S, Mallick TK. Optics for concentrating photovoltaics: trends, limits and opportunities for materials and design. Renew Sust Energ Rev. 2016;60:394–407.
- Burkhard GF, Hoke ET, McGehee MD. Accounting for interference, scattering, and electrode absorption to make accurate internal quantum efficiency measurements in organic and other thin solar cells. Adv Mater. 2010;22:3293–3297.
- Tahara H, Aharen T, Wakamiya A, et al. Photorefractive effect in organic–inorganic hybrid perovskites and its application to optical phase shifter. Adv Opt Mater. 2018 jun;6:1701366.
- Berera R, van Grondelle R, Kennis JT. Ultrafast transient absorption spectroscopy: principles and application to photosynthetic systems. Photosynth Res. 2009;101:105–118.
- Chandrabose S, Chen K, Barker AJ, et al. High exciton diffusion coefficients in fused ring electron acceptor films. J Am Chem Soc. 2019;141:6922–6929.
- Yang Y, Yang M, Li Z, et al. Comparison of recombination dynamics in CH3NH3PbBr3 and CH3NH3PbI3 perovskite films: influence of exciton binding energy. J Phys Chem Lett. 2015;6:4688–4692.
- Price MB, Butkus J, Jellicoe TC, et al. Hot-carrier cooling and photoinduced refractive index changes in organic-inorganic lead halide perovskites. Nat Commun. 2015;6:1–8.
- Peng B, Yu G, Liu X, et al. Ultrafast charge transfer in MoS2/WSe2 p-n heterojunction. 2d Mater. 2016;3:025020.
- Chen YH, Tamming RR, Chen K, et al. Bandgap control in two-dimensional semiconductors via coherent doping of plasmonic hot electrons. Nat Commun. 2021 dec;12:4332.
- Tamming RR, Butkus J, Price MB, et al. Ultrafast spectrally resolved photoinduced complex refractive index changes in CsPbBr3 perovskites. ACS Photonics. 2019 feb;6:345–350.
- Pasanen HP, Vivo P, Canil L, et al. Refractive index change dominates the transient absorption response of metal halide perovskite thin films in the near infrared. Phys Chem Chem Phys. 2019;21:14663–14670.
- Ashoka A, Tamming RR, Girija AV, et al. Extracting quantitative dielectric properties from pump-probe spectroscopy. Nat Commun. 2022 dec;13:1437.
- Reichert M, Zhao P, Reed JM, et al. Beam deflection measurement of bound-electronic and rotational nonlinear refraction in molecular gases. Opt Express. 2015;23:22224.
- Heidecker E, Schäfer JH, Uhlenbusch J, et al. Time-resolved study of a laser-induced surface plasma by means of a beam-deflection technique. J Appl Phys. 1988;64:2291–2297.
- Zhai G, Ma C, Xiang J, et al. Mid-infrared transient reflectance study of the Dirac semimetal Cd3As2 under strong optical pumping. Phys Rev B. 2020;101:1–12.
- Bulutay C, Turgut CM, Zakhleniuk NA. Carrier-induced refractive index change and optical absorption in wurtzite InN and GaN: full-band approach. Phys Rev B. 2010 apr;81:155206.
- Tanghe I, Butkus J, Chen K, et al. Broadband optical phase modulation by colloidal CdSe quantum wells. Nano Lett. 2021;22:58–64.
- Tokunaga E, Kobayashi T, Terasaki A. Frequency-domain interferometer for femtosecond time-resolved phase spectroscopy. Opt Lett. 1992 aug;17:1131.
- Antipov OL, Kuzhelev AS, Chausov DV, et al. Dynamics of refractive-index changes in a Nd:YAG laser crystal under excitation of Nd3+ ions. J Opt Soc Am B. 1999;16:1072.
- Ye SW, Yuan F, Zou XH, et al. High-speed optical phase modulator based on graphene-silicon waveguide. IEEE J Sel Top Quantum Electron. 2017;23:76–80.
- Wang Y, Zhang F, Tang X, et al. All-Optical phosphorene phase modulator with enhanced stability under ambient conditions. Laser Photon Rev. 2018;12:1–9.
- Tokunaga E, Terasaki A, Kobayashi T. Femtosecond time-resolved dispersion relations studied with a frequency-domain interferometer. Phys Rev A. 1993;47:4581–4584.
- Sheik-Bahae M, Said A, Van Stryland E. High-sensitivity, single-beam n2 measurements. Opt Lett. 1989;14:955.
- Ferdinandus MR, Reichert M, Ensley TR, et al. Dual-arm Z-scan technique to extract dilute solute nonlinearities from solution measurements. Opt Mater Express. 2012;2:1776.
- Mendoza-Alvarez JG, Yan RH, Coldren LA. Contribution of the band-filling effect to the effective refractive-index change in double-heterostructure GaAs/AlGaAs phase modulators. J Appl Phys. 1987;62:4548–4553.
- Paskov PP, Pavlov LI. Calculation of the carrier-induced refractive index change in InSb. Appl Phys B Photophys Laser Chem. 1992;54:113–118.
- Jackson WB, Amer NM, Boccara AC, et al. Photothermal deflection spectroscopy and detection. Appl Opt. 1981;20:1333.
- Spear JD, Russo RE. Transverse photothermal beam deflection within a solid. J Appl Phys. 1991;70:580–586.
- Ferdinandus MR, Hu H, Reichert M, et al. Beam deflection measurement of time and polarization resolved nonlinear refraction. Optics InfoBase Conference Papers; Orlando, Florida United States. 2013;38:3518–3521. ISBN: 978-1-55752-987-9.
- Albrecht HS, Heist P, Kleinschmidt J, et al. Ultrafast beam-deflection method and its application for measuring the transient refractive index of materials. Appl Phys B Photophys Laser Chem. 1993;57:193–197.
- Hagan DJ, Zhao P, Benis SA, et al. Measurement of the dynamics of nonlinear refraction and absorption via nonlinear beam deflection (Conference Presentation). In: Eich M, Nunzi JM, Schuller JA, et al., editors. Light manipulating organic materials and devices IV. Vol. 10360, International Society for Optics and Photonics. SPIE; 2017. DOI:10.1117/12.2275588.
- Sarantos CH, Heebner JE. Ultrafast optical beam deflection in a GaAs planar waveguide by a transient, optically-induced prism array. Optics InfoBase Conference Papers, Newport Beach, CA, United States. 2008; 38:5–7.
- Liang L, Tian J, Wang T, et al. Ultrafast optical beam deflection in a pump probe configuration. Chin Phys B. 2016;25:0–8.
- Wolpert C, Dicken C, Atkinson P, et al. Transient reflection: a versatile technique for ultrafast spectroscopy of a single quantum dot in complex environments. Nano Lett. 2012;12:453–457. PMID: 22171984.
- Wang XD, Huang YH, Liao JF, et al. Surface passivated halide perovskite single-crystal for efficient photoelectrochemical synthesis of dimethoxydihydrofuran. Nat Commun. 2021;12:1–9.
- Visco A, Drake RP, Froula DH, et al. Temporal dispersion of a spectrometer. Rev Sci Instrum. 2008;79:10F545.
- Thorn KE, Monahan NR, Prasad SKK, et al. Efficient and tunable spectral compression using frequency-domain nonlinear optics. Opt Express. 2018;26:28140.
- Misawa K, Kobayashi T. Femtosecond Sagnac interferometer for phase spectroscopy. Opt Lett. 1995;20:1550.
- Klimov VI, McBranch DW, Klimov VI. Femtosecond high-sensitivity, chirp-free transient absorption spectroscopy using kilohertz lasers. Opt Lett. 1998;23:277.
- Megerle U, Pugliesi I, Schriever C, et al. Sub-50 fs broadband absorption spectroscopy with tunable excitation: putting the analysis of ultrafast molecular dynamics on solid ground. Appl Phys B. 2009;96:215–231.
- Tamming RR, Lin CY, Chen K, et al. Multiple-plate compression used in transient absorption spectroscopy. In: 14th Pacific Rim Conference on Lasers and Electro-Optics (CLEO PR 2020), Sydney, Australia; 2020; Optical Society of America; p. C6B4.
- Brigham EO, Morrow RE. The fast Fourier transform. IEEE Spectrum. 1967 dec;4:63–70.
- Zhong J, Zeng H. Multiscale windowed Fourier transform for phase extraction of fringe patterns. Appl Opt. 2007;46:2670–2675.
- Huang L, Kemao Q, Pan B, et al. Comparison of Fourier transform, windowed Fourier transform, and wavelet transform methods for phase extraction from a single fringe pattern in fringe projection profilometry. Opt Lasers Eng. 2010;48:141–148.
- Chandezon J, Rampnoux JM, Dilhaire S, et al. In-line femtosecond common-path interferometer in reflection mode. Opt Express. 2015 oct;23:27011.
- Geindre JP, Audebert P, Rousse A, et al. Frequency-domain interferometer for measuring the phase and amplitude of a femtosecond pulse probing a laser-produced plasma. Opt Lett. 1994;19:1997–1999.
- Blanc P, Audebert P, Falli`es F, et al. Phase dynamics of reflected probe pulses from sub-100-fs laser-produced plasmas. J Opt Soc Am B. 1996;13:118.
- Deneuville F, Chimier B, Descamps D, et al. Sub-picosecond and nanometer scale dynamics of aluminum target surface heated by ultrashort laser pulse. Appl Phys Lett. 2013;102:194104.
- Fedorov N, Beaulieu S, Belsky A, et al. Aurore: a platform for ultrafast sciences. Rev Sci Instrum. 2020;91:105104.
- Kojima A, Teshima K, Shirai Y, et al. Organometal halide perovskites as visible-light sensitizers for photovoltaic cells. J Am Chem Soc. 2009;131:6050–6051.
- Min H, Lee DY, Kim J, et al. Perovskite solar cells with atomically coherent interlayers on SnO2 electrodes. Nature. 2021;598:444–450.
- Xing G, Mathews N, Lim SS, et al. Low-temperature solution-processed wavelength tunable perovskites for lasing. Nat Mater. 2014;13:476–480.
- Stoumpos CC, Cao DH, Clark DJ, et al. Ruddlesden–Popper hybrid lead iodide perovskite 2D homologous semiconductors. Chem Mater. 2016 apr;28:2852–2867.
- Vashishtha P, Metin DZ, Cryer ME, et al. Shape-, size-, and composition-controlled thallium lead halide perovskite nanowires and nanocrystals with tunable band gaps. Chem Mater. 2018;30:2973–2982.
- Geiregat P, Maes J, Chen K, et al. Using bulk-like nanocrystals to probe intrinsic optical gain characteristics of inorganic lead halide perovskites. ACS Nano. 2018;12:10178–10188.
- Manser JS, Kamat PV. Band filling with free charge carriers in organometal halide perovskites. Nat Photonics. 2014;8:737–743.
- Niesner D, Zhu H, Miyata K, et al. Persistent energetic electrons in methylammonium lead iodide perovskite thin films. J Am Chem Soc. 2016;138:15717–15726.
- Kahmann S, Loi MA. Hot carrier solar cells and the potential of perovskites for breaking the Shockley-Queisser limit. J Mater Chem C. 2019;7:2471–2486.
- Ahmed I, Shi L, Pasanen H, et al. There is plenty of room at the top: generation of hot charge carriers and their applications in perovskite and other semiconductor-based optoelectronic devices. Light Sci Appl. 2021;10. DOI:10.1038/s41377-021-00609-3.
- Ghosh T, Aharon S, Shpatz A, et al. Reflectivity effects on pump-probe spectra of lead halide perovskites: comparing thin films versus nanocrystals. ACS Nano. 2018;12:5719–5725.
- Even J, Pedesseau L, Katan C. Analysis of multivalley and multibandgap absorption and enhancement of free carriers related to exciton screening in hybrid perovskites. J Phys Chem C. 2014;118:11566–11572.
- Wang Z, Lin Q, Wenger B, et al. High irradiance performance of metal halide perovskites for concentrator photovoltaics. Nature Energy. 2018;3:855–861.
- Yang Y, Ostrowski DP, France RM, et al. Observation of a hot-phonon bottleneck in lead-iodide perovskites. Nat Photonics. 2016;10:53–59.
- Fu J, Xu Q, Han G, et al. Hot carrier cooling mechanisms in halide perovskites. Nat Commun. 2017;8. DOI:10.1038/s41467-017-01360-3.
- Inoue D, Ichikawa T, Kawasaki A, et al. Silicon optical modulator using a low-loss phase shifter based on a multimode interference waveguide. Micromachines. 2019;10:482.
- Sturm C, Tanese D, Nguyen HS, et al. All-optical phase modulation in a cavity-polariton Mach-Zehnder interferometer. Nat Commun. 2014;5:1–7.
- Yu J, Chen R. Optical properties and applications of two-dimensional CdSe nanoplatelets. InfoMat. 2020;2:905–927.
- Mathan Kumar K, John Peter A, Lee CW. Optical absorption and refraction index change of a confined exciton in a spherical quantum dot nanostructure. Eur Phys J B. 2011;84:431–438.
- Diroll BT, Chen M, Coropceanu I, et al. Polarized near-infrared intersubband absorptions in CdSe colloidal quantum wells. Nat Commun. 2019;10. DOI:10.1038/s41467-019-12503-z.
- Martinez P, Blanchet V, Descamps D, et al. Sub-Picosecond non-equilibrium states in the amorphous phase of GeTe phase-change material thin films. Adv Mater. 2021;2102721:2102721.
- Tanimura H, Watanabe S, Ichitsubo T. Nonthermal dynamics of dielectric functions in a resonantly bonded photoexcited material. Adv Funct Mater. 2020;30:1–8.
- Behrens M, Lotnyk A, Bryja H, et al. Structural transitions in Ge2Sb2Te5 phase change memory thin films induced by nanosecond UV optical pulses. Materials. 2020 may;13:2082.
- Waldecker L, Miller TA, Rudé M, et al. Time-domain separation of optical properties from structural transitions in resonantly bonded materials. Nat Mater. 2015;14:991–995.
- Michel AKU, Sousa M, Yarema M, et al. Optical properties of amorphous and crystalline GeTe nanoparticle thin films: a phase-change material for tunable photonics. ACS Appl Nano Mater. 2020;3:4314–4320.
- Tamming RR, Lin CY, Hodgkiss JM, et al. Single 3.3 fs multiple plate compression light source in ultrafast transient absorption spectroscopy. Sci Rep. 2021;11:1–8.
- Cheng YC, Lu CH, Lin YY, et al. Supercontinuum generation in a multi-plate medium. Opt Express. 2016;24:7224.
- Lu CH, Wu WH, Kuo SH, et al. Greater than 50 times compression of 1030 nm Yb:KGW laser pulses to single-cycle duration. Opt Express. 2019;27:15638.
- Hariharan P. Basics of Interferometry. second ed. London: Elsevier Inc.; 2007.
- Bradler M, Riedle E. Temporal and spectral correlations in bulk continua and improved use in transient spectroscopy. J Opt Soc Am B. 2014;31:1465–1475.
- Dobryakov AL, Kovalenko SA, Weigel A, et al. Femtosecond pump/supercontinuum-probe spectroscopy: optimized setup and signal analysis for single-shot spectral referencing. Rev Sci Instrum. 2010;81:113106.
- Lu CH, Witting T, Husakou A, et al. Sub-4 fs laser pulses at high average power and high repetition rate from an all-solid-state setup. Opt Express. 2018;26:8941.
- Lu CH, Tsou YJ, Chen HY, et al. Generation of intense supercontinuum in condensed media. Optica. 2014;1:400.
- Ehrler B, Yanai N, Nienhaus L. Up And down-conversion in molecules and materials. J Chem Phys. 2021;154:070401.
- Yamamoto H, Tanaka S, Naito T, et al. Nonlinear change of refractive index of Co3O4 thin films induced by semiconductor laser (λ=405nm) irradiation. Appl Phys Lett. 2002;81:999–1001.
- Hlubina P, Luňaček J, Ciprian D, et al. Phase retrieval from the spectral interferograms by windowed Fourier transform. Optical Micro Nanometrol Microsys Technol II. 2008;6995:69950Z.
- Kravets VG, Wu F, Auton GH, et al. Measurements of electrically tunable refractive index of MoS2 monolayer and its usage in optical modulators. Npj 2D Mater Appl. 2019 dec;3:36.
- Grundmann M. The physics of semiconductors. 3rd ed. Graduate Texts in Physics. Cham: Springer International Publishing; 2016.
- Rangel-Rojo R, Castelo A, Flores-Arias MT, et al. Refractive index modification in glass by laser backwriting ablation of metals. Opt Express. 2006;14:8765.
- Petrovic J. Durability of the refractive index change induced by a single femtosecond laser pulse in glass. Optical Mater X. 2019;1:100004.
- Feng T, Chen G, Han H, et al. Femtosecond-laser-ablation dynamics in silicon revealed by transient reflectivity change. Micromachines. 2022;13:1–10.
- Gavrilović MR. Impact of the cavitation bubble on a plasma emission following laser ablation in liquid. Eur Phys J D. 2017;71. DOI:10.1140/epjd/e2017-80282-7
- Reshef O, De Leon I, Alam MZ, et al. Nonlinear optical effects in epsilon near-zero media. Nat Rev Mater. 2019 aug;4:535–551.
- Lee YU, Garoni E, Kita H, et al. Strong nonlinear optical response in the visible spectral range with epsilon-near-zero organic thin films. Adv Opt Mater. 2018;6:1–12.
- Zhou Y, Alam MZ, Karimi M, et al. Broadband frequency translation through time refraction in an epsilon-near-zero material. Nat Commun. 2020;11. Available from. DOI:10.1038/s41467-020-15682-2.
- Boyd RW. Physics and applications of epsilon-near-zero materials. In: OSA advanced photonics congress (AP) 2020 (IPR, NP, NOMA, Networks, PVLED, PSC, SPPCom, SOF). Optical Society of America, Nonlinear Photonics 2020, Washington, DC United States; 2020. p. NpTh2D.1. ISBN: 978-1-943580-79-8.
- Alu` A, Silveirinha MG, Salandrino A, et al. Epsilon-near-zero metamaterials and electromagnetic sources: tailoring the radiation phase pattern. Phys Review B Conden Matter Mater Phys. 2007;75:1–13.
- Fleming SC, Whitley TJ. Measurement of pump induced refractive index change in erbium doped fibre amplifier. Electron Lett. 1991;27:1959–1961.
- Kirkby PA, Goodwin AR, Thompson GH, et al. Observations of self-focusing in stripe geometry semiconductor lasers and the development of a comprehensive model of their operation. IEEE J Quantum Electron. 1977;13:705–719.
- Vcsels MR. Fundamentals, technology and applications of vertical-cavity surface-emitting lasers. Vol. 166. Springer Series in Optical Sciences. Berlin Heidelberg: Springer Berlin Heidelberg; 2013.