
Abstract
Here we present annual nearest-neighbour distances (as a proxy of density) between females with cubs-of-the-year (hereafter FCOY) and reproductive characteristics of brown bears Ursus arctos in the Cantabrian Mountains (NW Spain), from 1989 to 2017. FCOY nearest-neighbour distances and reproduction parameters of 19 focal females followed over several consecutive years (from 2004 to 2017) were obtained from bears inhabiting the western sector of the Cantabrian Mountains, where most of the bear population resides. In contrast, general reproductive characteristics were studied in the whole Cantabrian Mountains (western and eastern sectors together) on a sample of 362 litter sizes and 695 cubs. Mean nearest-neighbour distance between FCOY was 2559 ± 1222 m (range = 1305–4757 m). Mean litter size was significantly larger in the west (1.8 ± 0.2 cubs) than in the east (1.3 ± 0.6 cubs). Mean litter size for the whole of the Cantabrian Mountains was 1.6 ± 0.3 cubs. Litter sizes of one, two and three cubs represented 33.4, 56.1 and 10.5% of observed family groups, respectively. Interannual variations in litter size were not significant for both the western and the eastern areas. Mean cub mortality was 0.2 ± 0.5 cubs and did not vary among years. Cub mortality per litter size was 3.9% for one cub, 69.2% for two cubs and 26.9% for three cubs. Mean reproductive rate of the 19 focal females was 1.5 ± 0.6 cubs (n = 58 litters). Litter size of focal FCOY did not differ from the litter size obtained from systematic observations in the whole Cantabrian Mountains. During this period, cub mortality occurred in 24.1% of the 58 litters. Females usually bred every second year (average litter interval = 2.2 years). The estimated reproductive rate for the bear population was 0.7 young born/year/reproductive adult female.
Introduction
The trend of an animal population depends on the interactions between the life-history characteristics of the species (e.g. density, fecundity and survival) and local, external factors (e.g. availability of shelter, reproductive sites and food, and human density and distribution; Caughley Citation1977). Knowledge of such basic properties of a population is important for wildlife managers and has crucial implications for species conservation, and these factors may drive extinction risk (Brodie & Gibeau Citation2007).
Concepts related to brown bear Ursus arctos population dynamics and viability are increasingly of interest as bear populations have been recovering in several areas of Europe and the continental United States over the past three decades (Chapron et al. Citation2014; van Manen et al. Citation2016). Indeed, the size and frequency of litters, as well as the survival of cubs, are important parameters of population dynamics (Frkovic et al. Citation2001; Mano & Tsubota Citation2002; Ordiz et al. Citation2008; Schwartz & White Citation2008) and, thus, estimates of reproductive parameters are central to inform decisions regarding the conservation and management of brown bears (Mano & Tsubota Citation2002; Moriwaki et al. Citation2017).
Brown bear reproductive characteristics are well described for several European and North American populations (Steyaert et al. Citation2012). However, no estimates exist for the density of females with cubs-of-the-year (hereafter FCOY) for the brown bear population that inhabits the Cantabrian Mountains (NW Spain), and only a few studies concerning reproductive characteristics have been conducted in the past (Wiegand et al. Citation1998; Palomero et al. Citation2007). Because the bear population in the Cantabrian Mountains is isolated from other European bear populations and has shown a recent increase (Palomero et al. Citation2007; Pérez et al. Citation2014; Gonzalez et al. Citation2016), monitoring density and long-term reproductive characteristics is crucial, yet fecundity and mortality are the only factors that may influence current trends of this population. Thus, to gain deeper knowledge of this small and isolated bear population, we present here the annual nearest-neighbour distance (hereafter NND) of FCOY and reproductive characteristics of brown bears in the Cantabrian Mountains calculated over a 28-year period. Moreover, the long-term (> 25 years) data available for this study allows circumventing the main problem of research information obtained from small populations, which is typically limited to small sample sizes and, consequently, with subsequent management and conservation decisions based on sparse data sets.
Study area and bear population
The studied bear population inhabits the Cantabrian Mountains (), one of the main mountain range systems in Spain, stretching over 300 km across the northern part of the country, running east–west, parallel to the coast. The maximum elevation is 2648 m above sea level, and the average elevation is around 1100 m. The oceanic climate is mild and humid throughout the year (range: 900–1900 mm; Martínez Cano et al. Citation2016), favouring oak (Quercus petraea, Q. pyrenaica and Q. rotundifolia), beech (Fagus sylvatica) and chestnut (Castanea sativa) on north-facing slopes, whereas drier, south-facing slopes are mainly dominated by oak (Q. petraea and Q. pyrenaica) and beech. Subalpine matorral (Juniperus communis, Vaccinium uliginosum, V. myrtillus and Arctostaphylos uva-ursi) dominates mountain areas above the treeline (~1700 m) (Martínez Cano et al. Citation2016). In some areas, former forests have been converted into pasture and brushwood through human activities (Naves et al. Citation2003, Citation2006). The main economic activity of the region is livestock farming, followed by mining, tourism, agriculture and timber harvesting. In some areas the human population density is generally low (< 15 habitants/km2; http://ec.europa.eu/eurostat/statistics-explained/index.php/Population_grids), whereas others have experienced extensive urban and agriculture development, connected by a network of transport infrastructures (Mateo-Sánchez et al. Citation2016).
At the beginning of the 20th century, the Cantabrian population split into western and eastern subpopulations, separated by a strip of land 50–100 km wide, with bears in the two subpopulations declining in number until the mid-1990s (Gonzalez et al. Citation2016) (). Today, brown bears in the Cantabrian Mountains are showing a positive trend and the two subpopulations are reconnecting (Pérez et al. Citation2010; Gonzalez et al. Citation2016): the two subpopulations seem to be still partially separated because they might be connected by males only, but not by breeding females; yet a gap of some 80 km without breeding females between the subpopulations seems to exist. The western portion of the population represents 85% of the entire population, for which a genetic census conducted in 2006 estimated approximately 203 bears (confidence interval (CI) 95% = 168–260) in the west and 19 bears (CI 95% = 12–40) in the east (Pérez et al. Citation2014). Because the data for this study have been collected since 1989, when the two subpopulations were still separated, reproductive characteristics are also shown for both the western (1989–2017) and eastern (1989–2015) sections of the Cantabrian Mountains whenever possible.
Figure 1. Study area and the distribution of brown bears in the western and eastern sectors of the Cantabrian Mountains, NW Spain.
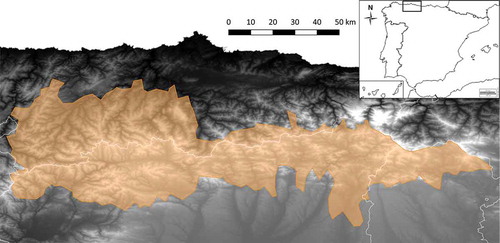
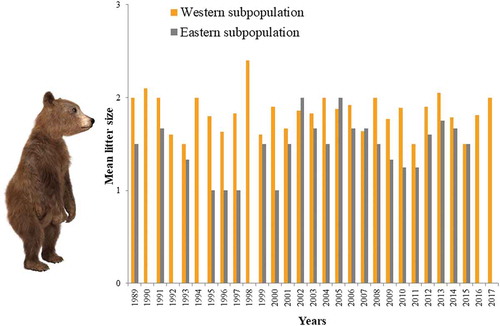
Figure 2. Interannual variations in brown bear mean litter size (number of cubs) for the western (1989–2017) and eastern (1989–2015) sectors of the Cantabrian Mountains.
Methods
Data collection
FCOY NND and reproduction parameters of 19 “focal” females followed over several consecutive years (see Estimation of reproductive parameters) were obtained from individuals inhabiting the western sector of the Cantabrian Mountains (where most of the bear population resides) only, whereas general reproductive characteristics (see Estimation of reproductive parameters) were studied in the entire mountain range. The long-term monitoring of the Cantabrian population, which started in 1989, is primarily based on sightings and the annual counting of FCOY (Palomero et al. Citation2007; Gonzalez et al. Citation2016; Penteriani et al. Citationsubmitted). The observations of FCOY were principally the result of: (1) systematic bear observations performed by personnel (mainly rangers) of (a) the Bear Team (Patrulla Oso) of the Principado de Asturias, (b) the Autonomous Communities of the administrative regions (Asturias, Castilla y Leon, Cantabria and Galicia) inhabited by brown bears, (c) the Asturian Foundation for the Conservation of Wildlife (FAPAS, Fondo para la Protección de los Animales Salvajes) and (d) the Brown Bear Foundation (FOP, Fundación Oso Pardo); and (2) personal observations of the authors. The abovementioned systematic observations, which have previously been applied successfully to the study of this bear population (Palomero et al. Citation2007; Gonzalez et al. Citation2016), indicate that most of the area potentially favourable to bears has been intensively prospected every year. Although systematic observations of FCOY were principally conducted from March to May, i.e. at the time of den emergence and when FCOY settle close to their dens (Miller Citation1990; Kovach et al. Citation2006; Penteriani et al. Citationsubmitted), they were also performed throughout the whole year (albeit at lower frequencies). In fact, hibernation in the Cantabrian Mountains may be relatively short and may predominantly coincide with snow and particularly cold days (Palomero et al. Citation2007; Nores et al. Citation2010; Penteriani et al. Citation2018a).
All the observations were done during daytime and, generally, from distances that varied from several hundreds of metres to 1–1.5 km. As in Penteriani et al. (Citationsubmitted), the different bear families were recognised on the basis of the combination of: (1) colour patterns of mothers, (2) number and characteristics (i.e. colour and distribution/shape of neck white patches) of cubs, and (3) distances between direct observations of family groups (Ordiz et al. Citation2007; Palomero et al. Citation2007). This information also allowed differentiating between families eventually observed on the same day in neighbouring areas. FCOY were videorecorded and photographed from multiple angles every year as they emerged from their dens with cubs, which allowed comparison with images of previous years to establish the mothers’ identity. Indeed, individual patterns of colours and markings do not change seasonally or even year to year, and thus can be used as the most definitive factor in the identification of individual bears (Palomero et al. Citation2007; Shimozuru et al. Citation2017). As in Shimozuru et al. (Citation2017), chest markings and colour variations were the main elements used in identifying individuals. The colour patterns of mothers also allowed estimating reproductive parameters of focal females (see Estimation of reproductive parameters). As also reported by Manchi and Swenson (Citation2005), in our study area females showed fidelity to their reproductive areas (authors’ unpublished data) such that: (1) reproductive dens occupied in successive years can be relatively close together, generally from few dozen to several hundred metres; and (2) the same dens can be used for reproduction in successive years.
Estimations of FCOY NND
For those years in which data were available, we calculated an estimator of FCOY density in the western Cantabrian Mountains, i.e. the NND between FCOY. NND represents the distance between each FCOY and its nearest neighbour’s FCOY. To calculate the NND we only considered those neighbouring FCOY for which it was possible to definitively establish that there were no other closer neighbouring FCOY. NND was calculated on the basis on the location of the first observation of each neighbouring FCOY after den emergence (i.e. April–May in the study area). The first observation after emergence generally located each FCOY in the close surroundings of the reproductive den. Indeed, immediately after den exit FCOY tend to adopt a sedentary lifestyle and have very small home ranges, presumably to minimise the risk of infanticide (Dahle & Swenson Citation2003a; Martin et al. Citation2013; Steyaert et al. Citation2013). Additionally, by correlating NND and litter size, we tested whether there were spatiotemporal reproductive patterns in FCOY, i.e. whether reproductive females living near each other may influence each other’s litter size (Ordiz et al. Citation2008).
Estimation of reproductive parameters
For the whole Cantabrian Mountains, mean litter size (i.e. mean number of cubs per litter) was determined immediately after den exit and, when possible, checked each time the same FCOY was observed from den exit to the following den entry (Wielgus & Bunnell Citation2000). However, because of the lower visibility of FCOY in our study area when families leave the surroundings of the dens (Penteriani et al. Citationsubmitted), our data do not always account for those cubs that died later in the season (Wielgus & Bunnell Citation2000; Shimozuru et al. Citation2017). It is noteworthy that the litter sizes estimated at den emergence are higher because some cubs may die in subsequent months. However, when the same female was observed with her cubs from late summer to the next den exit (i.e. with yearlings), we also calculated the “late” mean litter size (available for the western Cantabrian Mountains only), i.e. number of cubs after last FCOY observation in summer–winter of the same year or after den emergence the following year. Entire litters of cubs no longer seen near their mother during the year of den emergence were considered dead, and we inferred death of individual offspring when a litter declined in number (Garshelis et al. Citation2005). Thus, in the case of entire litter loss or reduced litter size, we also estimated cub mortality, reported as (1) mean cub mortality per female per year and (2) the percentage of cub mortality per litter size. It has been possible to detect entire litter losses when recognisable females: (1) were observed without their cubs in the months between den emergences and successive den entry; and/or (2) reproduced during two years in a row.
Additionally, 19 focal female bears were followed for two or more consecutive years during the period 2004–2017 in the western Cantabrian Mountains. As detailed above, the different females were recognised on the basis of the configuration of colour patterns after comparative analyses of pictures and videorecordings. For these focal FCOY we estimated: (1) female reproductive rates, i.e. the number of cubs that these focal FCOY produced divided by the total number of years they were monitored; (2) cub mortality per year; and (3) average interval between litters, i.e. the number of years from the production of one litter to the next. Finally, using the reproductive output of these focal FCOY, we also estimated (4) the reproductive rate for the population, dividing the mean litter size by the mean litter interval (McLellan Citation1989; Wielgus & Bunnell Citation1994, Citation2000).
Statistical analyses
The Spearman’s rank correlation coefficient was used to assess the potential relationship between FCOY NND and litter size. Analysis of Variance (ANOVA) was employed to test for interannual variations in litter size. The use of the Mann–Whitney test allowed for comparisons: (1) of mean litter size of the western vs. the eastern portions of the bear population, for the period (2004–2017) for which data were available for both portions; and (2) of the litter size recorded by systematic observations vs. the litter size of focal females. The Kruskal–Wallis test was used to compare annual variations in cub mortality in the west.
Results
FCOY NND
The NND of FCOY was calculated for four years and for a total of 16 FCOY: 2007 (n = 2 FCOY), 2013 (n = 6), 2016 (n = 5) and 2017 (n = 3). Mean NND between FCOY was 2559 ± 1222 m and NND ranged from 1305 to 4757 m. No significant correlation was detected between NND and litter size (ρ = −0.35, p = 0.25, n = 13).
Reproductive parameters: general characteristics
During the 1989–2017 period 362 litter sizes were recorded, 298 (82.3%) in the western and 64 (17.7%) in the eastern portions of the Cantabrian Mountains. Mean litter size was 1.8 ± 0.2 cubs (n = 596 cubs) in the west and 1.3 ± 0.6 cubs (n = 99 cubs) in the east, while litter size for the whole of the Cantabrian Mountains was 1.6 ± 0.3 cubs (n = 695). Mean litter size was significantly higher in the west than in the east (Z = −4.66, p = 0.0001, n = 29, 27). Interannual variations in litter size were not significant for both the western (F22,275 = 1.02, p = 0.43) and the eastern (F26,41 = 1.68, p = 0.07) areas, even though in the eastern portion of the study area interannual differences were more marked (). Litter sizes of one, two and three cubs represented 33.4% (n = 121), 56.1% (n = 203) and 10.5% (n = 38) of observed family groups, respectively.
From 1995 to 2016 we recorded 139 late litter sizes in the western sector, exhibiting values (1.7 ± 0.7 cubs; n = 234 cubs) nearly equal to the mean litter size calculated at den emergence. Late litter size revealed: (1) a mean cub mortality per female per year of 0.1 ± 0.5 cubs (which did not vary among years: χ218 = 15.96, p = 0.60); and (2) an occurrence of cub mortality per litter size of 3.9% for one cub, 69.2% for two cubs and 26.9% for three cubs. During the period 1995–2016, cub mortality occurred in 19.4% of the 139 litters.
Reproductive parameters: focal females
Within the period 2004–2017, the reproductive rates of 19 females were followed for 2 consecutive years (in one case only, a female lost her cub and reproduced successfully the year after) to 12 consecutive years (mean number of consecutive years per female = 5.2 ± 2.4 years). Mean litter size was 1.5 ± 0.6 cubs (n = 58 litters). The litter size of focal FCOY did not differ (Z = −0.09, p = 0.93, n = 234, 58) from the litter size obtained from systematic observations in the whole Cantabrian Mountains. During this period, cub mortality occurred in 24.1% of the 58 litters, and in 64.3% of the cases of littermate loss the entire litter died (in the other 35.7% of cases only one of two or three cubs died).
Females usually bred every second year (average litter interval = 2.2 years). The interval between litters (n = 33) was 2 years in most cases (81.8%), although in five cases (15.2%) a likely interval of 3 years was observed. One female seemed to show an interval of 4 years, but we cannot confidently exclude the possibility that during this time at least one attempt at reproduction occurred. On the basis of the recorded intervals between litters and the absence of yearlings near their mother starting from mid-spring (mating period) of the year following their first den exit (generally all offspring in a given litter leave at the same time; Dahle & Swenson Citation2003b), we assumed that independence from the mother occurred when almost all the littermates were ca. 1 year old (i.e. at the stage of yearlings). By excluding the uncertain litter interval of 4 years and considering the average litter interval of 2.2 years and the mean litter size of 1.5 cubs, the estimated reproductive rate for the population was 0.7 young born/year/reproductive adult female.
Discussion
Our estimates of the brown bear population in the Cantabrian Mountains suggest a population mainly characterised by: (1) locally high densities of FCOY, which do not seem to negatively affect female fecundity; and (2) larger litter sizes in the western sector, which confirm the pattern previously observed by Palomero et al. (Citation2007). It has been suggested that productivity differences between the two areas of the Cantabrian Mountains might be due to (Naves et al. Citation2003; Palomero et al. Citation2007): (1) greater genetic variability in the west and, thus, better genetic fitness; and/or (2) higher habitat quality (in terms of food diversity and availability) in the west. However, both the western and eastern sectors were characterised by low interannual variations; (3) relatively low cub mortality, which was also observed to be constant from year to year; (4) an interval between litters of 2 years in most cases; and (5) a relatively high population reproductive rate.
FCOY density seems to have increased since 2004 (Palomero et al. Citation2007), when in the western Cantabrian Mountains the nearest observations of females with three cubs were 16 km apart and females with two cubs were > 14.5 km apart, except in a few cases (e.g. 4 and 8.8 km). Although with our data set it was not possible to detect any relationship between female fecundity and density, it is important to mention here that Ordiz et al. (Citation2008) highlighted that, at short distances (< 10 km), females with cubs had a negative effect on their neighbouring female’s likelihood of having cubs of the year, arguing that reproductive suppression is probably caused by resource competition among females living close to each other. These authors proposed that the mechanism involved is a greater probability of encounter between two neighbouring estrous females, allowing one to dominate the other and suppress her estrus. More direct data (i.e. radiotracked individuals, as in Ordiz et al. Citation2008) are thus needed to confirm this pattern in the Cantabrian bear population.
Reproductive parameters vary among bear populations, and Cantabrian brown bears exhibited some of the lowest litter size values recorded throughout the distributional range of the species (Steyaert et al. Citation2012). Litter size does not seem to have changed from previous observations that ended in 2004 (Palomero et al. Citation2007). Similar values of litter size have been recorded, e.g. in Banff National Park and Kananaskis Country (Alberta: 1.8 cubs, Garshelis et al. Citation2005), the Mackenzie Mountains (Canada: 1.8 cubs, Steyaert et al. Citation2012), Banff-Kanan, (Canada: 1.8 cubs, Steyaert et al. Citation2012), Hokkaido (Japan: 1.6–1.8 cubs, Mano & Tsubota Citation2002; Shimozuru et al. Citation2017; and 1.5 cubs, Moriwaki et al. Citation2017) and the Swan Mountains (USA: 1.6 cubs, Steyaert et al. Citation2012). It is worth noting here the similarity in reproductive traits between the Cantabrian population and another small and isolated population in southern Europe, the Apennine brown bear population in Central Italy (Tosoni et al. Citation2017). Indeed, both the mean litter size (1.9 cubs in the Italian population and 1.8 in the western Cantabrian Mountains) and the observed litter sizes of one, two and three cubs were similar (26, 55 and 19%, respectively, for the Apennine brown bears; Tosoni et al. Citation2017).
However, the small litter size of Cantabrian bears is compensated by short mean litter intervals (as is typical of European and Japanese bear populations; Frkovic et al. Citation2001; Dahle & Swenson Citation2003b; Steyaert et al. Citation2012; Shimozuru et al. Citation2017), which results in a relatively high population reproductive rate (0.7) compared to bear populations from other parts of Europe, Asia and North America (Garshelis et al. Citation2005; Steyaert et al. Citation2012; Shimozuru et al. Citation2017). The estimated reproductive rate for the Cantabrian population is among the highest recorded for brown bears (i.e. from 0.23 to 0.96; reviewed by Steyaert et al. Citation2012) and is similar to the reproductive rate recorded in south-eastern British Columbia (McLellan Citation1989); in south-west Kugluktuk, Northwest Territories (Canada; Case & Buckland Citation1998); in the Selkirk Mountains Grizzly Bear Ecosystem (northern Idaho, north-eastern Washington and southern British Columbia; Wielgus & Bunnell Citation2000); and in Hokkaido (Shimozuru et al. Citation2017). A shorter interval between litters and a relatively high reproductive rate might be due to the high habitat quality of the Cantabrian Mountains (Martínez Cano et al. Citation2016), as also suggested by Shimozuru et al. (Citation2017) for the Hokkaido region.
Intervals between litters seem to be more important than litter size in influencing the long-term reproductive rate in brown bear populations (Dahle & Swenson Citation2003b). Dahle and Swenson (Citation2003b) suggested that bear offspring are reported to be weaned as yearlings in southern European populations because yearlings are heavier in southern than in northern Europe. Indeed, mean litter size has been correlated with female body weight and latitude, i.e. heavier bears at higher latitudes tend to have larger litters (Shimozuru et al. Citation2017). The Cantabrian brown bear population is at the southern limit of the species’ distributional range and the body weight of adult females is relatively low, which supports the above theory. Reproductive parameters such as litter size and reproductive interval, which can vary annually and according to geographic location, can also be influenced by local food availability (particularly autumnal food influencing maternal condition during the pre-hibernation period), individual condition and climate (Moriwaki et al. Citation2017). However, determining mean interval between litters for a brown bear population should be approached cautiously, especially for small sample sizes, considering annual fluctuations in pregnancy rate (Mano & Tsubota Citation2002); long-term observation of individuals using radiotracking techniques would provide more rigorous estimates of the reproductive history of females. As an end result, our study yielded an especially noteworthy implication for this bear population, i.e. if human-induced mortality (which seemed to have been the main cause of the decline of the species in the 1990s; Wiegand et al. Citation1998; Naves et al. Citation2003; Palomero et al. Citation2007; Martínez Cano et al. Citation2016) continues to be restricted to very few cases, the potential for population growth seems quite high and encouraging for the future of this population. Thus, although this population is small and still vulnerable to the impacts of varying human activities and behaviours, it appears that efforts designed to preserve the Cantabrian brown bear are working.
Litter size proportions, with two cubs being the most common family group, are similar to those recorded by Mace et al. (Citation1998, Citation2012), Dahle and Swenson (Citation2003b), Miller et al. (Citation2003), Schwartz et al. (Citation2006) and Shimozuru et al. (Citation2017), and have not changed during the last 13 years (Palomero et al. Citation2007). Mean cub mortality per female per year (0.2 cubs) is similar to the annual cub loss (0.4) recorded in central Sweden–south-eastern Norway by Swenson et al. (Citation2001).
Similar to the observations of Frkovic et al. (Citation2001) and Zedrosser and Swenson (Citation2005), when comparing seasonal differences in litter size we did not find significant differences between spring and autumn litter size in the western sector of the Cantabrian Mountains. This means that when cub mortality after den emergence is not high (as seems to be the case in the bear population of the Cantabrian Mountains), observations of FCOY in early spring (i.e. immediately after den exit) may provide reliable information on reproductive output. Similarly, the percentage (19.4%) of littermate loss recorded by systematic observations in the west was similar to the percentage of mortality events (24.1%) recorded from focal females in the same area.
The results obtained by our systematic observations demonstrate the importance of continued investment in this monitoring program, which can provide managers with the necessary information to properly evaluate both the trajectory of this bear population and previous habitat management actions (e.g. http://www.fundacionosopardo.org/index.php/proyectos/proyectos-life/proyecto-life-desfragmentacion-oso/and http://www.fundacionosopardo.org/index.php/proyectos/proyectos-life/proyecto-life-corredores-oso/), as well as to possibly assess the impacts of environmental change (e.g. climate change). However, because basic demographic information based on genetic studies and systematic observations is relatively well known for the Cantabrian brown bear population (Palomero et al. Citation2011, Citation2007; Gonzalez et al. Citation2016; this study), we consider that it is now necessary to also include more individual-based research that includes the use of radiotracking in the Cantabrian Mountains. Indeed, beyond the fact that radiotracking allows acquiring crucial information, such as bear rhythms of activity, dispersal and home range behaviour, the maintenance of radiocollared bears in bear recovery areas is a primary means of detecting and monitoring human-caused mortality (which has been the most important cause of bear population decrease in the Cantabrian Mountains; Wiegand et al. Citation1998; Palomero et al. Citation2007; Pérez et al. Citation2014; Gonzalez et al. Citation2016; Martínez Cano et al. Citation2016), and may provide a deterrent to poaching, a warning system allowing for early detection of population decrease, and a means of increasing the effectiveness of monitoring programs (Wakkinen & Kasworm Citation2004; Schwartz et al. Citation2006; Harris et al. Citation2007).
The future of brown bears in the Cantabrian Mountains will also be dependent on a joint effort and management, independent of which governmental organisation (i.e. Autonomous Regions) has primary jurisdiction at a local scale. Specific regulations and agency responsibilities may change, but bears will require trans-regional adaptive management efforts (Schwartz et al. Citation2006). Since the Cantabrian bear population extends across several regions, continuous efforts are required to increase trans-regional coordination in conservation and management policies (Penteriani et al. Citation2018b). Although conservation efforts have helped to some extent in bringing about the current increasing population trend, management issues still arise: periodic revisions of the bear recovery plan by Autonomous Regions will provide a great opportunity to review conservation achievements, failures and needs, and set joint plans for the conservation of this brown bear population shared by four administrative units.
Acknowledgements
We thank all the personnel (mainly the Patrulla Oso/‘Bear Team’ people) from the environmental agencies of Galicia, Asturias, Castilla y Leon and Cantabria, as well as people of FAPAS (especially Alfonso Hartasanchez and Monchu Magadán Ruitiña), FOP and FOA (Fundación Oso de Asturias) who, during the last 20 years, have been working on the survey of the brown bear in the Cantabrian Mountains. We thank the administrations of the Gobierno del Principado de Asturias, Junta de Castilla y León, Gobierno de Cantabria and Xunta de Galicia for providing their database on brown bear data. During this study, VP was financially supported by the Excellence Project CGL2017-82782-P financed by the Spanish Ministry of Economy, Industry and Competitiveness (MINECO), the Agencia Estatal de Investigación (AEI) and the Fondo Europeo de Desarrollo Regional (FEDER, EU). The suggestions of one anonymous referee helped to improve the first draft of the manuscript.
Disclosure statement
No potential conflict of interest was reported by the authors.
Additional information
Funding
References
- Brodie JF, Gibeau ML. 2007. Brown bear population trends from demographic and monitoring based estimators. Ursus 18:137–144. DOI:10.2192/1537-6176(2007)18[137:BBPTFD]2.0.CO;2.
- Case RL, Buckland L. 1998. Reproductive characteristics of Grizzly Bears in the Kugluktuk area, Northwest Territories, Canada. Ursus 10:41–47.
- Caughley G. 1977. Analysis of vertebrate populations. New York, USA: John Wiley and Sons.
- Chapron G, Kaczensky P, Linnell JDC, von Arx M, Huber D, Andren H, J V L-B, Adamec M, Alvares F, Anders O, Balčiauskas L, Balys V, Bed P, Bego F, Blanco JC, Breitenmoser U, Broseth H, Bufka L, Bunikyte R, Ciucci P, Dutsov A, Engleder T, Fuxjager C, Groff C, Holmala K, Hoxha B, Iliopoulos Y, Ionescu O, Jeremi J, Jerina K, Kluth G, Knauer F, Kojola I, Kos I, Krofel M, Kubala J, Kunovac S, Kusak J, Kutal M, Liberg O, Maji A, Mannil P, Manz R, Marboutin E, Marucco F, Melovski D, Mersini K, Mertzanis Y, Mysłajek RW, Nowak S, Odden J, Ozolins J, Palomero G, Paunovi M, Persson J, Potočnik H, Quenette P-Y, Rauer G, Reinhardt I, Rigg R, Ryser A, Salvatori V, Skrbinšek T, Stojanov A, Swenson JE, Szemethy L, Trajce A, Tsingarska-Sedefcheva E, Váňa M, Veeroja R, Wabakken P, Wolfl M, Wolfl S, Zimmermann F, Zlatanova D, Boitani L. 2014. Recovery of large carnivores in Europe’s modern human-dominated landscapes. Science 346:1517–1519. DOI:10.1126/science.1255826.
- Dahle B, Swenson JE. 2003a. Seasonal range size in relation to reproductive strategies in brown bears Ursus arctos. Journal of Animal Ecology 72:660–667. DOI:10.1046/j.1365-2656.2003.00737.x.
- Dahle B, Swenson JE. 2003b. Factors influencing length of maternal care in brown bears (Ursus arctos) and its effect on offspring. Behavioral Ecology and Sociobiology 54:352–358. DOI:10.1007/s00265-003-0638-8.
- Frkovic A, Huber D, Kusak J. 2001. Brown bear litter sizes in Croatia. Ursus 12:103–105.
- Garshelis DL, Gibeau ML, Herrero S. 2005. Grizzly bear demographics in and around Banff National Park and Kananaskis Country, Alberta. Journal of Wildlife Management 69:277–297. DOI:10.2193/0022-541X(2005)069<0277:GBDIAA>2.0.CO;2.
- Gonzalez EG, Blanco JC, Ballesteros F, Alcaraz L, Palomero G, Doadrio I. 2016. Genetic and demographic recovery of an isolated population of brown bear Ursus arctos L., 1758. Peer Journal 4:e1928. DOI:10.7717/peerj.1928.
- Harris RB, White GC, Schwartz CC, Haroldson MA. 2007. Population growth of yellowstone grizzly bears: Uncertainty and future monitoring. Ursus 18:168–178. DOI:10.2192/1537-6176(2007)18[168:PGOYGB]2.0.CO;2.
- Kovach SD, Collins GH, Hinkes MT, Denton JW. 2006. Reproduction and survival of brown bears in southwest Alaska, USA Reproduction and survival of brown bears in southwest Alaska, USA. Ursus 17:16–29. DOI:10.2192/1537-6176(2006)17[16:RASOBB]2.0.CO;2.
- Mace RD, Carney DW, Chilton-Radandt T, Courville SA, Haroldson MA, Harris RB, Jonkel J, McLellan B, Madel M, Manley TL, Schwartz CC, Servheen C, Stenhouse G, Waller JS, Wenum E. 2012. Grizzly bear population vital rates and trend in the Northern Continental divide ecosystem, Montana. Journal of Wildlife Management 76:119–128. DOI:10.1002/jwmg.250.
- Mace RD, Waller JS, Mace RD, Waller JS. 1998. Demography and population trend of grizzly bears in the Swan Mountains, Montana. Conservation Biology 12:1005–1016. DOI:10.1046/j.1523-1739.1998.97031.x.
- Manchi S, Swenson JE. 2005. Denning behaviour of Scandinavian brown bears Ursus arctos. Wildlife Biology 11:123–132. DOI:10.2981/0909-6396(2005)11[123:DBO-SBB]2.0.CO;2.
- Mano T, Tsubota T. 2002. Reproductive characteristics of brown bears on the Oshima Peninsula, Hokkaido, Japan. Journal of Mammalogy 83:1026–1034. DOI:10.1644/1545-1542(2002)083<1026:RCOBBO>2.0.CO;2.
- Martin J, van Moorter B, Revilla E, Blanchard P, Dray S, Quenette PY, Allainé D, Swenson JE. 2013. Reciprocal modulation of internal and external factors determines individual movements. Journal of Animal Ecology 82:290–300. DOI:10.1111/j.1365-2656.2012.02038.x.
- Martínez Cano I, González Taboada F, Naves J, Fernández-Gil A, Wiegand T 2016. Decline and recovery of a large carnivore: Environmental change and long-term trends in an endangered brown bear population. Proceedings of the Royal Society of London. Series B 283:20161832. DOI:10.1098/rspb.2016.0343.
- Mateo-Sánchez MC, Gastón A, Ciudad C, García-Vías JI, Cuevas J, López-Leiva C, Fernández-Landa A, Algeet-Abarquero N, Marchamalo M, Fortin MJ, Saura S. 2016. Seasonal and temporal changes in species use of the landscape: How do they impact the inferences from multi-scale habitat modeling? Landscape Ecology 31:1261–1276. DOI:10.1007/s10980-015-0324-z.
- McLellan B. 1989. Dynamics of a grizzly bear population during a period of industrial resource extraction. III. Natality and rate of increase. Canadian Journal of Zoology 67:1865–1868. DOI:10.1139/z89-266.
- Miller SD 1990. Denning ecology of brown bears in Southcentral Alaska and comparisons with a sympatric black bear population. Bears: Their biology and management. Vol. 8. A Selection of Papers from the Eighth International Conference on Bear Research and Management, Victoria, British Columbia, Canada, \pp. 279–287. DOI:10.1099/00221287-136-2-327.
- Miller SD, Sellers RA, Keay JA, Miller SD, Sellers RA, Keay JA. 2003. Effects of hunting on brown bear cub survival and litter size in Alaska. Ursus 14:130–152.
- Moriwaki J, Shimozuru M, Tsuruga H, Mano T, Tsubota T. 2017. Estimation of reproductive parameters and their annual variation in brown bears of Hokkaido, Japan. Ursus 27:99–109. DOI:10.2192/URSU-D-16-00005.1.
- Naves J, Fernández-Gil A, Rodríguez C, Delibes M. 2006. Brown bear food habits at the border of its range: A long-term study. Journal of Mammalogy 87:899–908. DOI:10.1644/05-MAMM-A-318R2.1.
- Naves J, Wiegand T, Revilla E, Delibes M. 2003. Endangered species constrained by natural and human factors: The case of brown bears in northern Spain. Conservation Biology 17:1276–1289. DOI:10.1046/j.1523-1739.2003.02144.x.
- Nores C, Ballesteros F, Blanco J, García-Serrano A, Herrero J, Palomero G. 2010. Evidence of non-hibernation in Cantabrian brown bears. Acta Theriologica (Warsz) 55:203–209. DOI:10.4098/j.at.0001-7051.085.2008.
- Ordiz A, Rodríguez C, Naves J, Fernández A, Huber D, Kaczensky P, Mertens A, Mertzanis G, Mustoni A, Palazón S, Quenette PY, Rauer G, Swenson JE. 2007. Distance-based criteria to identify minimum number of brown bear females with cubs in Europe. Ursus 18:158–167. DOI:10.2192/1537-6176(2007)18[158:DCTIMN]2.0.CO;2.
- Ordiz A, Støen OG, Swenson JE, Kojola I, Bischof R. 2008. Distance-dependent effect of the nearest neighbor: Spatiotemporal patterns in brown bear reproduction. Ecology 89:3327–3335. DOI:10.1890/07-1921.1.
- Palomero G, Ballesteros F, Blanco JC, García-Serrano A, Herrero J, Nores C. 2011. Osas. El comportamiento de las osas y sus crías en la Cordillera Cantábrica. Madrid: Fundación Oso Pardo, Fundación Biodiversidad.
- Palomero G, Ballesteros F, Nores C, Blanco JC, Herrero J, García-Serrano A. 2007. Trends in number and distribution of brown bear females with cubs-of-the-year in the Cantabrian Mountains, Spain. Ursus 18:145–157. DOI:10.2192/1537-6176(2007)18[145:TINADO]2.0.CO;2.
- Penteriani V, Delgado MM, López-Bao JV, Vázquez García P, Monrós JS, Vigón Álvarez E, Sánchez Corominas T, Vázquez V. 2018a. Patterns of movement of three rescued and released female brown bears in the Cantabrian Mountains, northwest Spain. Ursus 28:165–170. DOI:10.2192/URSU-D-16-00012.1.
- Penteriani V, Huber D, Jerina K, Krofel M, López-Bao J-V, Ordiz A, Zarzo-Arias A, Dalerum F. 2018b. Trans-boundary and trans-regional management of a large carnivore: Managing brown bears across national and regional borders in Europe. In: Hovardas T, editor. Large carnivore conservation and management: human dimensions and governance. Oxford: Routledge, Taylor & Francis Group.
- Penteriani V, Zarzo-Arias A, Delgado MM, Dalerum F, Gurarie E, Peón Torre P, Sánchez Corominas T, Vázquez V, Vázquez García P, Ordiz A (submitted). May brown bear females with cubs settle in areas at risk of infanticide in spatially confined populations? The case of the Cantabrian Mountains, Spain.
- Pérez T, Naves J, Vázquez J, Seijas J, Corao A, Albornoz J, Domínguez A. 2010. Evidence for improved connectivity between Cantabrian brown bear subpopulations. Ursus 21:104–108. DOI:10.2192/09SC018.1.
- Pérez T, Naves J, Vázquez JF, Fernández-Gil A, Seijas J, Albornoz J, Revilla E, Delibes M, Domínguez A. 2014. Estimating the population size of the endangered Cantabrian brown bear through genetic sampling. Wildlife Biology 20:300–309. DOI:10.2981/wlb.00069.
- Schwartz C, Haroldson M, White G, Harris R, Cherry S, Keating K, Moody D, Servheen C. 2006. Temporal, spatial, and environmental influences on the demographics of grizzly bears in the greater yellowstone ecosystem. Wildlife Monographs 161:1–68. DOI:10.2193/0084-0173(2006)161[1:TSAEIO]2.0.CO;2.
- Schwartz CC, White GC. 2008. Estimating reproductive rates for female bears: Proportions versus transition probabilities. Ursus 19:1–12. DOI:10.2192/07GR003R.1.
- Shimozuru M, Yamanaka M, Nakanishi M, Moriwaki J, Mori F, Tsujino M, Shirane Y, Ishinazaka T, Kasai S, Nose T, Masuda Y, Tsubota T. 2017. Reproductive parameters and cub survival of brown bears in the Rusha area of the Shiretoko Peninsula, Hokkaido, Japan. PLoS One 12:e0176251. DOI:10.1371/journal.pone.0176251.
- Steyaert SMJG, Endrestøl A, Hackländer K, Swenson JE, Zedrosser A. 2012. The mating system of the brown bear Ursus arctos. Mammal Review 42:12–34. DOI:10.1111/j.1365-2907.2011.00184.x.
- Steyaert SMJG, Reusch C, Brunberg S, Swenson JE, Hackländer K, Zedrosser A. 2013. Infanticide as a male reproductive strategy has a nutritive risk effect in brown bears. Biology Letters 9:20130624. DOI:10.1098/rsbl.2013.0624.
- Swenson JE, Brunberg S, Segerström P. 2001. Factors associated with loss of brown bear cubs in Sweden. Ursus 12:69–80.
- Tosoni E, Boitani L, Gentile L, Gervasi V, Latini R, Ciucci P. 2017. Assessment of key reproductive traits in the Apennine brown bear population. Ursus 28:105–116. DOI:10.2192/URSU-D-16-00025.1.
- van Manen FT, Haroldson MA, Bjornlie DD, Ebinger MR, Thompson DJ, Costello CM, White GC. 2016. Density dependence, whitebark pine, and vital rates of grizzly bears. Journal of Wildlife Management 80:300–313. DOI:10.1002/jwmg.1005.
- Wakkinen WL, Kasworm WF. 2004. Demographics and population trends of grizzly bears in the Cabinet–Yaak and Selkirk Ecosystems of British Columbia, Idaho, Montana, and Washington. Ursus 15:65–75. DOI:10.2192/1537-6176(2004)015<0065:DAPTOG>2.0.CO;2.
- Wiegand T, Naves J, Stephan T, Fernandez A. 1998. Assessing the risk of extinction for the brown bear (Ursus arctos) in the Cordillera Cantabrica, Spain. Ecological Monographs 68:539–570. DOI:10.1890/0012-9615(1998)068[0539:ATROEF]2.0.CO;2.
- Wielgus RB, Bunnell FL. 1994. Dynamics of a small, hunted brown bear Ursus arctos population in Southwestern Alberta, Canada. Biological Conservation 67:161–166. DOI:10.1016/0006-3207(94)90362-X.
- Wielgus RB, Bunnell FL. 2000. Possible negative effects of adult male mortality on female grizzly bear reproduction. Biological Conservation 93:145–154. DOI:10.1016/S0006-3207(99)00152-4.
- Zedrosser A, Swenson JE. 2005. Do brown bear litter sizes reported by the public reflect litter sizes obtained by scientific methods? Wildlife Society Bulletin 33:1352–1356. DOI:10.2193/0091-7648(2005)33[1352:DBBLSR]2.0.CO;2.