
ABSTRACT
Sequences of phonologically similar words are more difficult to remember than phonologically distinct sequences. This study investigated whether this difficulty arises in the acoustic similarity of auditory stimuli or in the corresponding phonological labels in memory. Participants reconstructed sequences of words which were degraded with a vocoder. We manipulated the phonological similarity of response options across two groups. One group was trained to map stimulus words onto phonologically similar response labels which matched the recorded word; the other group was trained to map words onto a set of plausible responses which were mismatched from the original recordings but were selected to have less phonological overlap. Participants trained on the matched responses were able to learn responses with less training and recall sequences more accurately than participants trained on the mismatched responses, even though the mismatched responses were more phonologically distinct from one another and participants were unaware of the mismatch. The relative difficulty of recalling items in the correct position was the same across both sets of response labels. Mismatched responses impaired recall accuracy across all positions except the final item in each list. These results are consistent with the idea that increased difficulty of mapping acoustic stimuli onto phonological forms impairs serial recall. Increased mapping difficulty could impair retention of memoranda and impede consolidation into phonological forms, which would impair recall in adverse listening conditions.
Introduction
The difficulty of recalling a sequence of words depends, in part, on the lexical properties of those words. One lexical property that affects recall is the phonological contents of word sequences. Phonologically similar sequences of words (e.g. “man mat pan rat ran bat”) are harder to recall in order than phonologically distinct sequences of words (e.g. “clock kite spoon bus fish door”) – a phenomenon known as the phonological similarity effect (Baddeley, Citation1968). As the name implies, experiments that test this effect often characterize stimuli in terms of their phonological representation rather than their acoustic content. This characterization is sensible, as phonological similarity effects occur for visually presented stimuli (e.g. letters, written words, pictures) which contain no acoustic input (Conrad, Citation1979; Conrad & Hull, Citation1964). Thus, regardless of presentation modality, items are often mapped to a phonological form for storage within short-term and working memory.
Effects of Phonological Similarity on List Recall
If the phonological similarity effect occurs solely at the phonological/lexical level, then the acoustic inputs that map onto those words should not matter so long as they are interpreted as speech. To test this prediction, we manipulated the response labels for degraded spoken words. This differs from previous work, which typically manipulates the acoustic stimuli rather than the response labels associated with stimuli (e.g. Baddeley, Citation1968). We recorded and vocoded closed sets of similar and distinct words. The vocoded recordings were hard to understand – to the point of being ambiguous. One group of participants was trained to map the degraded acoustic stimuli of the phonologically similar set to labels which were plausible but mismatched from the original words (e.g. the vocoded spoken recording of the word “man” was mapped to the text label “noun”) to make the labels less phonologically similar to one another. Another group of participants was trained to map the degraded acoustic stimuli of the phonologically similar set to matched word labels (e.g. the vocoded spoken recording of the word “man” was mapped to the text label “man”). If phonological similarity occurs solely at the level of encoding and/or storage, then we would see an improvement in recall in the group who recalled the mismatched labels. If phonological similarity arises from similarities between the acoustic features of the input, we would see no difference in recall across groups.
To foreshadow our results, we found a third trend: recall of mismatched labels was poorer than recall of matched labels. This outcome was not consistent with our predicted hypotheses (see the preregistered predictions and planned analyses at https://osf.io/qgfa2/registrations), so we conducted further analysis to examine another hypothesis. The hypothesis we subsequently developed was that the strength of activation of word labels in response to acoustic input determined the difficulty of serial recall. Generally, working memory has been characterized as the ability to create and maintain links between arbitrary sets of information (Wilhelm, Hildebrandt, & Oberauer, Citation2013). Creating arbitrary links is a good description of our task because participants were trained to map highly ambiguous, vocoded spoken words to given response labels. From this perspective, the strength of the link between vocoded spoken words and mismatched labels could explain the observed results. When identifying words, acoustic speech cues activate a neighborhood of phonological representations clustered around the correct interpretation (Luce & Pisoni, Citation1998). Degraded auditory input contains fewer speech cues, so activation will be more diffuse and weaker. Because mismatched labels were selected to be plausible (see methods below) they fell within the neighborhood of activated words, but likely had weaker activation than the matched labels. Changes in activation strength would have distinct effects on word identification and serial recall.
Effects of Activation Strength on Word Identification
If mismatched labels are more weakly activated than matched labels, then their mapping would be more difficult to learn as evidenced by slower and less accurate word identification. Prior to completing the serial recall portion of this experiment, all participants were trained and tested until they could accurately map every vocoded word to its assigned response label. This enabled us to examine the amount of training required to learn the mappings and the speed with which words were labeled. After the serial recall portion of the study, we again tested labeling of vocoded words one at a time to ensure participants retained the trained mappings throughout the experiment, which allows us to further compare labeling accuracy. These comparisons verified that mismatched labels were indeed more difficult to learn and were less accurately identified than matched labels.
Effects of Activation Strength on Serial Recall
Changes in activation strength would also have downstream effects on serial recall accuracy. The added demand of activating a weak link between vocoded recordings and response labels would disrupt maintenance of words presented earlier in the list. Similar disruptions have been previously demonstrated with spoken word lists presented in a mix of quiet and noise; when words are presented in noise the preceding items are recalled with diminished accuracy, even if those preceding items were presented in quiet (Piquado, Cousins, Wingfield, & Miller, Citation2010; Rabbitt, Citation1968). As a result, only words in terminal positions would be unaffected by this disruption. Individuals are also slower to select a response (i.e. look atcorresponding target images) when listening to degraded speech cues (Farris-Trimble, McMurray, Cigrand, & Tomblin, Citation2014), which indicates that listeners wait to begin lexical access until more of the acoustic signal has been heard (McMurray, Farris-Trimble, & Rigler, Citation2017). In the current study, such a “wait-and-see” approach would lead to vocoded words early in the list being partially overwritten in the sensory store before participants had converted them to a response label. Only list-final items can be retrieved directly from the auditory sensory store without being overwritten by subsequent items. Both explanations – disrupting maintenance and overwriting the acoustic store – would predict that recall of mismatched labels should be less accurate at earlier positions in a list than for matched labels, but there should be little difference in recall accuracy for the last position in a list. To test this prediction, we analyzed recall accuracy across serial positions.
In addition to disrupting memory for individual words as described above, weak activation would also disrupt maintenance of word order. Competitive queuing models of serial recall (see Hurlstone, Hitch, & Baddeley, Citation2014 for review) posit an activation gradient across items in memory, wherein items are stored with activation strength corresponding to output order (e.g. the first item is activated most strongly, the last item is activated most weakly). If activation is weakened for mismatched labels then the relative strengths of activation would all be closer in magnitude. This would lead to an increased chance of swapping the order of activation strengths across items due to noise. Swapping activation orders would produce a corresponding decline in recall order accuracy relative to matched labels, in addition to the decline in item identification described above. To test this prediction, we analyzed recall accuracy for total number of words correctly recalled in any order and the proportion of those words that were recalled in the correct order. Overall, we found that these analyses support the hypothesis that mapping degraded speech to mismatched words diminishes the strength of activation of those words.
Materials and Methods
We tested the ability of young adults with normal hearing to recall sequences of spoken vocoded words that varied in their phonological similarity to one another (within-participant) and in the orthographic label assigned to each item (between-participant).
Participants
A total of 86 normal-hearing adults were initially recruited to participate in this study. To be included in the study, participants needed to be a native speaker of English between the ages of 19 and 29 years, have normal or corrected-to-normal vision, have normal hearing, be free of any developmental or neurocognitive diagnoses, and report no recent use of medication that could impair cognitive ability. Three participants who completed the study were later discovered to not meet the inclusionary criteria – one was outside of the age range and two reported language disorder diagnoses. Two participants reported normal hearing but failed a hearing screening conducted by lab staff, so they did not continue with the study. All participants passed a vision screening also conducted by lab staff. Testing continued if the participant had at least 20/32 vision in at least one eye and also passed the hearing screen for at least 11 of 12 frequencies (octave intervals between 0.5 and 8 kHz at 20 dB HL in each ear). An additional participant was excluded for failing to learn the word list mappings within 10 proficiency checks. Thus, the final sample included 80 participants (51 were female; mean age of 25.2; SD = 2.7). This study was approved by the Boys Town National Research Hospital Institutional Review Board. The entire session took less than one hour, and all participants were compensated 15 USD for their participation.
Experimental Design
The goal of this experiment was to determine if reducing phonological similarity between response words improves serial recall accuracy. To achieve this goal, participants were split into two groups. One group was trained to map phonologically similar vocoded spoken words onto matched orthographic labels. The other group was trained to map those same vocoded spoken words onto mismatched orthographic labels that had less phonological similarity than the spoken words. Comparing serial recall across matched and mismatched labels required comparison across two groups, as we could not train participants on two different sets of response labels for the same vocoded spoken words without interference from the first training influencing the second training.
All participants were also trained to map phonologically distinct vocoded spoken words onto matched orthographic labels. This enabled cross-group comparison to ensure that both groups had matched serial recall ability. Individual differences in serial recall performance are consistent across different types of vocoded stimuli (Bosen & Luckasen, Citation2019), so if both groups had matched recall performance for distinct words it would ensure that any differences across matched and mismatched labels arose from the label manipulation, not cross-group differences in serial recall ability. Including phonologically distinct words also allowed us to confirm that the phonological similarity effect occurs with vocoded stimuli.
We only manipulated response labels for the similar words because this was the only condition that would yield meaningful interpretation. For the similar words, we were able to select mismatched labels that were less phonologically similar to one another, which would yield an improvement in serial recall performance if the phonological similarity of responses was the locus of the phonological similarity effect. The distinct words are already phonologically distinct from one another, so mismatched labels would either retain that distinctiveness or reduce it. Retaining distinctiveness with mismatched labels would have allowed us to further examine the effect of mismatched labels on recall accuracy, although this effect was not part of our predicted hypothesis and so this manipulation was not tested in this experiment. Reduced distinctiveness (i.e. increased similarity) would reduce serial recall performance, although it would not be evident whether this reduction was caused by increased phonological similarity or added difficulty from mismatched labels, so this manipulation was also not tested.
Stimuli and Listening Conditions
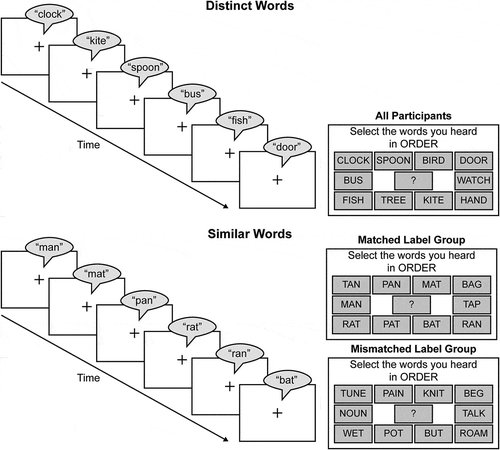
Participants heard sequences of vocoded words spoken by a female native speaker of American English. Participants reconstructed the sequence by clicking on corresponding orthographic representations on a computer screen using a computer mouse, as depicted in . Words were grouped into acoustically similar and acoustically dissimilar sets, with ten words in each set (). These word sets are commonly used in examinations of the phonological similarity effect (e.g. Jarrold, Cocksey, & Dockerill, Citation2008), so their use here facilitates comparison of our results to previous work.
Table 1. Guessed vocoded target word identity. Vocoded words were played for seven listeners and listeners gave as many guesses as they wanted as to the identity of the word. Each row lists the guesses for one target word, with the number of individuals who gave that guess shown in parentheses
Table 2. Participants recalled sequences of verbally presented target words by clicking on the corresponding orthographic label. All participants recalled words from the acoustically distinct set and were assigned to one of two conditions for the acoustically similar set: the matched, phonologically overlapping orthographies or mismatched, phonologically distinct orthographies. Phonological distinctiveness of response labels is summarized as the mean phonological edit distance (PED) from each label to the other labels within its set
Figure 1. Serial recall task. Participants heard sequences of six vocoded words that were difficult to understand and then selected the corresponding trained word labels in the order in which they were heard. All participants were trained on the same set of labels for distinct words. Half of the participants were trained with labels that matched the vocoded word (matched label group) and half of the participants were trained with labels that were plausible but did not match the vocoded word (mismatched label group)
Stimulus Recordings and Vocoding
To facilitate the response label manipulation described below, words were degraded with a four channel sine vocoder which made them difficult to identify (Friesen, Shannon, Baskent, & Wang, Citation2001). Words were filtered into four adjacent frequency bands, with edge frequencies of 100 Hz, 475 Hz, 1425 Hz, 3828 Hz, and 10 kHz (these frequencies are equally spaced on the Greenwood scale, Greenwood, Citation1990). The envelope of each frequency band was obtained via the Hilbert transform and then low pass filtered at a cutoff frequency of 300 Hz. The filtered envelope of each band was multiplied with a pure tone carrier with frequency at the geometric mean of the band edges, and the modulated carriers were summed to produce the vocoded stimulus. The stimuli used in this experiment can be found in the OSF project associated with this manuscript (https://osf.io/qgfa2/files).
Creating the Mismatched Labels
The acoustically similar word set was further divided by the orthographic label assigned to each word. Half of the participants were given orthographic labels which matched the target word; the other half of participants were given orthographic labels which were judged to be plausible for each target but were mismatched from the target word to make the set of response labels more phonologically distinct from one another. These judgments were made by playing the vocoded words to seven naïve listeners with normal hearing. Listeners were asked to guess what word they were hearing and were free to provide as many guesses per word as they wanted. A full list of these guesses for both word sets is provided in . More participants correctly guessed the identity of the acoustically distinct words than the acoustically similar words (x̄ = 4 for the distinct words, x̄ = 2.2 for similar words), although there was little consensus on the true identity of most of the words. The correct identity of every distinct word was guessed by at least one participant, whereas two similar words (“pat” and “ran”) were not correctly guessed by any participants.
The guesses for the acoustically similar words were used to generate plausible mismatched labels for these words. In order to generate plausible options, we retained only guesses that were CVC words, as defined by the database in (Cowan, Citation1986). We also eliminated guesses which matched any of the target words (e.g. “bird” was guessed for “bag”) or proper nouns (e.g. “Karen” was guessed for “pan”). From the remaining words, we chose guesses which maximized phonological distance between labels. This approach yielded mismatched labels for six of our target words (target words in parentheses): beg (bag), roam (ran), noun (man), tune (tan), talk (tap), and pot (pat). For the four remaining words, we found that most agreement across listeners was focused on either or both of the initial and final consonants (e.g. for “mat” most guesses included a word final -t and initial nasal -m or -n) but varied in the choice of vowels. Therefore, we searched for CVC words in (Cowan, Citation1986) which adhered to the consonants common across responses but vowels which maximized phonological distance from the other mismatched labels in our list. This yielded the final four mismatched labels: but (bat), knit (mat), pain (pan), and wet (rat). On average, fewer participants guessed the mismatched labels than the matched labels (x̄ = 1.0 for mismatched labels, x̄ = 2.2 for matched labels), although the majority of both types of labels were only guessed by one or two participants. The number of participants who guessed the matched and mismatched labels was not significantly different (Wilcoxon sign rank test, W = 34.5, p = 0.18). The absence of a clear consensus on the identity of most of the similar words indicates that it should be feasible to train participants to use either label set without creating a disproportional conflict between the mismatched labels and participants’ interpretation of the vocoded words.
Phonological Corpus Tools (Hall et al., Citation2017) was used to calculate the phonological feature edit distance between all labels in each set. The edit distance is defined as the minimum number of phonological feature edits required to transform one word to another (Allen & Becker, Citation2015) based on the Hayes phonological feature set (Hayes, Citation2009). As expected, words in the acoustically distinct word set had a higher phonological edit distance (PED) from one another (x̄ = 17.6, s = 4.2) than the matched labels for the acoustically similar words (x̄ = 7.1, s = 2.9). The selection of mismatched labels described above achieved the goal of increasing the edit distance between labels within the set (x̄ = 12.0, s = 3.5), although the distance was less than in the distinct word set. The mean phonological edit distance between each label and all other labels in its set is provided in . The matched and mismatched labels had similar numbers of lexical neighbors (x̄ = 31, s = 5.3 for matched labels, x̄ = 25.8, s = 8.2 for mismatched labels, Storkel, Citation2013) and word frequency (Log contextual diversity, x̄ = 2.89, s = 0.51 for matched labels, x̄ = 2.86, s = 0.80 for mismatched labels, Brysbaert & New, Citation2009) to control for the effects of these factors on serial recall (Roodenrys, Hulme, Lethbridge, Hinton, & Nimmo, Citation2002).
Procedure
Each participant completed the forward serial recall task using the stimuli described above. All participants completed the task with the acoustically distinct word set and again with the acoustically similar word set, with half of the participants assigned to the matched labels and half assigned to the mismatched labels. Word set order was counterbalanced across participants and the set of labels used for the acoustically similar words were assigned randomly. Prior to serial recall for each word set, participants were trained to map target vocoded words to the corresponding orthographic labels used in that word set and their proficiency was assessed until they could successfully map every target word to the correct response. All target words were presented through Sennheiser HD 25 Light headphones at an average level of 65 dB SPL. The experimental procedure was implemented in E-Prime (Psychology Software Tools, Pittsburgh, PA).
Training and Proficiency Checks
Prior to serial recall, participants were trained to map the vocoded words to the orthographic labels which would be used to respond during that serial recall task. On each training trial, the participant heard a vocoded word three times in succession. During these presentations the corresponding orthographic label was displayed on the screen. The third presentation was followed by a cross displayed in the center of the screen and the presentation of all ten response labels for that set in a circle, and participants selected the corresponding label. Label locations were fixed across words during training. After ten training trials – one for each word in the current word set – participants completed a proficiency check. In the proficiency check the participant heard each word and had to select the corresponding label from the ten response options. If the participant correctly labeled all 10 words, they proceeded to the immediate serial recall trials for that set. If the participant made any errors, they repeated the entire training session before attempting the proficiency check again. Participants were given a maximum of ten attempts to pass the proficiency check. One participant was removed from the study and replaced because they reached this limit.
Phonological Similarity Effect Task
Participants completed 30 serial recall trials for each word set. In each trial, the participants heard a sequence of six vocoded target words presented with an inter-stimulus interval of 750 ms, with no repeats. At the end of the sequence, all ten response options appeared on the screen in a circle. Response locations varied randomly from trial to trial to limit spatial mapping. Participants selected the labels corresponding to each word in the order they were presented. Six responses were required on each trial. Participants were instructed to use a question mark (?) placeholder to indicate response positions they were unsure about. Task instructions emphasized the importance of word order and serial position. In between trials the set of ten labels for the current word set were displayed on screen. Responses were self-paced, with no time limits. Participants were encouraged to take a break between word sets.
Final Proficiency Check
After finishing serial recall for both word sets, participants completed the general subscale of the Goldsmiths Musical Sophistication Index (Müllensiefen, Gingras, Musil, & Stewart, Citation2014). This index was originally included for a separate investigation into musical sophistication and spontaneous strategy selection; nonetheless, it ultimately served as a convenient filler task to clear any lingering acoustic or phonological representations from short-term memory prior to the final proficiency check. Following the musical survey, 56 of the 80 participants (27 in the matched group, 29 in the mismatched group) repeated the proficiency check to assess word labeling accuracy. This posttest proficiency check was not implemented until partway through data collection, which is why not all participants performed this task. Each item was presented once and participants clicked on the associated label, without feedback or repetition if they incorrectly labeled any items.
Results
Serial Recall Accuracy
Participants who trained on the matched labels for both sets of words recalled the distinct words (x̄ = 0.75; s = 0.14) more accurately than the similar words (x̄ = 0.52; s = 0.16; t(39) = 9.86, p = 3.8*10−12; left panel). Thus, a standard phonological similarity effect was observed even when items were vocoded. Regardless of their training on the similar items, the two groups of participants had similar performance for the distinct words (x̄ = 0.749 for the matched labels in the similar word condition group, x̄ = 0.756 for the mismatched labels group, t(78) = −0.24, p = 0.81). Given that the distinct word condition was identical across both groups, this lack of difference indicates that the ability to perform serial recall was equal across the two groups. Because the two groups performed similarly in the distinct condition, we directly compared performance across conditions rather than transform accuracy into a difference score, as is common in examinations of the phonological similarity effect.
Figure 2. Recall accuracy across word sets. Each thin line represents the proportion of items recalled in the correct position by an individual in the conditions they completed. Thick lines show group averages across conditions
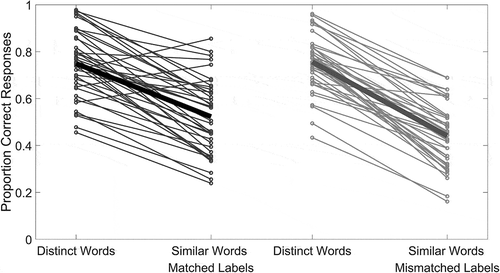
The motivation of the experiment was to determine whether recall would improve when participants were able to map similar acoustic inputs to distinct (although mismatched) phonological representations. However, the group that was trained with the matched labels (x̄ = 0.52; s = 0.16) had higher accuracy than the group that was trained with the mismatched labels (x̄ = 0.44, s = 0.13) of the similar words, t(78) = 2.47, p = 0.016). This finding, depicted in , goes against our initial prediction, which was either equivalent accuracy across labels (if recall was driven by acoustic cues) or better accuracy for the mismatched labels (if performance was driven by phonological storage). We further analyzed performance across training and proficiency checks, individual items, and serial position to characterize the nature of this difference in recall accuracy.
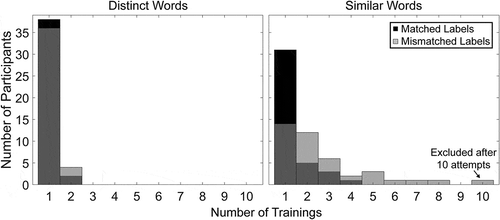
Training and Proficiency Checks
The increased difficulty of recalling similar words when they were paired with mismatched labels suggests the mapping of words to response labels was not learned as effectively in this group. To examine this possibility, we compared the number of times each participant had to repeat the training for each set and the identification accuracy for the posttest proficiency check (). Nearly all participants learned the distinct word labels in a single round of training (x̄ = 1.05 for the matched label group, x̄ = 1.1 for the mismatched label group), whereas more participants required additional training for the similar word sets (x̄ = 1.35 for the matched labels, x̄ = 2.68 for the mismatched labels). More rounds of training were needed to learn the mismatched labels than to learn the matched labels (Wilcoxon Rank Sum Test, W = 1257, p = 4.4*10−5), which indicates that the mismatched labels were more difficult to learn. For participants who completed the post-task repeat of the proficiency check, there was a small drop in labeling accuracy for words presented one at a time for the mismatched labels relative to the matched labels (98.9% accuracy for matched labels, 95.2% accuracy for mismatched labels, p = 0.012 for Fisher’s Exact test), which further indicates that some participants may not have strongly learned the mapping of words to mismatched labels. At the end of the experiment participants were asked about the stimuli during the strategy self-report. All participants who were trained on the mismatched labels reported that they were unaware of the systematic mismatch manipulation.
Figure 3. Number of trainings prior to passing the proficiency check for each word set. Participants are grouped by whether they were trained on the matched or mismatched labels for the similar words, although all participants were trained on the same labels for the distinct words
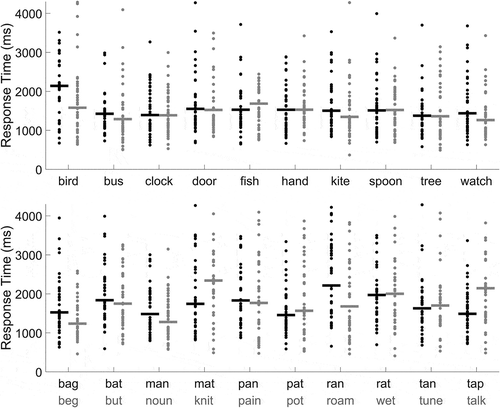
shows the distribution of response times for the proficiency check that every participant passed. Response times greater than 4 standard deviations above the mean were labeled as outliers and removed, and this process was repeated until no remaining reaction times were labeled as outliers (Schmiedek, Oberauer, Wilhelm, Süß, & Wittmann, Citation2007). This definition of outliers removed at most 2 data points for a word, ensuring that sufficient data were retained for statistical analysis. Geometric means were taken across correct responses to all items and participants in each group. There were no systematic differences in reaction time across groups for each word list (Wilcoxon rank sum tests, threshold was p < 0.005 after Bonferroni correction), although the difference between the labels “tap” and “talk” was marginal after correction for multiple comparisons (656 ms, p = 0.0047). The relatively small number of trials in the proficiency check data makes it difficult to detect small differences in response time, but the similar distribution of means across groups suggests that there is no systematic difference in response time across groups. Across word lists, responses were on average 206 ms slower for the similar words than for the distinct words (Wilcoxon Sign rank test, p = 1.2*10−8).
Figure 4. Response times in initial proficiency checks for each word and label. Each dot represents the response from one participant and horizontal lines show the geometric mean of response times across all participants for the corresponding word/label combination. Response times longer than 4.3 s are not shown to emphasize mean differences
Item Analysis
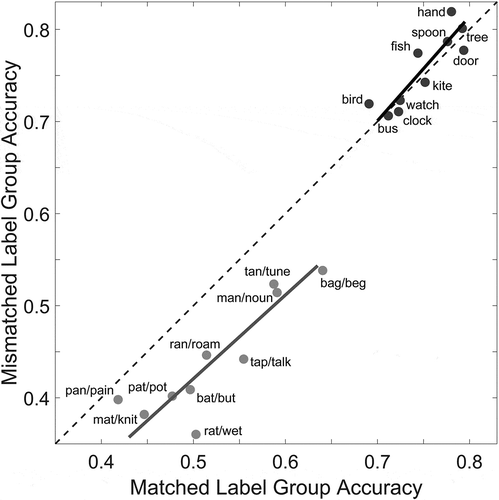
We examined average recall accuracy for each word across both groups (). Auditory tokens had high rank-order correlation of recall accuracy (distinct words r = 0.87, p = 0.003, similar words r = 0.84, p = 0.004) across the matched and mismatched training groups, indicating that the relative difficulty of recalling individual items within sets is consistent, even across labels. The effect of changing responses from the matched labels to the mismatched labels for the similar words is a consistent decline in recall accuracy across all words (Wilcoxon sign rank test, W = 55, p = 0.002), as shown by the distribution of similar words below the unity slope line in .
Figure 5. Comparison of word recall accuracy between the two groups, averaged across participants and list positions. Each point represents recall accuracy for one word across both groups. Response labels for each word are provided next to the corresponding point. The distinct words, shown in black, had the same response label across both groups, while the similar words, shown in gray, differed in the use of matched/mismatched labels across groups. Solid lines show model II Standard Major Axis Regression (Legendre, Citation2013) trends for each word set and the dashed line shows equality across groups
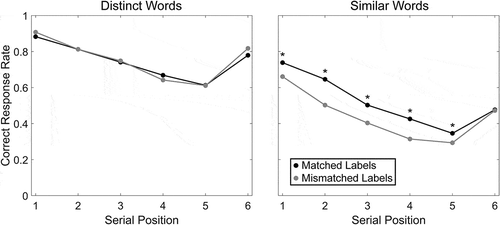
Serial Position and Order
The trends observed in are repeated when recall accuracy is broken down by serial position (). When recalling distinct words, the two groups performed similarly across all six serial positions. However, for the similar items, differences in recall accuracy were found for positions 1 through 5 across labels (Fisher’s exact test, p < 0.0083, which is the significance threshold after correcting for multiple comparisons). This difference was smaller for position 5 and was not evident for position 6.
Figure 6. Recall accuracy across item positions for each word set. Participants are grouped based on which label condition they completed, as in Figure 2. Each point represents the proportion of correct responses for each serial position in each word set across participants. Significant differences across groups after Bonferroni correction for each position are indicated by asterisks
We conducted an analysis modeled after Fallon, Groves, and Tehan (Citation1999) to characterize whether errors arose solely from difficulty identifying and/or recalling individual items or whether errors in item order also contributed to reduced serial recall performance for mismatched labels. In this analysis, memory for items is calculated using a lenient scoring procedure in which an item is scored correct regardless of its position in recall – as long as it had been presented in the target list (see also Chen & Cowan, Citation2009). Memory for item order is calculated as the proportion of those items which were additionally recalled in the correct position. For distinct words, on average 5.5 out of 6 items (91%) were correctly recalled on each trial, and out of those recalled items 81% were recalled in the correct position. For similar words with matched labels, 4.6 out of 6 items (77%) were correctly recalled on each trial, with 66% of the recalled items in the correct position. For similar words with mismatched labels, 4.2 out of 6 items (70%) were correctly recalled on each trial, with 61% of the recalled items in the correct position. Similar items with matched labels were recalled at a lower rate and were recalled in the correct position less frequently than distinct items (Wilcoxon Sign Rank tests, p = 1.4*10−11, W = 815 for item recall and p = 3.5*10−8, W = 774 for proportion recalled in the correct position). The number of recalled items and the rate at which they were recalled in the correct position were also lower with the mismatched labels relative to the matched labels (Wilcoxon Rank Sum tests, p = 0.011, W = 1883 for item recall and p = 0.041, W = 1832 for proportion recalled in the correct position). This analysis indicates that the added difficulty of the mismatched labels relative to the matched labels is due to both decreased accuracy in labeling words and decreased ability to respond in order.
Discussion
Contrary to our initial expectations, serial recall accuracy was worse for similar words when they were mapped to mismatched – but distinct – labels than when they were mapped to their matched phonologically similar labels. This decrease in accuracy was evident at all serial positions except the last and across all items. Decreased accuracy was caused by both a diminished ability to remember the presented items and reduced recall of the correct item order. Similar items presented one at a time in the proficiency check were labeled more slowly than dissimilar items, with no systematic differences in response times between matched and mismatched labels.
Decreased recall accuracy with mismatched labels relative to the matched labels () indicates that serial recall is not limited solely by the phonological similarity of items to be remembered. If this were the case, we would expect recall accuracy to increase for the mismatched labels because the mismatched labels were more phonologically distinct from one another. Instead, it seems that added difficulty in mapping acoustic stimuli to phonological labels impaired recall accuracy.
Weaker Mapping of Mismatched Labels
The broad range of guesses as to the true identity of the vocoded acoustically similar words () indicates that participants did not have a unique mapping of the vocoded stimuli to lexical labels for those stimuli. Instead, hearing these vocoded words activated a neighborhood of words that could serve as plausible interpretations of the stimulus. This plausibility was confirmed by the fact that no participants who were trained on the mismatched labels were aware that the labels did not match the vocoded target word. It is possible that some participants may have found different labels for the vocoded targets more plausible than the labels they were trained on, but their lack of awareness of mismatch indicates that they were not explicitly mapping their own internal labels onto the trained response labels. All participants successfully passed the proficiency check before moving onto the memory task, which indicated they had learned the mapping of acoustic stimuli to response labels to some extent in each condition. The amount of training required to pass the proficiency check was greater with the mismatched labels (). Moreover, participants who completed the posttest proficiency check had slightly lower identification accuracy for the mismatched labels than participants who were trained on the matched labels, though overall identification accuracy was high for both groups. Reduced item identification accuracy is insufficient to fully explain the observed disruptions to serial recall. Participants trained on the mismatched labels were able to correctly identify 95.2% of items during the final proficiency check. Had their serial recall been reduced relative to the matched group by the 4.8% of misidentified items, their mean recall would have been.50 rather than the mean of .44 which was observed; moreover, if item identification were the sole explanation, it would have impaired serial recall performance similarly across all serial positions. Instead, the current results indicate that the weaker activation strength of mismatched labels disrupts the acoustic-lexical mapping process for individual items but imposes disproportionally more disruption when multiple items must be mapped in serial order.
The decrease in recall accuracy for mismatched labels was evident across the entire stimulus set, so this decrease could not be attributed to variable difficulty across items within the set. Response times during the proficiency check for similar words did not differ across matched and mismatched labels () and rank order recall accuracy was consistent across labels in the serial recall task (). This consistency in performance across response labels suggests that some portion of identification difficulty arises at an acoustic level. One notable acoustic property is the consistent vowel sound in the similar word lists. Every spoken word had an/a/vowel nucleus, but the mismatched labels mapped that vowel onto a variety of vowels. This remapping may not be bothersome when words are presented in isolation, but in the context of a sequence of items the inconsistency between acoustic and phonological vowels may become more apparent and interfere with mapping. It is also possible that participants could be strategically ignoring the fixed vowel for the matched words. Participants are aware that the matched labels for similar words all share a common vowel, so they could decide to allocate more attention to the initial and final consonants in each word and not encode the vowel knowing that it provides no distinctive information. This could possibly reduce the number of phonemes that need to be remembered.
Weaker Mapping Produces Position and Order Effects
If weakened activation is responsible for the decrease in serial recall accuracy for mismatched labels, we would expect to find differences in serial recall accuracy for positions early in the list as well as diminished order accuracy. Both patterns were observed (). There are two explanations for how this weakened mapping could differentially affect early positions in serial recall. One possibility is that the effort required to map stimuli in unclear listening conditions disrupts maintenance of items presented in earlier list positions (e.g. Piquado et al., Citation2010; Rabbitt, Citation1968). A second possibility is that individuals may wait longer to identify items when items are unclear and maintain what they heard in a more acoustic form (e.g. Farris-Trimble et al., Citation2014; McMurray et al., Citation2017), which would lead to overwriting before items early in the list were identified. As shown in , the largest differences in recall accuracy across response labels was at serial positions 1 through 4, with a smaller difference at position 5 and no difference at position 6. Our finding is consistent with these possibilities, in that difficulty processing items later in the list could disrupt or overwrite memory for items in earlier in the list, leaving terminal positions unaffected. Note that our study differs from previous studies because we manipulated the labels assigned to acoustic stimuli, rather than altering the acoustic stimuli themselves. When the similarity of acoustic stimuli is manipulated, similar acoustic stimuli will be within the lexical neighborhood of one another and will compete with one another for activation (Luce & Pisoni, Citation1998). Increasing competition between items due to acoustic similarity will diminish the difference in activation strength between items, which produces difficulties in both encoding and retrieving items in order (Hurlstone et al., Citation2014). The fact that we observed position effects across matched and mismatched labels which are predicted by mechanism described above supports the claim that these position effects arise from changes in relative activation strength between items in the mapping process, regardless of whether these changes are driven by acoustic manipulations, as in previous studies, or phonological manipulations, as in the current study.
The phonological similarity effect impairs recall of the order of items (Watkins, Watkins, & Crowder, Citation1974), which was also observed in the current study when comparing recall of distinct words with recall of similar words with matched labels. Using the mismatched response labels further impaired memory for item order, in addition to decreasing the total number of items that were recalled. This finding indicates that the added difficulty of mapping items interferes with coding of order in addition to identity. This is consistent with the idea that order and identity are encoded together (Coltheart, Citation1993; Farrell & Lewandowsky, Citation2003). If mapping acoustic stimuli onto response labels is more effortful or less salient with the mismatched stimuli, then it is possible that the declines in item and order and recall could be attributed to diminished item-to-item associations (Miller & Roodenrys, Citation2012), potentially via diffuse or weaker activation of words in long term memory (Poirier, Saint-Aubin, Mair, Tehan, & Tolan, Citation2015). This explanation does not exclude additional difficulties during retrieval, although retrieval inherently depends on what information was encoded in the first place.
Limitations
The current results provide a novel perspective on the phonological similarity effect, but their interpretation is limited by the number of possible mechanisms underlying these results. The added difficulty using the mismatched labels relative to the matched labels was not predicted in our original hypotheses, so the interpretation described above must be considered in the context that it was developed post-hoc. Our results are consistent with the activation strength theory described above, but this consistency merely shows that the theory we posit is plausible, not that it is correct. Other theoretical explanations could potentially account for the same set of results. This experiment combines the effects of mismatched mappings and phonological similarity, so it is not possible to estimate the magnitude of each effect in isolation from these data. It would also be useful to incorporate measures of mapping strength that were independent of the tasks used here to verify that the mapping of mismatched labels was weaker than matched labels in a manner consistent with our interpretation of the data. An alternative would be to use stimuli-response pairings that do not differ in mapping strength. It is unknown whether additional experience listening to these stimuli would eliminate differences in the matched and mismatched conditions. For example, adaptation to vocoded (Davis, Johnsrude, Hervais-Adelman, Taylor, & McGettigan, Citation2005) or nonnative accented (e.g. Bradlow & Bent, Citation2008) speech can be observed within brief training sessions, so it is possible that the observed differences across labels would disappear with sufficient training. Finally, the strength of the phonological similarity effect can be affected by manipulations such as the inclusion of interfering stimuli in complex span tasks and articulatory suppression (Camos, Mora, & Barrouillet, Citation2013; Chow, Macnamara, & Conway, Citation2016), so it would be of interest to determine whether mapping difficulty is affected by these manipulations as well.
Implications For Hearing Loss
Difficulties mapping degraded sequences of acoustic stimuli to linguistic representations is a barrier to successful speech recognition in patients with hearing loss. The ability of the auditory pathway to convey spectral and temporal speech cues varies across individuals with acoustic hearing loss (Davies-Venn, Nelson, & Souza, Citation2015; Mehraei, Gallun, Leek, & Bernstein, Citation2014) and individuals with cochlear implants (Anderson et al., Citation2012; Litvak, Spahr, Saoji, & Fridman, Citation2007; Pfingst, Xu, & Thompson, Citation2004; Saoji, Litvak, Spahr, & Eddins, Citation2009; Winn, Won, & Moon, Citation2016; Won, Drennan, Nie, Jameyson, & Rubinstein, Citation2011). Degraded acoustic cues lead to confusion in mapping acoustic cues to phonological representations (Munson, Donaldson, Allen, Collison, & Nelson, Citation2003; Phatak, Yoon, Gooler, & Allen, Citation2009). In addition to creating difficulty identifying individual phonemes or words, our results indicate that such confusions would also likely impair recall sequences of verbal information in these listeners. In particular, listeners with cochlear implants must relearn the mapping between electrical stimulation provided by a cochlear implant and previously acquired linguistic representations after an implant is activated, with patients usually needing around three to twelve months to reach asymptotic speech recognition accuracy (Wilson & Dorman, Citation2008). Even if individuals with cochlear implants can learn the mapping of acoustic cues to linguistic representations the resulting activation of those linguistic representations is likely weaker with the relearned mapping. If this were the case, then recall of speech sequences would be impaired by the weakened mapping, as we found with the mismatched labels in this experiment. Our recent work indicates that individual differences in serial recall ability are correlated with the recognition of degraded sentences in young adults with normal hearing (Bosen & Barry, Citation2020), so it is possible that some of the difficulty in speech recognition with a hearing loss arises from the impairment of serial recall when listening to mismatched acoustic to phonetic mappings. In support of this possibility, the ability of individuals to adapt to a novel listening conditions, such as changes to aspects of acoustic processing in hearing aids (Rudner, Foo, RÖnnberg, & Lunner, Citation2009; Rudner, Rönnberg, & Lunner, Citation2011) or accented speech (McLaughlin, Baese-Berk, Bent, Borrie, & Van Engen, Citation2018), is associated with their working memory. This association indicates that patients who have stronger memory skills with which to activate novel acoustic-phonetic mappings are more likely to be able to remember speech sequences and thereby successfully use their assistive devices.
Acknowledgments
This work was supported by a NIH Centers of Biomedical Research Excellence (COBRE) grant (NIH-NIGMS/5P20GM109023-05). We would like to thank Elizabeth Schneider for assistance creating the recorded stimuli for this study and Rebecca Wagner for assistance with data collection.
Disclosure Statement
The authors have no conflicts of interest to disclose.
Data Availability Statement
All data and analyses are available at https://osf.io/qgfa2/.
Additional information
Funding
References
- Allen, B., & Becker, M. (2015). Learning alternations from surface forms with sublexical phonology. Available at lingbuzz/002503
- Anderson, E. S., Oxenham, A. J., Nelson, P. B., & Nelson, D. A. (2012). Assessing the role of spectral and intensity cues in spectral ripple detection and discrimination in cochlear-implant users. The Journal of the Acoustical Society of America, 132(6), 3925–3934.
- Baddeley, A. D. (1968). How does acoustic similarity influence short-term memory? The Quarterly Journal of Experimental Psychology, 20(3), 249–264.
- Bosen, A. K., & Barry, M. F. (2020). Serial recall predicts vocoded sentence recognition across spectral resolutions. Journal of Speech, Language, and Hearing Research, 63(4), 1282–1298
- Bosen, A. K., & Luckasen, M. C. (2019). Interactions between item set and vocoding in serial recall. Ear and Hearing, 40(6), 1404–1417.
- Bradlow, A. R., & Bent, T. (2008). Perceptual adaptation to non-native speech. Cognition, 106(2), 707–729.
- Brysbaert, M., & New, B. (2009). Moving beyond Kučera and Francis: A critical evaluation of current word frequency norms and the introduction of a new and improved word frequency measure for American English. Behavior Research Methods, 41(4), 977–990.
- Camos, V., Mora, G., & Barrouillet, P. (2013). Phonological similarity effect in complex span task. Quarterly Journal of Experimental Psychology, 66(10), 1927–1950.
- Chen, Z., & Cowan, N. (2009). Core verbal working-memory capacity: The limit in words retained without covert articulation. Quarterly Journal of Experimental Psychology, 62(7), 1420–1429.
- Chow, M., Macnamara, B. N., & Conway, A. R. A. (2016). Phonological similarity in working memory span tasks. Memory and Cognition, 44(6), 937–949.
- Coltheart, V. (1993). Effects of phonological similarity and concurrent irrelevant articulation on short-term-memory recall of repeated and novel word lists. Memory & Cognition, 21(4), 539–545.
- Conrad, R. (1979). The deaf schoolchild: Language and cognitive function. London: Harper & Row
- Conrad, R., & Hull, A. J. (1964). Information, acoustic confusion and memory span. British Journal of Psychology, 55(4), 429–432.
- Cowan, N. (1986). A matrix of consonant-cluster-free monosyllabic words in English. Behavior Research Methods, Instruments, & Computers, 18(5), 434–446.
- Davies-Venn, E., Nelson, P., & Souza, P. (2015). Comparing auditory filter bandwidths, spectral ripple modulation detection, spectral ripple discrimination, and speech recognition: Normal and impaired hearing. The Journal of the Acoustical Society of America, 138(1), 492–503.
- Davis, M. H., Johnsrude, I. S., Hervais-Adelman, A., Taylor, K., & McGettigan, C. (2005). Lexical information drives perceptual learning of distorted speech: Evidence from the comprehension of noise-vocoded sentences. Journal of Experimental Psychology: General, 134(2), 222–241.
- Fallon, A. B., Groves, K., & Tehan, G. (1999). Phonological similarity and trace degradation in the serial recall task: When CAT helps RAT, but not MAN. International Journal of Psychology, 34(5–6), 301–307.
- Farrell, S., & Lewandowsky, S. (2003). Dissimilar items benefit from phonological similarity in serial recall. Journal of Experimental Psychology: Learning Memory and Cognition, 29(5), 838–849.
- Farris-Trimble, A., McMurray, B., Cigrand, N., & Tomblin, J. B. (2014). The process of spoken word recognition in the face of signal degradation. Journal of Experimental Psychology: Human Perception and Performance, 40(1), 308–327.
- Friesen, L. M., Shannon, R. V., Baskent, D., & Wang, X. (2001). Speech recognition in noise as a function of the number of spectral channels: Comparison of acoustic hearing and cochlear implants. The Journal of the Acoustical Society of America, 110(2), 1150–1163.
- Greenwood, D. D. (1990). A cochlear frequency-position function for several species – 29 years later. The Journal of the Acoustical Society of America, 87(6), 2592–2605.
- Hall, K. C., Allen, B., Fry, M., Johnson, K., Lo, R., Mackie, S., & McAuliffe, M. (2017). Phonological CorpusTools, Version 1.3. [Computer program]. Available from http://phonologicalcorpustools.github.io/CorpusTools/.
- Hayes, B. (2009). Introductory Phonology. Malden, MA ; Oxford : Wiley-Blackwell
- Hurlstone, M. J., Hitch, G. J., & Baddeley, A. D. (2014). Memory for serial order across domains: An overview of the literature and directions for future research. Psychological Bulletin, 140(2), 339–373.
- Jarrold, C., Cocksey, J., & Dockerill, E. (2008). Phonological similarity and lexicality effects in children’s verbal short-term memory: Concerns about the interpretation of probed recall data. The Quarterly Journal of Experimental Psychology, 61(2), 324–340.
- Legendre, P. (2013). Model II regression user’s guide, R edition. R Vignette, 4, 1–14. Retrieved from http://ftp-nyc.osuosl.org/pub/cran/web/packages/lmodel2/vignettes/mod2user.pdf
- Litvak, L. M., Spahr, A. J., Saoji, A. A., & Fridman, G. Y. (2007). Relationship between perception of spectral ripple and speech recognition in cochlear implant and vocoder listeners. The Journal of the Acoustical Society of America, 122(2), 982–991.
- Luce, P. A., & Pisoni, D. B. (1998). Recognizing spoken words: The neighborhood activation model. Ear and Hearing, 19(1), 1–36.
- McLaughlin, D. J., Baese-Berk, M. M., Bent, T., Borrie, S. A., & Van Engen, K. J. (2018). Coping with adversity: Individual differences in the perception of noisy and accented speech. Attention, Perception, and Psychophysics, 80(6), 1559–1570.
- McMurray, B., Farris-Trimble, A., & Rigler, H. (2017, August). Waiting for lexical access: Cochlear implants or severely degraded input lead listeners to process speech less incrementally. Cognition, 169, 147–164.
- Mehraei, G., Gallun, F. J., Leek, M. R., & Bernstein, J. G. W. (2014). Spectrotemporal modulation sensitivity for hearing-impaired listeners: Dependence on carrier center frequency and the relationship to speech intelligibility. The Journal of the Acoustical Society of America, 136(1), 301–316.
- Miller, L. M., & Roodenrys, S. (2012). Serial recall, word frequency, and mixed lists: The influence of item arrangement. Journal of Experimental Psychology: Learning Memory and Cognition, 38(6), 1731–1740.
- Müllensiefen, D., Gingras, B., Musil, J., & Stewart, L. (2014). The musicality of non-musicians: An index for assessing musical sophistication in the general population. PLoS ONE, 9(2), e89642.
- Munson, B., Donaldson, G. S., Allen, S. L., Collison, E. A., & Nelson, D. A. (2003). Patterns of phoneme perception errors by listeners with cochlear implants as a function of overall speech perception ability. The Journal of the Acoustical Society of America, 113(2), 925–935.
- Pfingst, B. E., Xu, L., & Thompson, C. S. (2004). Across-site threshold variation in cochlear implants: Relation to speech recognition. Audiology and Neuro-Otology, 9(6), 341–352.
- Phatak, S. A., Yoon, Y., Gooler, D. M., & Allen, J. B. (2009). Consonant recognition loss in hearing impaired listeners. The Journal of the Acoustical Society of America, 126(5), 2683–2694.
- Piquado, T., Cousins, K. A. Q., Wingfield, A., & Miller, P. (2010). Effects of degraded sensory input on memory for speech: Behavioral data and a test of biologically constrained computational models. Brain Research, 1365, 48–65.
- Poirier, M., Saint-Aubin, J., Mair, A., Tehan, G., & Tolan, A. (2015). Order recall in verbal short-term memory: The role of semantic networks. Memory and Cognition, 43(3), 489–499.
- Rabbitt, P. M. A. (1968). Channel-capacity, intelligibility, and immediate memory. Quarterly Journal of Experimental Psychology, 20(3), 241–248.
- Roodenrys, S., Hulme, C., Lethbridge, A., Hinton, M., & Nimmo, L. M. (2002). Word-frequency and phonological-neighborhood effects on verbal short-term memory. Journal of Experimental Psychology: Learning, Memory, and Cognition, 28(6), 1019–1034.
- Rudner, M., Foo, C., RÖnnberg, J., & Lunner, T. (2009). Cognition and aided speech recognition in noise: Specific role for cognitive factors following nine-week experience with adjusted compression settings in hearing aids. Scandinavian Journal of Psychology, 50(5), 405–418.
- Rudner, M., Rönnberg, J., & Lunner, T. (2011). Working memory supports listening in noise for persons with hearing impairment. Journal of the American Academy of Audiology, 22(3), 156–167.
- Saoji, A. A., Litvak, L., Spahr, A. J., & Eddins, D. A. (2009). Spectral modulation detection and vowel and consonant identifications in cochlear implant listeners. Journal of the Acoustical Society of America, 126(3), 955–958.
- Schmiedek, F., Oberauer, K., Wilhelm, O., Süß, H. M., & Wittmann, W. W. (2007). Individual differences in components of reaction time distributions and their relations to working memory and intelligence. Journal of Experimental Psychology: General, 136(3), 414–429.
- Storkel, H. L. (2013). A corpus of consonant-vowel-consonant (CVC) real words and nonwords: Comparison of phonotactic probability, neighborhood density, and consonant age-of-acquisition. Behavior Research Methods, 45(4), 1159–1167.
- Watkins, M. J., Watkins, O. C., & Crowder, R. G. (1974). The modality effect in free and serial recall as a function of phonological similarity. Journal of Verbal Learning and Verbal Behavior, 13(4), 430–447.
- Wilhelm, O., Hildebrandt, A., & Oberauer, K. (2013, JUL). What is working memory capacity, and how can we measure it? Frontiers in Psychology, 4, 1–22.
- Wilson, B. S., & Dorman, M. F. (2008). Cochlear implants: Current designs and future possibilities. The Journal of Rehabilitation Research and Development, 45(5), 695–730.
- Winn, M. B., Won, J. H., & Moon, I. J. (2016). Assessment of spectral and temporal resolution in cochlear implant users using psychoacoustic discrimination and speech cue categorization. Ear and Hearing, 37(6), e377–e390.
- Won, J. H., Drennan, W. R., Nie, K., Jameyson, E. M., & Rubinstein, J. T. (2011). Acoustic temporal modulation detection and speech perception in cochlear implant listeners. The Journal of the Acoustical Society of America, 130(1), 376–388.