
 ?Mathematical formulae have been encoded as MathML and are displayed in this HTML version using MathJax in order to improve their display. Uncheck the box to turn MathJax off. This feature requires Javascript. Click on a formula to zoom.
ABSTRACT
In this paper, a systematical research of the cathodic plasma electrolysis process on steel materials was carried out. The plasma electrolytic saturation and oxidation were integrated together. The evolution of carbon diffusion layer to oxidation film from the critical voltage to the oxidation voltage was investigated. The results showed that there was a significant increase of steel surface temperature at the critical voltage, accompanied by a grain refinement near the interface. Above the critical voltage, the carburizing process started. The carbon diffusion coefficient at 380 V was 1.5 × 10⁻⁷ cm2 s−1, which was one order of magnitude higher than that of the traditional carburizing at the same temperature. As the voltage rising, the activity of oxygen species increased and the carburizing process was replaced by an oxidation process. Meanwhile, the carbon atoms were released from the interstitial sites and gradually aggregated into carbon particles, embedded in the oxide layer on steel surface.
Introduction
Cathodic plasma electrolysis (CPE) is a plasma saturation and deposition process under atmospheric pressure, and the plasma is sustained by a continuous discharge in the near-cathode region with abundant activated electrons [Citation1,Citation2]. Due to its high efficiency and low cost, the CPE approach has aroused a wide attention in the application of metal surface modification and pollutant degradation [Citation3–8]. In the CPE process on steel materials, active carbon or nitrogen species, decomposed from organic electrolyte are accelerated by electric field to generate an interstitial diffusion into the iron atoms lattice, forming carburized or nitride layer with enhanced wear and corrosion resistance [Citation9–11]. The physicochemical reactions at the interface of cathode and plasma envelope are complex. However, till now, most of the CPE studies focus on the technological improvement and performance enhancement for the modified layer, while the plasma discharge mechanism, the interfacial reactions and evolution of the modified layer during the CPE process are rarely investigated systematically. Lin et al. [Citation12] summarized the plasma electrolytic saturation technology on steels, focusing on the description of relation between structure and properties. Parfenov et al. [Citation13] provided a general overview of plasma electrolysis modeling, but the specific or detailed CPE process such as plasma electrolytic carburizing (PEC) was seldom involved. As is well known, the traditional carburizing techniques are usually carried out at high temperature with a long treating time, which results in the local distortion and high energy consumption. In contrast, PEC technique is performed in the aqueous solution at room temperature and under the atmospheric pressure. A carburized layer of several microns thick can be formed in a few minutes. Thus, the preparation efficiency is higher and the preparation cost is lower than that of the traditional carburizing techniques.
Plasma electrolysis in solution is developed from conventional electrolysis and is characterized by a sufficiently high applied voltage between electrodes. When the voltage is applied, the solution is heated to produce a continuous gaseous envelope around the electrode surface. By increasing the voltage to a critical value, the gaseous envelope is damaged, leading to the plasma discharge and decomposition of organic electrolyte. As a result, the reaction products of plasma electrolysis process might be quite different from that of conventional electrolysis based on the Faraday’s law. For example, O2 may appear at the cathode and H2 may appear at the anode. Jin et al. [Citation14] reported a novel oxidation phenomenon on stainless steel which served as the cathode, but further research about the oxidation mechanism and interfacial reactions on cathode was absent. Also, this oxidation phenomenon is different from the common plasma electrolytic oxidation which occurred on the anode [Citation15,Citation16].
In this study, the carbon evolution process during CPE on steel in glycerol aqueous solution was investigated. The surface temperature of the steel sample and the diffusion coefficient of carbon were evaluated. Optical emission spectroscopy (OES) method was employed to examine the plasma discharge mechanism and the interfacial reactions near the cathode. The active species in plasma envelope were determined and the plasma electron temperature was calculated. Meanwhile, the morphology, composition and structural features of CPE treated steel under different discharge voltages were analyzed. The evolution process of the modified layers on steel substrate was discussed.
Experimental procedures
Materials and solution
The substrate material was a 2 mm thick carbon steel (C: 0.75–0.84, Si: ≤0.35, Mn: ≤0.40, P: ≤0.035, S: ≤0.030, wt.%, Fe balance) sheet with 55 mm × 15 mm dimensions. It was set as the cathode during plasma electrolysis process. The anode was a stainless steel container containing 80 vol.% glycerol and 20 vol.% deionized water, which served as the electrolyte solution. In order to guarantee the conductivity of the solution, a little potassium chloride was added into it. A pulse DC power supply was employed to sustain the plasma discharge during CPE process. The pulse frequency and pulse width were fixed at 150 Hz and 3 ms, respectively. Also, the water circulation system and stirring system were introduced to sustain the electrolyte solution at ambient temperature. Before the CPE experiment, the steel sample was mechanically polished with 1000-grit emery paper, and then was cleaned in ethanol and dried.
Procedure and parameters
The steel cathode was immersed in the glycerol aqueous solution at ambient temperature. Initially, the negative bias voltage was set at 150 V for a while. On this occasion, a continuous gaseous envelope can be formed around the cathode due to the thermal effect of current. The gaseous envelope mainly consisted of electrolyte vapor with a low electrical conductivity. Then, the voltage gradually increased to break down the gaseous envelope and activate the plasma discharge, and this voltage can be defined as the critical voltage. Furthermore, the dependence of steel sample surface temperature on the applied voltage was measured by a thermocouple. The thermocouple was inserted into a hole whose bottom was 0.5 mm from the surface of steel sample with tolerance of ±0.05 mm. Finally, a stable arc discharge started at a preset voltage like 360, 380 or 400 V, which are higher than the critical voltage. After several minutes, the power supply was turned off and the steel sample was washed in the running water and dried.
Characterization and analysis
During the CPE process, the optical signals of plasma discharge were collected by an optical emission spectrometer (Avantes AvaSpec-3648). The spectral resolution, integration time and distance of optical fiber probe to steel sample surface were 0.08 nm, 1 s and 20 mm, respectively. The microstructure and composition analysis of the CPE treated steel were carried out by optical microscope (Zeiss AxioImagerA2), scanning electron microscopy (SEM, Hitachi SU-8010) equipped with energy disperse spectroscopy (EDS) and X-ray diffraction (XRD, Bruker D8A) with Cu Kα radiation (λ = 1.5418 Å).
Results
Relation between applied voltage and sample temperature
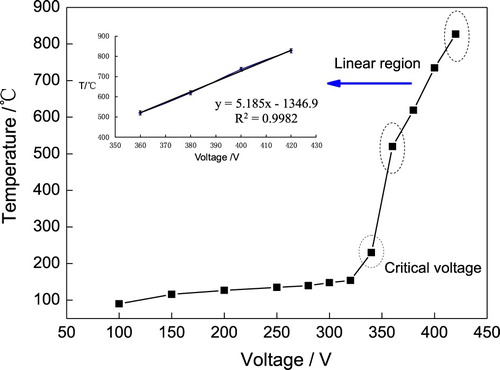
It is known that surface temperature plays a key role on the diffusion process of carbon into the steel matrix. Conventional pack carburizing for steel materials is usually carried out at high temperature up to 1000°C [Citation17]. During the CPE process, the sample surface temperature mainly depends on the applied voltage of power supply. shows the dependence of sample surface temperature on the applied voltage. When the voltage was below 320 V, the temperature rised slowly and no spark appeared in this period. From 340 V, however, the temperature started to rise rapidly. This is because the gaseous envelope on the steel sample was broken down and plasma discharge generated large amounts of heat. When the voltage exceeded 360 V, the temperature increased almost linearly with the coefficient of regression R2 = 0.9982. Therefore, the 340 V can be recognized as the critical voltage, from which moment the plasma discharge started and carbon diffusion process initiated. At a voltage higher than 340 V, the plasma discharge became stable, exhibiting a bright arc wandering on the cathode surface.
Figure 1. Dependence of sample temperature on applied voltage during the CPE process.
Morphology of the steel sample at critical voltage
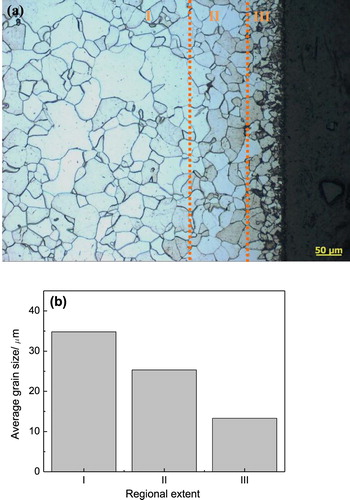
(a) shows the cross-sectional image of CPE treated steel at critical voltage of 340 V in the optical microscope. A hierarchical structure with different grain size can be clearly observed. The statistical average grain sizes of three typical regions are displayed in (b). It shows that the grain size gradually decreases from the steel matrix (region I) to the surface (region III). At the critical voltage of 340 V, the initialization of plasma discharge generated considerable heat flux, heating the steel surface. Since the plasma envelope was not thick enough, the room-temperature electrolyte can contact the hot surface intermittently, resulting in the quenching effect and grain refinement on the steel surface. Meanwhile, carbon atoms began to diffuse along the grain boundaries, as shown in the dark areas in region III. They acted as the second-phase particles and gave rise to a pinning effect which hindered the growth of grain [Citation18]. Moreover, the grain refinement could contribute to the strengthening of steel surface performance.
Figure 2. (a) Cross-sectional image of the CPE treated steel at 340 V, (b) average grain sizes of three typical regions, I: steel matrix, II: transition region, III: surface region.
Carbon diffusion process at carburizing voltage
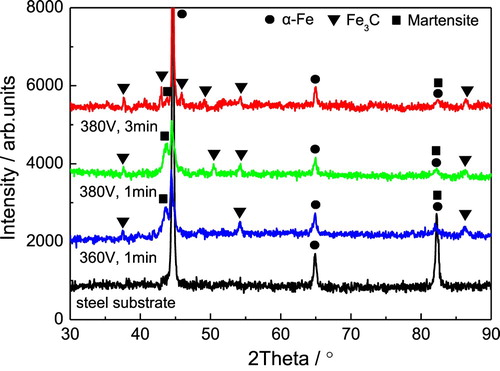
Above the critical voltage, the substantial carburizing process started. shows the cross-sectional morphologies of the CPE treated steel at 360 V for 1 min, 380 V for 1 min, and 380 V for 3 min, respectively. It is clear that with the voltage increases and discharge time prolonged, the thickness of carburized layer increased from 20 μm (360 V, 1 min) to about 70 μm (380 V, 3 min). The XRD analysis in shows that the main phase in the CPE treated steel is Fe3C, except for the ferrite (α-Fe) from steel substrate. It indicates that carbon atoms have successfully diffused into the steel surface and then formed cementite [Citation19].
Figure 3. Cross-sectional morphologies of the CPE treated steel at 360 V for 1 min (a), 380 V for 1 min (b), and 380 V for 3 min (c).
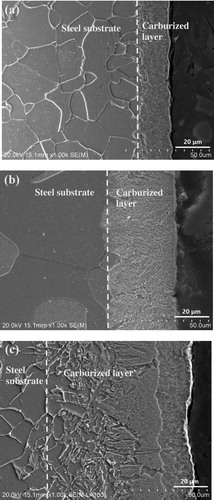
Figure 4. XRD patterns of the steel substrate and the CPE treated steels at 360 V for 1 min, 380 V for 1 min, and 380 V for 3 min.
The carburizing process for steel is based on the diffusion theory [Citation20,Citation21]. Since the thickness of carburized layer is far less than that of the steel sample, a one-dimensional diffusion model for the Fick’s second law can be used for the calculation of diffusion coefficient. Its error function solution is shown in Equation (1), where C is the carbon content in position x, Cs is the surface carbon content, C0 is the steel matrix carbon content, and D is the diffusion coefficient of carbon atoms, respectively. Take the sample treated by 380 V and 1 min discharge as an example. The C0 and Cs are 0.8 and 13.25 (wt.%), confirmed by energy dispersive spectroscopy (EDS). According to the relationship between diffusion distance (x) and carburizing time (t), as shown in Equation (2), the diffusion coefficient (D) is calculated to be 1.5 × 10⁻⁷ cm2 s−1 (x = 30 μm, t = 60 s). The uncertainty of D is among 10%, which is determined by EDS measurement accuracy. shows the diffusion coefficient comparison of PEC and traditional pack carburizing at the same temperature [Citation22]. It is clear that the diffusion coefficient of CPE process is one order of magnitude higher than that of the pack carburizing. Therefore, the carburizing efficiency of CPE method is much higher than the traditional methods.(1)
(1)
(2)
(2)
Table 1. Diffusion coefficient comparison of PEC and traditional pack carburizing at the same temperature.
Cathodic plasma electrolytic oxidation at high voltage
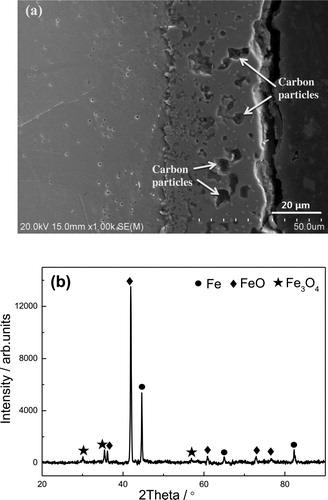
When the applied voltage continued to rise or the discharge time prolonged, however, the carburized layer would not grow unboundedly. In fact, the carburizing process was stopped and replaced by an oxidation process. (a) shows the cross-sectional micrographs of the CPE treated steel at 400 V for 5 min. The black regions embedded in the film are mainly carbon particles, confirmed by EDS analysis. Meanwhile, XRD analysis ((b)) shows that the main phase constitution of the film is FeO.
Figure 5. Cross-sectional morphology (a) and XRD analysis (b) of the CPE treated steel at 400 V for 5 min.
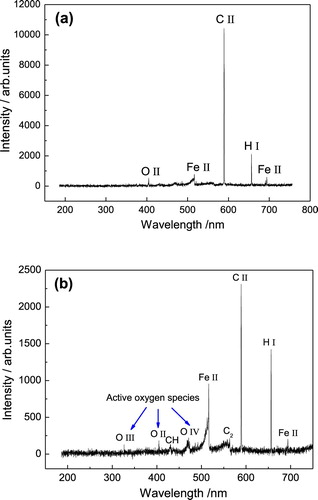
The OES analysis was employed to study the evolution of the carburized layer to the iron oxide layer. During the CPE process, glycerol molecules can be dissociated to some fragments through intense collision with high energy electrons [Citation23]. These fragments can be further decomposed to active carbon, hydrogen and oxygen species. Among them, the carbon species were accelerated by electric field to impinge the cathode surface and finally permeated into the tetrahedral or octahedral interstices of iron atoms lattice, forming a carburized layer. However, as the applied voltage rising, the activity of oxygen species increased significantly. (a,b) are the typical emission spectra of CPE process at carburizing voltage (380 V) and oxidation voltage (400 V), respectively. In (a), the H I refers to a neutral hydrogen atom, while the C II, Fe II and O II are singly ionized atoms. It indicates that active C, H, O, Fe atomic or ionic components have been involved in the discharge decomposition reactions of carburizing process. By contrast, there are more active oxygen ingredients in the emission spectrum under 400 V, as shown in (b). Hydrocarbons of C2 and CH are part of the intermediate products of glycerol decomposition. They were recorded by emission spectrum, while others were not due to their short lifespans. O III and O IV are the secondary and third ionization of oxygen atoms, which possess highly oxidative activity. They formed the oxygen-enriched environment which provided the possibility for oxidation reactions on steel, though it was set as cathode during the CPE process. Meanwhile, with the oxidation of iron atoms, a mass of carbon atoms were released from the interstitial sites and gradually aggregated into carbon particles embedded in the iron oxide film, as shown in (a).
Figure 6. (a) Typical emission spectrum of carburizing process at 380 V and (b) typical emission spectrum of oxidation process at 400 V.
Discussion
The main difference between plasma electrolysis process and conventional electrolysis is that the plasma electrolysis is accompanied by liquid phase plasma discharge phenomenon on the electrode surface. In this work, the OES method was employed for qualitative and quantitative analysis, and it worked like a sensor [Citation24,Citation25]. By monitoring the real-time OES signals during plasma discharge process, one can not only determine the type of active atom or ion species in the discharge zone, but also effectively evaluate the plasma characteristic parameters. Compared with the sample surface temperature, plasma electron temperature (Te) can reflect the plasma discharge condition more timely. Therefore, Te was calculated for further investigation of the plasma characteristics during the CPE process. In the local thermal equilibrium (LTE) state of plasma, the Te can be derived from Equation (3) [Citation26]. I1/I2 is spectrum line intensity ratio of the same atomic or ionic species. A1, g1, λ1, E1 and A2, g2, λ2, E2 are transition probability, statistical weight of upper level, wavelength and excitation energy of the two spectrum lines, respectively. In , Fe II (516.65 nm) and Fe II (697.57 nm) were selected to determine the Te. The parameters needed for calculation are shown in [Citation27]. The results show that Te of the carburizing process at 380 V is about 5000 K, while that of the oxidation process at 400 V is 11,000 K. The Te is a transient temperature of the plasma discharge region, and it can act as an indicator of the discharge intensity [Citation28,Citation29]. Therefore, the high transient temperature of oxidation process can facilitate the decomposition and oxidation reactions.(3)
(3) In summary, this work focuses on the cathode processes of plasma electrolysis in glycerol aqueous solution, combining the saturation and oxidation processes together on steel materials. shows the interfacial reactions and carbon evolution process. Through the intense plasma discharge near cathode surface, the glycerol molecules were dissociated to some fragments, such as ·CH2, ·CH and ·OH. They were further decomposed to active carbon, hydrogen and oxygen species. At a relatively low voltage, carbon species were accelerated and permeated into the iron lattice, forming a carburized layer, while at a relatively high voltage, oxygen species tended to be hyperactive and iron atoms were preferentially oxidized. As the oxidation continues, the carbon atoms were released from the interstitial sites and finally aggregated into carbon particles. As a result, a carbon-embedded oxide layer on the steel surface was formed.
Figure 7. Interfacial reactions and carbon evolution process during CPE on steel.
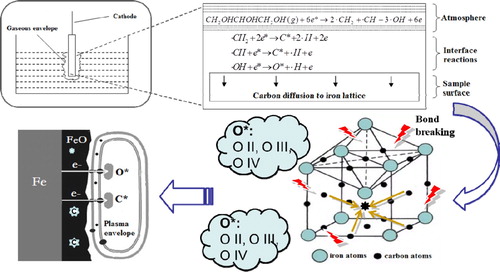
Table 2. Fe II lines with the wavelength λ, transition path, statistical weights of upper level g, excitation energy E and transition probability A.
Conclusions
During the CPE process, the steel surface temperature increased with the applied voltage. At the critical voltage, the gaseous envelope near the cathode was broken down, resulting in a significant increase of surface temperature. Meanwhile, the quenching process and ion bombardment gave rise to the grain refinement near the interface.
Above the critical voltage, the substantial carburizing process started. The carbon diffusion coefficient was much higher than that of the traditional carburizing at the same temperature. Through the plasma discharge near steel surface, the glycerol molecules were dissociated to plenty of active carbon, hydrogen and oxygen species. These active species would bombard the steel surface in the electric field and generate a large number of interfacial defects, like dislocations and grain boundaries, which can act as the fast diffused channels for carbon atoms.
With the voltage rising, the carburizing process would not last forever but be replaced by an oxidation process. At high voltage, the glycerol molecules were decomposed to generate many oxygen species with high activity, and the steel substrate was oxidized preferentially. Also, the high electron temperature up to 11,000 K facilitated the oxidation process.
Both carburizing and oxidation processes can occur on the steel cathode, and so is the case with the anode. The previous views of oxidation process on anode and saturation process on cathode during plasma electrolysis are not accurate. There is no impassable gulf between the electrodes for saturation and oxidation processes.
Disclosure statement
No potential conflict of interest was reported by the author(s).
Additional information
Funding
References
- Yerokhin AL, Nie X, Leyland A, et al. Plasma electrolysis for surface engineering. Surf Coat Technol. 1999;122:73–93. doi: 10.1016/S0257-8972(99)00441-7
- Rumbach P, Bartels DM, Sankaran RM, et al. The solvation of electrons by an atmospheric-pressure plasma. Nat Commun. 2015;6:7248. doi: 10.1038/ncomms8248
- Liu R, Wang B, Wu J, et al. Spectroscopic investigation of plasma electrolytic borocarburizing on q235 low-carbon steel. Appl Surf Sci. 2014;321:348–352. doi: 10.1016/j.apsusc.2014.10.026
- Wu J, Xue W, Jin X, et al. Preparation and characterization of diamond-like carbon/oxides composite film on carbon steel by cathodic plasma electrolysis. Appl Phys Lett. 2013;103:031905. doi: 10.1063/1.4813830
- Liu C, Zhao Y, Chen Y, et al. Surface modification of magnesium alloy via cathodic plasma electrolysis and its influence on corrosion resistance and cytocompatibility. Mater Lett. 2014;132:15–18. doi: 10.1016/j.matlet.2014.06.019
- Çavuşlu F, Usta M. Kinetics and mechanical study of plasma electrolytic carburizing for pure iron. Appl Surf Sci. 2011;257:4014–4020. doi: 10.1016/j.apsusc.2010.11.167
- Wang L, Jiang X. Plasma-induced reduction of chromium (VI) in an aqueous solution. Environ Sci Technol. 2008;42:8492–8497. doi: 10.1021/es8017286
- Gao J, Chen L, He YY, et al. Degradation of imidazolium-based ionic liquids in aqueous solution using plasma electrolysis. J Hazard Mater. 2014;265:261–270. doi: 10.1016/j.jhazmat.2013.11.060
- Wu J, Wang B, Zhang Y, et al. Enhanced wear and corrosion resistance of plasma electrolytic carburized layer on T8 carbon steel. Mater Chem Phys. 2016;171:50–56. doi: 10.1016/j.matchemphys.2015.09.047
- Li X, Han Y. Porous nanocrystalline Ti(CxN1-x) thick films by plasma electrolytic carbonitriding. Electrochem Commun. 2006;8:267–272. doi: 10.1016/j.elecom.2005.11.017
- Wu J, Zhang Y, Liu R, et al. Anti-corrosion layer prepared by plasma electrolytic carbonitriding on pure aluminum. Appl Surf Sci. 2015;347:673–678. doi: 10.1016/j.apsusc.2015.04.171
- Lin N, Xie R, Zhou P, et al. Review on improving wear and corrosion resistance of steels via plasma electrolytic saturation technology. Surf Rev Lett. 2016;23:1630002. doi: 10.1142/S0218625X16300021
- Parfenov EV, Yerokhin A, Nevyantseva RR, et al. Towards smart electrolytic plasma technologies: an overview of methodological approaches to process modeling. Surf Coat Technol. 2015;269:2–22. doi: 10.1016/j.surfcoat.2015.02.019
- Jin X, Wang B, Xue W, et al. Characterization of wear resistant coatings on 304 stainless steel fabricated by cathodic plasma electrolytic oxidation. Surf Coat Technol. 2013;236:22–28. doi: 10.1016/j.surfcoat.2013.04.056
- Wu J, Lu P, Dong L, et al. Combination of plasma electrolytic oxidation and pulsed laser deposition for preparation of corrosion-resisting composite film on zirconium alloys. Mater Lett. 2020;262:127080. doi: 10.1016/j.matlet.2019.127080
- Wu J, He X, Li G, et al. Rapid construction of TiO2/SiO2 composite film on Ti foil as lithium-ion battery anode by plasma discharge in solution. Appl Phys Lett. 2019;114:043903. doi: 10.1063/1.5083686
- Jauhari I, Rozali S, Masdek N, et al. Surface properties and activation energy analysis for superplastic carburizing of duplex stainless steel. Mater Sci Eng, A. 2007;466:230–234. doi: 10.1016/j.msea.2007.02.082
- Moelans N, Blanpain B, Wollants P. Pinning effect of second-phase particles on grain growth in polycrystalline films studied by 3-D phase field simulations. Acta Mater. 2007;55:2173–2182. doi: 10.1016/j.actamat.2006.11.018
- Wu J, Xue W, Wang B, et al. Characterization of carburized layer on T8 steel fabricated by cathodic plasma electrolysis. Surf Coat Technol. 2014;245:9–15. doi: 10.1016/j.surfcoat.2014.02.024
- Xu Y, Roques J, Domain C, et al. Carbon diffusion in bulk hcp zirconium: a multi-scale approach. J Nucl Mater. 2016;473:61–67. doi: 10.1016/j.jnucmat.2016.02.010
- Yang J, Park J, Kang J, et al. First-principles multiple-barrier diffusion theory: the case study of interstitial diffusion in CdTe. Phys Rev B. 2015;91:075202. doi: 10.1103/PhysRevB.91.075202
- Jiménez H, Staia MH, Puchi ES. Mathematical modeling of a carburizing process of a SAE 8620H steel. Surf Coat Technol. 1999;358:120–121.
- Yan Z, Deng L, Chen L. Cathodic plasma electrolysis in 1-propanol solutions for preparation of submicron diamond particles. Electrochim Acta. 2013;105:612–617. doi: 10.1016/j.electacta.2013.05.026
- Wang K, Liu G, Li Y, et al. Non-intrusive characterization of sand particles dispersed in gas-water bubbly flow using straight and bent pipes with vibration sensing. Powder Technol. 2019;344:598–610. doi: 10.1016/j.powtec.2018.12.053
- Wang K, Liu G, Li Y, et al. Identification and characterization of solids in sand-water two-phase flows via vibration multi-sensor approaches. Adv Powder Technol. 2019;30:2240–2250. doi: 10.1016/j.apt.2019.07.004
- Griem HR. Plasma spectroscopy. New York (NY) McGraw-Hill Book; 1964.
- http://physics.nist.gov/PhysRefData/ASD/lines_form.html.
- Hussein RO, Nie X, Northwood DO, et al. Spectroscopic study of electrolytic plasma and discharging behaviour during the plasma electrolytic oxidation (PEO) process. J Phys D: Appl Phys. 2010;43:105203. doi: 10.1088/0022-3727/43/10/105203
- Bagryansky PA, Shalashov AG, Gospodchikov ED, et al. Threefold increase of the bulk electron temperature of plasma discharges in a magnetic mirror device. Phys Rev Lett. 2015;114:205001. doi: 10.1103/PhysRevLett.114.205001