
 ?Mathematical formulae have been encoded as MathML and are displayed in this HTML version using MathJax in order to improve their display. Uncheck the box to turn MathJax off. This feature requires Javascript. Click on a formula to zoom.
ABSTRACT
Inequality in the spatial distribution of urban greenspaces occurs globally, with greater greenspaces in neighbourhoods with higher socioeconomic status. This is problematic, as greenspaces provide numerous ecosystem services, including benefits to human health. However, greenspaces can also trigger allergenic responses, inducing negative economic, medical, and social costs. Using geospatial information, we investigated 91 elementary schools in Vancouver, British Columbia, Canada to answer: (1) Does the amount and type of greenspaces and greyspaces surrounding schools vary with median household income? and (2) Does the surface area of allergenic greenspace surrounding schools vary with median household income? We characterized landcover within a 300 m radius of public elementary schools using a high spatial resolution urban landcover map of Vancouver derived from a combination of RapidEye imagery from 2014 and airborne laser scanning. Beta regression and analysis of variance models were used to explore associations between household incomes and greenspaces, as well as allergenic vegetation near schools. Schools in areas with higher median annual household incomes (>$80,000 CAD) were surrounded by an average of 14% more greenspaces and 16% less greyspaces than schools located in areas with lower household incomes (<$50,000 CAD). Schools in higher income areas were also surrounded by an average of 81% more cover of allergenic vegetation than schools in lower income areas. Greenspaces are a valuable source of ecosystem services for urban residents and should be distributed equally to optimize their benefits; however, they must be planned carefully to avoid the introduction of disservices from allergenic vegetation.
EDITED BY:
Introduction
Urban greenspaces provide a multitude of ecological benefits, including mitigating climate change (Kleinman and Geiger Citation2002), reducing air pollution (Beckett et al. Citation2000; Kleinman and Geiger Citation2002; Dzierzanowski et al. Citation2011; Nowak et al. Citation2018), limiting the effects of urban heat islands (Doick et al. Citation2014) by maintaining cooler urban microclimates (Myrup Citation1969; Oke Citation1982; Mallen et al. Citation2020), protecting urban stream water quality (Yang et al. Citation2015; Vilhar Citation2017; Ruan et al. Citation2019), and providing habitat for urban biodiversity (Idilfitri et al. Citation2014). Urban greenspaces can include urban street trees, parks, shrubs and grassy areas, as well as forests. Urban greenspaces also provide a variety of ecosystem services with human health benefits (Pretty et al. Citation2005; Sanesi et al. Citation2006; Park et al. Citation2011; Barton et al. Citation2012; Villeneuve et al. Citation2012; Paciência et al. Citation2020). An ecosystem service is any benefit provided by an ecosystem that holds anthropogenic societal value (Daily Citation1997). The presence of urban greenspaces has been linked to multiple human health benefits, and thus, a higher quality of life (Latinopoulos et al. Citation2016; Livesley et al. Citation2016).
The health benefits of greenspaces for urban residents include support for both mental and physical health for adults as well as children. For example, exposure to greenspaces has been linked to improved psychological well-being through stress reduction (Grahn and Stigsdotter Citation2003; Sanesi et al. Citation2006), relaxation (Park et al. Citation2011), and alleviation of anxiety and depression symptoms (Ellaway et al. Citation2009; Barton et al. Citation2012; Berman et al. Citation2012; Kearns et al. Citation2012). Additionally, exposure to forested areas is associated with physiological benefits, such as lower blood pressure and heart rate (Pretty et al. Citation2005; Villeneuve et al. Citation2012). Furthermore, greenspace accessibility is associated with numerous positive impacts on the well-being of children. For example, natural playscapes encourage enhanced physical activity (Dyment and Bell Citation2008), motor development (Fjørtoft Citation2004), and creativity (Herrington and Studtmann Citation1998; Tranter and Malone Citation2004; Dyment and Bell Citation2008). For children with attention deficit disorder, greenspace exposure can reduce attention deficit disorder symptoms (Taylor et al. Citation2001). Greenspaces surrounding schools can impact students’ respiratory health, improving lung function (Paciência et al. Citation2019) and lung inflammation (Paciência et al. Citation2020). Lastly, even after controlling for socioeconomic factors, schoolyard canopy cover has been positively associated with academic performance (Sivarajah et al. Citation2018). In 2010 alone, urban trees throughout 86 Canadian cities are estimated to have produced human health benefits valued at 227.2 million Canadian dollars (Nowak et al. Citation2018).
Despite providing invaluable ecosystem services, urban greenspaces can also be a source of disservices, such as allergic reactions. Ecosystem disservices are functions of ecosystems that negatively impact human-wellbeing (Lyytimäki and Sipilä Citation2009). Urban greenspaces are among the primary sources of airborne pollen in urban areas (Cariñanos et al. Citation2016). When composed of allergenic species, greenspaces can produce economic, medical, and social costs. In the United States of America, estimated medical costs of allergic rhinitis (aka hay fever) range from 1.6 to 4.9 billion United States dollars per annum (Reed et al. Citation2004). Taking into account the indirect costs of allergic rhinitis, such as loss of productivity, missed workdays, or even premature retirement, the financial costs of allergenic urban greenspaces are even greater (Reed et al. Citation2004). Urban tree canopy coverage has been associated with asthma and allergic sensitization of children (Lovasi et al. Citation2013). Dense street trees can disrupt air circulation, reducing the dispersion of allergenic pollen (Lõhmus and Balbus Citation2015), furthering allergenic responses. Collectively, the allergenic responses incited by urban greenspaces can have significant negative impacts on quality of life (Von Döhren and Haase Citation2015).
It is widely acknowledged that urban residents may not have equal access or exposure to greenspace. Globally, socioeconomic factors are associated with access (Erkip Citation1997; Weiss et al. Citation2011; Nesbitt andMeitner Citation2016) and exposure (Heynen and Lindsey Citation2003; Landry and Chakraborty Citation2009; McConnachie and Shackleton Citation2010) to urban greenspaces. Public greenspaces are often located in higher-income areas (Poudyal et al. Citation2009; McConnachie and Shackleton Citation2010; Nesbitt andMeitner Citation2016), as is greater canopy cover (Landry and Chakraborty Citation2009; McConnachie and Shackleton Citation2010). Plant diversity can also vary with socioeconomic status and is greater in higher-income areas (Hope et al. Citation2003; Martin et al. Citation2004; Bigirimana et al. Citation2012; Clarke et al. Citation2013; Avolio et al. Citation2015; Wang et al. Citation2015). While multiple studies have investigated the relationship between socioeconomic status, greenspace inequality, and the ecosystem services provided by greenspace, few studies have examined the relationship between socioeconomic status and ecosystem disservices (Nguyen et al. Citation2021; Dobbs et al. Citation2014; Liu et al. Citation2018). Examining the differences in greenspaces among neighbourhoods, the allergenic vegetation in greenspaces, and their association with socioeconomic factors requires further exploration in order to enable mitigation of inequalities in both the benefits and potential drawbacks of urban greenspaces.
This study examined the quantity, type, allergenic surface area, and inequality of greenspaces in the City of Vancouver, British Columbia, Canada. As the availability of greenspaces can have numerous benefits for children, while also posing allergenic risks, we focus on greenspaces surrounding elementary schools (Herrington and Studtmann Citation1998; Taylor et al. Citation2001; Fjørtoft Citation2004; Tranter and Malone Citation2004; Dyment and Bell Citation2008; Cariñanos et al. Citation2016; Sivarajah et al. Citation2018). We answered two primary research questions: (1) Does the amount and type of greenspaces and greyspaces surrounding schools vary with median household income? and (2) Does the surface area of allergenic greenspace surrounding schools vary with median household income? To do so, we first characterized greenspace quantity and type within 300 m of public elementary schools in the City of Vancouver using a high spatial resolution land cover map. We distinguish greenspace features such as woody vegetation cover and herbaceous vegetation, as well as greyspaces (human-constructed impervious surfaces such as pavement). To estimate the surface area of allergenic greenspace, we integrated land cover data with a street tree database to quantify the surface area occupied by allergenic species. Finally, to examine inequality, we determined whether the quantity, type, and allergenic surface area of greenspaces surrounding schools varied with median annual incomes of neighbourhood households.
Materials & methods
Greenspaces and allergenic vegetation surrounding 91 elementary schools in the City of Vancouver, British Columbia, Canada were investigated using a geographic information system (GIS) (ArcMap version 10.6.1). We characterized the amount of green- and greyspace, as well as woody vegetation and grass cover, within a 300 m radius of public elementary schools. To estimate the surface area of allergenic greenspace, 13 allergenic tree species and grass cover were considered. This information was merged with information on median household income to explore relationships between greenspace and socioeconomic status.
Study site
The third largest city in Canada, the City of Vancouver is home to over 600,000 residents (City of Vancouver Citation2016) occupying densely urbanized areas as well as lower-density areas with single-family homes. The city contains a diversity of urban greenspace types including 230+ public parks covering just over 10% of the city (Vancouver Board of Parks and Education Citation2018a, Citation2018b). The City of Vancouver is working towards a goal of ensuring each resident lives within a 5-minute walk of greenspace (City of Vancouver Citation2015). Planted trees lining Vancouver’s streets consist of both native and non-native species (City of Vancouver Citation2012).
The City of Vancouver has 91 school catchment zones encompassing 194 traditional and alternative public and/or independent schools. We only evaluated public schools accessible at no extra cost to residents and therefore excluded schools requiring attendance fees. Secondary schools were also excluded from our analysis due to their very small sample size. As a result, a total of 91 traditional and alternative public elementary schools (located throughout 73 elementary school catchment zones) were included in our analysis and then geo-located using Provincial geospatial data (BC Ministry of Education Citation2009).
Characterizing greenspace quantity and type surrounding schools
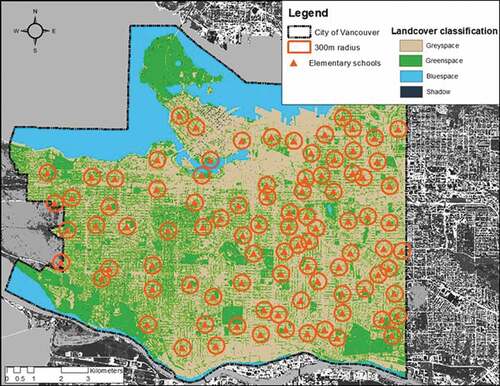
As the 91 selected schools did not exhibit one-to-one correspondence with catchment zones, our analysis required a different unit of analysis than catchment boundaries. Therefore, we evaluated greenspaces within a 300 m circular radius of each elementary school () as this distance suitably balanced World Health Organization (WHO) general recommendations for greenspace with geospatial considerations specific to Vancouver. More specifically, the WHO recommends a minimum of 2 hectares (ha) of accessible greenspaces within 300 m of a home in order for a person to reap benefits provided by greenspace (WHO Regional Office for Europe Citation2016). Thus, we used a 300 m radius surrounding schools to account for this recommendation when quantifying green- and greyspaces surrounding schools. Furthermore, evaluating a distance larger than 300 m would have resulted in substantial overlap (or double-counting) of the greenspace amongst neighboring schools. However, a 300 m radius was effective in minimizing overlap as most schools were located 600 m (or more) apart.
Figure 1. City of Vancouver showing the distribution of elementary schools, landcover classes, and 300 m circular radii around each school within which greenspace was assessed
We characterized landcover using an urban landcover map of the City of Vancouver derived from a combination of RapidEye high-spatial-resolution imagery from 2014 and airborne laser scanning (ALS) data, described further in Williams et al. (Citation2018). The first of its kind to provide continuous coverage of the Greater Metropolitan Vancouver region, its high spatial resolution (2 m) allowed for accurate classification of landcover as well as fine-scale forest canopies and houses (Williams et al. Citation2018). Williams’ map consisted of 12 urban landcover classes: ‘buildings’, ‘paved’, ‘other built’, ‘barren’, ‘soil’, ‘coniferous’, ‘broadleaf’, ‘shrub’, ‘grass/herb’, ‘non-photosynthetic vegetation’, ‘water’, and ‘shadow’ mapped with a high accuracy of 88% (kappa 0.87) (Williams et al. Citation2018).
We distinguished and simplified two general classes from the Williams et al. (Citation2018) landcover map: ‘greenspaces’ and ‘greyspaces’ (). Greenspaces have health and environmental benefits, while most greyspaces generally lack such benefits (Heidt and Neef Citation2008; Zhou and Parves Rana Citation2012; Ziter et al. Citation2019). Greenspaces consisted of ‘coniferous’, ‘broadleaf’, ‘shrub’, ‘grass/herb’, and ‘non-photosynthetic vegetation’ cover classes. We included non-photosynthetic vegetation (despite it being dead or dying at the time of image capture) because it may reflect seasonal patterns of senescence in areas otherwise green at different times of year. Within our greenspaces category we further distinguished woody vegetation cover (consisting of ‘coniferous, broadleaf’, and ‘shrub’) and grass cover (consisting of ‘grass/herb’) to enable further exploration of greenspace types relative to socioeconomic status. Greyspaces included areas mapped as ‘buildings’, ‘paved’, ‘other built’, ‘barren’, and ‘soil’. ‘Bluespace,’ consisting of the ‘water’ land cover class, was very limited near schools and was excluded from our analysis. The ‘shadow’ cover class, consisting of land obscured by shadows at the time of spatial data acquisition, was also excluded, as it masked landcover classes. Using this reclassification, percent cover of greenspace and greyspace were calculated within a 300 m circular radius of each school () using ArcGIS, along with the percent cover of woody vegetation and grass. It is important to note that this map was found to have misclassified some individual street trees as ‘paved’. As a result, total greenspace and woody vegetation cover may have been underestimated in this study.
Estimating the surface area of potentially allergenic greenspace surrounding schools
Next, we determined the surface area of potentially allergenic trees and grass cover within these same 300 m radii for each school. The Aerobiology Research Laboratories recorded pollen and spore counts at multiple stations throughout Canada. Based on their atmospheric pollen counts, the majority of Vancouver’s allergenic pollen comes from 13 genera of trees. These include: alder (Alnus sp.), beech (specifically Fagus sylvatica and F. grandifolia), birch (Betula sp.), elm (Ulmus sp.), hazel (Corylus sp.), hemlock (Tsuga sp.), larch and tamarack (Larix sp.), maple and box elder (Acer sp.), oak (Quercus sp.), pine (Pinus sp.), fir (Abies sp.), spruce (Picea sp.), and poplar, cottonwood, and aspen (Populus sp.). These genera can incite allergenic responses in humans (Florvaag et al. Citation1982; Lin et al. Citation2002; May Citation2000; Räsänen et al. Citation1992; Dales et al. Citation2008; Akcakaya et al. Citation2005; Schwartz and Weiss Citation1995; Calabria and Dice Citation2007). The street tree inventory of Vancouver includes information on species, location, and size (height and diameter at breast height) for all 44,976 trees on public boulevards (but not those in parks or on private property) (City of Vancouver Citation2012). This geo-referenced dataset was used to identify and map the location and size of individual allergenic trees. Originally created in 2012, locational coordinates were added in 2016, and the dataset is updated on a weekly basis. The assessment of allergenic tree surface area was completed using only this street tree inventory, as the aforementioned high-resolution urban landcover map was shown to misclassify approximately 26% of street trees as ‘paved’ surfaces.
After mapping potentially allergenic vegetation, we determined its surface area. The surface area of vegetation is helpful in reflecting that the amount of airborne allergenic pollen produced by trees is proportional to the size of the individual tree (Cariñanos et al. Citation2014). That is, trees with larger crowns tend to have more flowers, and therefore produce more pollen (Molina et al. Citation1996; Friedman Citation2009). Our approach was a hybrid of methods used in previous research in which allergenic land cover was quantified and mapped (McInnes et al. Citation2017), and in which actual allergenicity was estimated using species-specific traits such as surface area, the magnitude of pollen emissions, and pollen emission duration (Cariñanos et al. Citation2014). Similar to McInnes et al. (Citation2017), we mapped the location of allergenic vegetation across our study region. We then went a step further by implementing species-specific allometric equations to include species-specific sizes in our calculation of allergenic surface area. Thus, our hybrid approach improves upon the detail used in previous research, while accommodating cities in need of a less expensive, less ‘data-intensive’ pollen field monitoring approach. To calculate the surface area of allergenic trees, we used species-specific allometric equations developed for urban trees (McPherson et al. Citation2016). These equations used diameter at breast height (DBH) measurements from the Vancouver street tree inventory (City of Vancouver Citation2012) to estimate the crown diameters and live crown lengths (defined as the distance from the live crown base to the top of the tree). Live crown length and diameter were then used to estimate crown surface area, assuming cylindrical tree crowns (Cariñanos et al. Citation2014), using Equation (1):
where r is equal to the crown diameter (m) divided by two (i.e. crown radius), and h is equal to live crown length (m). For species lacking an allometric equation, an equation for another species with a similar morphotype was applied.
We further determined the areal extent of grass cover surrounding each school as many Poaceae spp. are allergenic (McInnes et al. Citation2017). In fact, across Europe, grass pollen has been listed as the most important pollen allergen, due to its sizable spatial distribution and high sensitisation rates (Burbach et al. Citation2009; Skjøth et al. Citation2012; Latinopoulos Citation2016; McInnes et al. Citation2017). Vancouver grass cover was determined using the urban land cover map by Williams et al. (Citation2018). Mapping of grass cover was deemed sufficient (i.e. species were not distinguished), as grass pollen monitoring does not usually differentiate by species due to similarities in appearance (Skjøth et al. Citation2013; McInnes et al. Citation2017). Thus, the surface area of potentially allergenic greenspace within each 300 m radius included the sum of the area covered by grass (from the land cover map by Williams et al. Citation2018) and the surface area of allergenic tree crowns (from the Vancouver street tree inventory dataset). It is important to note that this approach only enabled calculation of the surface area of grass and the 13 genera of trees mentioned above. This approach likely resulted in an overall underestimation of the surface area of allergenic vegetation. Furthermore, it is important to note that grasses and trees may not produce an equal amount of pollen or be equally allergenic. Through summing the surface area of allergenic trees and grass, we do not estimate allergenicity but rather the surface area of allergenic vegetation.
We assumed all individuals of dioecious tree species (such as Acer sp., Populus sp.) were male, and thus allergenic (as female individuals do not produce pollen). While this potentially overestimated the surface area of allergenic vegetation, it is routine in urban horticulture to plant male trees to avoid untidy droppings from fruit and berry production (Cariñanos and Casares-Porcel Citation2011). Such dioecious species represented 70% of all trees in our dataset.
Investigating greenspace inequality
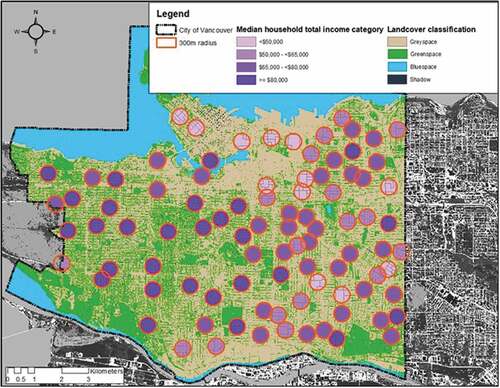
To capture socioeconomic spatial patterns, we used estimates of 2018 median annual household income for each of Vancouver’s 993 dissemination areas (SimplyAnalytics Citation2018). A dissemination area is the smallest standard geographic area for census data in Canada. Vancouver’s annual household incomes ranged from just under 14,000 CAD to more than 825,000 CAD. An area-weighted average of the median household income was calculated for the 300 m circular radius around each school to provide an indication of household incomes for families likely to send children to a given school (). This area-weighted average helped capture the range of incomes of the multiple adjacent dissemination areas near each school while ensuring the sampling unit for incomes corresponded with our greenspace measures. The median household income data were highly skewed, and the few observations with very large values were difficult to incorporate into models where median household income was treated as a continuous variable. Thus, the median household incomes were then assigned to income categories of Statistics Canada () (Statistics Canada Citation2016). Using income categories also ensured that our results were commensurate and comparable with other research that uses these same categories to examine differences in health, mental health, and invasive species in Vancouver, specifically, and Canada more broadly (Nguyen et al. Citation2021).
Table 1. Statistics Canada’s categorical classification of median annual household incomes. For this study, we determined the area-weighted average of median household incomes within 300 m radii surrounding 91 elementary schools (Figure 2)
Figure 2. City of Vancouver landcover classes and area-weighted averages of median household income within 300 m radii of public elementary schools (darker colours indicate higher income)
Statistical analyses: investigating the relationship between the median household income and the amount and type of greenspaces and greyspaces surrounding schools
We compared the percentages of different landcover types among four income categories () by fitting a beta regression model (Ferrari and Cribari-Neto Citation2004) to the landcover variables using the ‘betareg’ package (Cribari-Neto and Zeileis Citation2010), with a ‘logit’ link function. A likelihood ratio test (Neyman and Pearson Citation1967) was then conducted to determine the significance of income on the amount of landcover, followed by pairwise comparisons with the Bonferroni correction for multiple comparisons (Bonferroni Citation1936; Dunn Citation1961).
Statistical analyses: investigating the relationship between median household income and the surface area of allergenic greenspace surrounding schools
The relationship between the four median household income levels () and the surface area of allergenic greenspace was investigated using a one-way ANOVA, followed by pairwise comparisons with the Bonferroni correction for multiple comparisons (Bonferroni Citation1936; Dunn Citation1961). The surface area of allergenic greenspace was then modelled as a function of median household income level, as well as one additional explanatory variable: greenspace cover, woody vegetation cover, or grass cover. This was done in order to test whether median household income would be a significant variable in the model once the amount of greenspace was accounted for. For all analyses, surface area of allergenic greenspace was log-transformed to achieve normality and homogeneity of variance across median household income levels.
All statistical analyses were completed with R 3.6.1 (R Core Team Citation2019). For the purpose of data visualization, mean and standard error values were calculated using the ‘plotrix’ package (Lemon Citation2006).
Results
Does the amount and type of greenspaces and greyspaces surrounding schools vary with median household income?
Greenspace cover surrounding each school differed significantly with median household income (p < 0.001). Mean percent greenspace surrounding high income schools was significantly greater than that of medium-high (p < 0.001), medium-low (p < 0.001), and low income schools (p < 0.001) (). The percent greenspace in the three lower median household income categories were not significantly different from each other (p > 0.05) ().
Figure 3. Boxplots illustrating outliers, median, minimum, and maximum amounts of greenspace cover (panel A), grass cover (panel B), woody vegetation cover (panel C), and greyspace cover (panel D) within 300 m of elementary schools, classified according to income categories (n = 12 low; n = 17 medium-low; n = 34 medium-high; n = 28 high income). Letters denote income categories with significantly different (p < 0.05) percentages of landcover
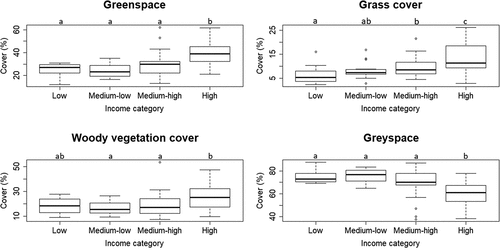
Grass cover differed significantly with median household income (p < 0.001). Mean percent grass cover surrounding high income schools was greater than that of medium-high (p < 0.01), medium-low (p < 0.001), and low income schools (p < 0.001) (). Mean percent grass cover surrounding medium-high income schools was significantly higher than grass cover surrounding low income schools (p < 0.01) (). There were no significant differences between percent grass cover surrounding low and medium-low income schools (p > 0.05), or medium-low and medium-high income schools (p > 0.05) ().
Woody vegetation cover differed significantly with median household income (p < 0.01). Specifically, percent woody vegetation cover surrounding high income schools was significantly higher than the woody vegetation cover surrounding medium-low income schools (p < 0.01) and medium-high income schools (p < 0.01) (). However, no significant differences were detected between the percent woody vegetation cover surrounding low income schools and any other income category (p > 0.05), or the medium-high income schools and medium-low income schools (p > 0.05) ().
Greyspace cover differed significantly with median household income (p < 0.001). Specifically, percent greyspace surrounding high income schools was significantly lower than medium-high (p < 0.001), medium-low (p < 0.001), and low income schools (p < 0.001) (). Percent greyspace did not differ among the three lower income categories (p > 0.05) ().
Does the surface area of allergenic greenspace surrounding schools vary with median household income?
In the model using only median household income as an explanatory variable, the surface area of allergenic greenspace surrounding high income schools was significantly greater than that surrounding schools in medium-high (p < 0.05), medium-low (p < 0.05), and low income neighborhoods (p < 0.01) (). There were no significant differences between the surface area of allergenic greenspace surrounding schools in low, medium-low, and medium-high income neighborhoods (p > 0.05) ().
Figure 4. Mean surface area (m2) of allergenic vegetation ± SEM within 300 m surrounding elementary schools, by household income categories (n = 12 low; n = 17 medium-low; n = 34 medium-high; n = 28 high income). Letters denote significant differences (p < 0.05). Surface area of allergenic vegetation was derived using crown surface area of street trees combined with grass cover
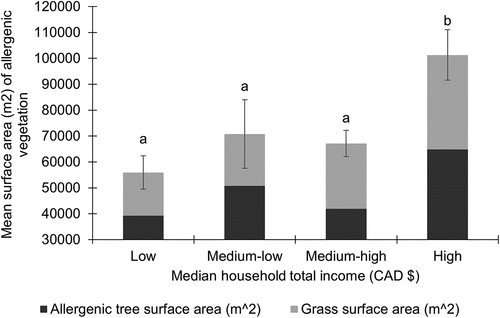
After accounting for total greenspace in the model, surface area was no longer significantly different among household income levels (p > 0.05). When including either grass cover or woody vegetation cover as an explanatory variable, differences in surface area of allergenic greenspace remained significant (p < 0.05) among household income levels.
Discussion
Urban greenspaces are important to urban planning due to a growing understanding of the social, economic, environmental, and health benefits they provide. Here, we examined the type, quantity, allergenic surface area, and inequality of greenspaces surrounding elementary schools in Vancouver, BC, Canada. We found greenspace inequality to be widespread among Vancouver’s elementary schools; schools in the highest household income category were surrounded by an average of 14% more greenspace and 16% less greyspace than schools in the lowest income category (). Not only can children obtain health benefits and improved academic performance when surrounded by greenspace, but children situated in lower socioeconomic areas derive greater benefits per unit greenspace than children in higher socioeconomic areas (Kabisch et al. Citation2016; Sivarajah et al. Citation2018). However, because ecosystem disservices associated with greenspaces, such as allergenicity, are often overlooked, we further examined patterns of potentially allergenic vegetation. We found high income schools to be surrounded by 81% more surface area of allergenic vegetation cover than schools in lower income categories (). Both the ecosystem services and disservices provided by greenspaces should be considered in order to better integrate urban greenspaces into urban planning and maximise positive impacts.
Does the amount and type of greenspaces and greyspaces surrounding schools vary with median household incomes?
We determined that schools located in areas with median annual household incomes over 80,000 CAD were surrounded by significantly higher amounts of greenspace and significantly less greyspace than schools in other income categories. This evidence is congruent with other reported general trends in greenspace inequality across Vancouver neighbourhoods of different socioeconomic status (Melles Citation2005); however, prior studies have never examined Vancouver’s greenspace inequality in relation to elementary schools. As children spend a substantial portion of time at or within close proximity to their school, greenspace surrounding schools may be important in conferring the benefits of greenspaces to children. Improving greenspaces surrounding schools may be a centralized way to ameliorate health and academic disadvantages faced by children from lower income households who otherwise disproportionately lack exposure to greenspace and its attendant benefits (Taylor et al. Citation2001; Fjørtoft Citation2004; Dyment and Bell Citation2008; Kabisch et al. Citation2016; Sivarajah et al. Citation2018).
When distinguishing among different types of vegetation within greenspaces, woody vegetation cover was lowest around Vancouver schools in the intermediate income categories. In cities such as Atlanta, Georgia, and Indianapolis, Indiana, street greenery increased with household income, thus, tree planting projects occurred more frequently in low income areas (Watkins et al. Citation2017). Such an emphasis for tree planting (counteracting greenspace inequality) is one possible explanation for why Vancouver’s woody vegetation in lower income areas exceed that of middle income locations. Additionally, patterns in other factors, such as ethnicity or race, may also correspond to distribution patterns of street trees (Watkins et al. Citation2017). For example, in Tampa, Florida, the cover of street trees decreased in neighbourhoods as the proportion of African-American residents increased (Landry and Chakraborty Citation2009).
Older neighbourhoods can exhibit more advanced vegetation growth and more mature street trees (Melles Citation2005). Previous research in Vancouver has found no generalizable relationship between the spatial distribution of large trees and neighbourhood age, defying this expectation. Thus, Vancouver’s woody vegetation cover pattern could indicate the role of other factors besides socioeconomic characteristics and neighbourhood age. Thus, the drivers of greenspace inequality in Vancouver requires further investigation.
Does the surface area of allergenic greenspace surrounding schools vary with median household income?
Schools in the highest income category were surrounded by a greater surface area of allergenic vegetation than schools in lower income categories. This finding was not surprising (as greenspace was also the greatest in the same high income category), and is concordant with patterns observed in other cities. For example, higher species diversity in planted urban assemblages is associated with a greater abundance of allergenic species (Thompson and Thompson Citation2003), and species diversity in greenspaces is positively associated with income in at least 7 cities across 4 continents (Hope et al. Citation2003; Martin et al. Citation2004; Bigirimana et al. Citation2012; Clarke et al. Citation2013; Wang et al. Citation2015; Avolio et al. Citation2015; Leong et al. Citation2018). Thus, it is possible that higher species diversity is driving the greater allergenic surface area found in Vancouver’s highest income areas. Our results also showed that neither grass nor woody cover was driving the patterns in allergenic vegetation among income classes. While urban greenspaces provide many societal benefits, the choice of species is critical in reducing allergenic disservices. Our results suggest that greater amounts of beneficial ecosystem services, as well as disservices, may be produced by greenspaces in neighbourhoods of higher socioeconomic status.
Future research
We were unable to estimate the surface area of allergenic vegetation in parks and on private property with the exception of grass. Thus, our estimates are likely to be most accurate in neighbourhoods without substantial park or backyard areas (such as areas of high-density housing, etc.). Conversely, allergenic surface area in neighbourhoods with large or abundant trees (in parks or on private properties) could have been underestimated. Additional information and further analyses are needed to determine if the relationship between the amount of allergenic surface area and median household income observed in this study holds true when including trees located in parks or on private property.
Our calculations of the surface area of allergenic vegetation do not consider many processes and characteristics which influence allergenicity of greenspaces, including traits of individual species. The inherent allergenic potential of a particular species is important (Cariñanos et al. Citation2014). Species with inherently high allergenic potential have pollen which provokes a high rate of allergic sensitization in the population of a specified study area. Additionally, the pollen emission strategy of species can be influential. Species pollinated by insects are often less allergenic than wind-pollinated species; while female individuals of dioecious species are not at all allergenic (Cariñanos et al. Citation2014). Species with longer pollination periods will produce greater pollen emissions, resulting in prolonged allergic symptoms, and consequently, higher allergenicity (Cariñanos et al. Citation2014). And lastly, the species-specific phenology of species affects the seasonal patterns of pollen emissions (Cebrino et al. Citation2016).
In addition to species-level characteristics, climate influences allergenicity of greenspaces by influencing pollen production, emission, and dispersal. Higher temperatures and lower relative humidity conditions promote pollen emission (Franchi et al. Citation2007; Rojo et al. Citation2015; García-Mozo et al. Citation2016), thus increasing allergenicity. Rainfall preceding pollen emissions can enhance allergenicity by increasing the duration of pollen season (García-Mozo et al. Citation2016); while precipitation following pollen emission can reduce atmospheric transport of pollen (Mcdonald Citation1962; Latorre Citation1999). Additionally, the presence of waterbodies reduces the likelihood of pollen resuspension into the atmosphere once it lands (Allen and Dark Citation2008). Pollen dispersal can also be influenced by the building downwash effect, which occurs when tall buildings impede airflow resulting in the localized accumulation of airborne pollutants close to the ground (Thompson Citation1993). Thus, future research should include climate, land cover, and individual species characteristics and seasonal trends to more fully characterize the allergenicity of urban greenspaces.
Conclusions
Urban greenspaces provide an array of valuable ecosystem services. Our Vancouver results show that commonly used measurements of greenspace exposure (measures which are widely linked to a variety of associated human health benefits) differ with neighbourhood household income. Children, as a vulnerable population, can greatly benefit from the availability of greenspace, with those of lower socioeconomic means experiencing greater positive effects than those of greater socioeconomic means (Sivarajah et al. Citation2018). However, as greenspaces become an important aspect of urban planning, provisioning of ecosystem disservices is often overlooked. As our results also showed an increase in the surface area of allergenic vegetation with greater greenspace, greenspaces must be planned and managed carefully to avoid the introduction of allergenic disservices.
Overall, allergenicity of urban areas will likely increase as the effects of climate change progress. Rising concentrations of atmospheric carbon dioxide are expected to increase rates of pollen production in Europe, North America, Australia, and Asia (Takaro et al. Citation2013). Moreover, as temperatures rise – with spring beginning earlier and the growing season becoming longer – the pollen-production period will also lengthen, likely resulting in increased pollen concentrations in the air (Takaro et al. Citation2013). Therefore, it is crucial to note that while urban greenspaces can be implemented as a mitigation strategy for some effects of climate change, they can also lead to allergenic repercussions and subsequent health and social consequences if planned without care.
Acknowledgments
We would also like to thank Dr. Matilda van den Bosch for providing inspiration, and Catherine Moreau, HyunGu Kang, and Dr. Yuhao (Bean) Lu for their advice and support.
Disclosure statement
No potential conflict of interest was reported by the author(s).
Data availability statement
The data that supports the findings of this study are available in the City of Vancouver Open Data Portal at: https://opendata.vancouver.ca/pages/home/.
Additional information
Funding
References
- Akcakaya N, Cokugras H, Camcioglu Y, Ozdemir M. 2005. Skin test hypersensitivity for childhood asthma in Istanbul during a period of 16 years. Allergologia et Immunopathologia. 33(1):15–19. doi:10.1157/13070603.
- Allen JRL, Dark P. 2008. Seasonality of modern pollen and sediment deposition in an estuarine context: the Severn Estuary Levels, southwest England. J Quat Sci. 23(3):213–228. doi:10.1002/jqs.1138.
- Avolio ML, Pataki DE, Gillespie TW, Jenerette GD, McCarthy HR, Pincetl S, Clarke LW. 2015. Tree diversity in southern California’s urban forest: the interacting roles of social and environmental variables. Front Ecol Evol. 3(JUL). doi:10.3389/fevo.2015.00073.
- Barton J, Griffin M, Pretty J. 2012. Exercise-, nature- and socially interactive-based initiatives improve mood and self-esteem in the clinical population. Perspect Public Health. 132(2):89–96. doi:10.1177/1757913910393862.
- BC Ministry of Education. 2009. Schools. City of Vancouver Open Data Portal. https://opendata.vancouver.ca/explore/dataset/schools/information.
- Beckett KP, Freer-Smith PH, Taylor G. 2000. Particulate pollution capture by urban trees: effect of species and windspeed. Glob Chang Biol. 6(8):995–1003. doi:10.1046/j.1365-2486.2000.00376.x.
- Berman MG, Kross E, Krpan KM, Askren MK, Burson A, Deldin PJ, Kaplan S, Sherdell L, Gotlib IH, Jonides J, et al. 2012. Interacting with nature improves cognition and affect for individuals with depression. J Affect Disord. 140(3):300–305. doi:10.1016/j.jad.2012.03.012.
- Bigirimana J, Bogaert J, De Cannière C, Bigendako MJ, Parmentier I. 2012. Domestic garden plant diversity in Bujumbura, Burundi: role of the socio-economical status of the neighbourhood and alien species invasion risk. Landsc Urban Plan. 107(2):118–126. doi:10.1016/j.landurbplan.2012.05.008.
- Bonferroni CE. 1936. Teoria statistica delle classi e calcolo delle probabilità. Pubblicazioni Del R Istituto Superiore Di Scienze Economiche e Commerciali Di Firenze. 8:3–62.
- Burbach GJ, Heinzerling LM, Edenharter G, Bachert C, Bindslev-Jensen C, Bonini S, Bousquet J, Bousquet-Rouanet L, Bousquet PJ, Bresciani M, et al. 2009. GA2 LEN skin test study II: clinical relevance of inhalant allergen sensitizations in Europe. Allergy: Europ J Allergy Clin Immunol. 64(10):1507–1515. doi:10.1111/j.1398-9995.2009.02089.x.
- Calabria CW, Dice J. 2007. Aeroallergen sensitization rates in military children with rhinitis symptoms. Annals Allergy, Asthma Immunol. 99(2):161–169. doi:10.1016/S1081-1206(10)60640-0.
- Cariñanos P, Adinolfi C, Díaz De La Guardia C, De Linares C, Casares-Porcel M. 2016. Characterization of allergen emission sources in urban areas. J Environ Qual. 45(1):244–252. doi:10.2134/jeq2015.02.0075.
- Cariñanos P, Casares-Porcel M. 2011. Urban green zones and related pollen allergy: a review. Some guidelines for designing spaces with low allergy impact. Landsc Urban Plan. 101(3):205–214. doi:10.1016/j.landurbplan.2011.03.006.
- Cariñanos P, Casares-Porcel M, Quesada-Rubio JM. 2014. Estimating the allergenic potential of urban green spaces: a case-study in Granada, Spain. Landsc Urban Plan. 123:134–144. doi:10.1016/j.landurbplan.2013.12.009.
- Cebrino J, Galán C, Domínguez-Vilches E. 2016. Aerobiological and phenological study of the main Poaceae species in Córdoba city (Spain) and the surrounding hills. Aerobiologia. 32(4):595–606. doi:10.1007/s10453-016-9434-6.
- City of Vancouver. 2012. Street-trees. City of Vancouver Open Data Portal. https://opendata.vancouver.ca/explore/dataset/street-trees/information/?disjunctive.species_name&disjunctive.common_name&disjunctive.height_range_id.
- City of Vancouver. 2015. Greenest city action plan part two: 2015–2020. City of Vancouver. https://vancouver.ca/files/cov/greenest-city-2020-action-plan-2015-2020.pdf.
- City of Vancouver. 2016. Population. City of Vancouver. https://vancouver.ca/news-calendar/population.aspx?.
- Clarke LW, Jenerette GD, Davila A. 2013. The luxury of vegetation and the legacy of tree biodiversity in Los Angeles, CA. Landsc Urban Plan. 116:48–59. doi:10.1016/j.landurbplan.2013.04.006.
- Cribari-Neto F, Zeileis A. 2010. Beta regression in R. J Stat Softw. 34(2):1–24. doi:10.18637/jss.v034.i02.
- Daily GC. 1997. Nature’s services: societal dependence on natural ecosystems. Washington (DC): Island Press.
- Dales RE, Cakmak S, Judek S, Coates F. 2008. Tree pollen and hospitalization for asthma in urban Canada. Int Arch Allergy Immunol. 146(3):241–247. doi:10.1159/000116360.
- Dobbs C, Kendal D, Nitschke CR. 2014. Multiple ecosystem services and disservices of the urban forest establishing their connections with landscape structure and sociodemographics. Ecol Indic. 43:44–55. doi:10.1016/j.ecolind.2014.02.007.
- Doick KJ, Peace A, Hutchings TR. 2014. The role of one large greenspace in mitigating London’s nocturnal urban heat island. Sci Total Environ. 493:662–671. 10.1016/j.scitotenv.2014.06.048.
- Dunn OJ. 1961. Multiple comparisons among means. J Am Stat Assoc. 56(293):52. doi:10.2307/2282330.
- Dyment JE, Bell AC. 2008. Grounds for movement: green school grounds as sites for promoting physical activity. Health Educ Res. 23(6):952–962. doi:10.1093/her/cym059.
- Dzierzanowski K, Popek R, Gawronska H, Saebo A, Gawronski SW. 2011. Deposition of particulate matter of different size fraction on leaf surfaces and in waxes of urban forests species. Int J Phytorem. 13(10):1037–1046. doi:10.1080/15226514.2011.552929.
- Ellaway A, Morris G, Curtice J, Robertson C, Allardice G, Robertson R. 2009. Associations between health and different types of environmental incivility: a Scotland-wide study. Public Health. 123(11):708–713. doi:10.1016/j.puhe.2009.09.019.
- Erkip F. 1997. The distribution of urban public services: the case of parks and recreational services in Ankara. Cities. 14(6):353–361. doi:10.1016/S0264-2751(97)00026-7.
- Ferrari SLP, Cribari-Neto F. 2004. Beta regression for modelling rates and proportions. J Appl Stat. 31(7):799–815. doi:10.1080/0266476042000214501.
- Fjørtoft I. 2004. Landscape as playscape: the effects of natural environments on children’s play and motor development. Child Youth Environ. 14(2):21–44. https://www.jstor.org/stable/10.7721/chilyoutenvi.14.2.0021.
- Florvaag E, Elsayed S, Apold J. 1982. Comparative studies on tree pollen allergens: II. isolation of alder (alnus incana) pollen allergens: purification and some characteristics of the major allergen pi 4.78. Int Arch Allergy Immunol. 67:49–56. doi:10.1159/000232987.
- Franchi GG, Nepi M, Matthews ML, Pacini E. 2007. Anther opening, pollen biology and stigma receptivity in the long blooming species, Parietaria judaica L. (Urticaceae). Flora: Morphol, Distrib, Funct Ecol Plants. 202(2):118–127. doi:10.1016/j.flora.2006.03.005.
- Friedman J 2009. The ecology and evolution of wind pollination. PhD. thesis, University of Toronto, Toronto (Ontario, Canada). 250 p.
- García-Mozo H, Oteros JA, Galán C. 2016. Impact of land cover changes and climate on the main airborne pollen types in Southern Spain. Sci Total Environ. 548–549:221–228. doi:10.1016/j.scitotenv.2016.01.005.
- Grahn P, Stigsdotter UA. 2003. Landscape planning and stress. Urban For Urban Greening. 2:1–18. doi:10.1078/1618-8667-00019.
- Heidt V, Neef M. 2008. Benefits of urban green space for improving urban climate. In: Carreiro MM, Song YC, Wu J, editors. Ecology, planning, and management of urban forests. New York (NY): Springer; p. 84–96.
- Herrington S, Studtmann K. 1998. Landscape interventions: new directions for the design of children’s outdoor play environments. Landsc Urban Plan. 42(2–4):191–205. doi:10.1016/S0169-2046(98)00087-5.
- Heynen NC, Lindsey G. 2003. Correlates of urban forest canopy cover: implications for local public works. Public Works Manage Policy. 8(1):33–47. doi:10.1177/1087724X03008001004.
- Hope D, Gries C, Zhu W, Fagan WF, Redman CL, Grimm NB, Nelson AL, Martin C, Kinzig A. 2003. Socioeconomics drive urban plant diversity. Proc Natl Acad Sci U S A. 100(15):8788–8792. doi:10.1073/pnas.1537557100.
- Idilfitri S, Sulaiman S, Salleh NS. 2014. Role of ornamental plants for bird community’ habitats in urban parks. Procedia – Social Behav Sci. 153:666–677. doi:10.1016/j.sbspro.2014.10.098.
- Kabisch N, Haase D, Van den Bosch MA. 2016. Adding natural areas to social indicators of intra-urban health inequalities among children: a case study from Berlin, Germany. Int J Environ Res Public Health. 13(8):783. doi:10.3390/ijerph13080783.
- Kearns A, Whitley E, Bond L, Tannahill C. 2012. The residential psychosocial environment and mental wellbeing in deprived areas. Int J Hous Policy. 12(4):413–438. doi:10.1080/14616718.2012.711985.
- Kleinman M, Geiger JR. 2002. Trees in our city. Davis (CA): Center for Urban Forest Research, Pacific Southwest Research Station, USDA Forest Service, ppt.; p. 13.
- Landry SM, Chakraborty J. 2009. Street trees and equity: evaluating the spatial distribution of an urban amenity. Environ Plan A. 41(11):2651–2670. doi:10.1068/a41236.
- Latinopoulos D, Mallios Z, Latinopoulos P. 2016. Valuing the benefits of an urban park project: a contingent valuation study in Thessaloniki, Greece. Land Use Policy. 55:130–141. doi:10.1016/j.landusepol.2016.03.020.
- Latorre F. 1999. Differences between airborne pollen and flowering phenology of urban trees with reference to production, dispersal and interannual climate variability. Aerobiologia. 15(2):131–141. doi:10.1023/A:1007523316024.
- Lemon J. 2006. Plotrix: a package in the red light district of R. R-News. R Package Version 3 5-11. 6(4):8–12. http://CRAN.R-project.org/package=plotrix.
- Leong M, Dunn RR, Trautwein MD. 2018. Biodiversity and socioeconomics in the city: a review of the luxury effect. Biol Letters, Royal Soc Publ. 14:5. doi:10.1098/rsbl.2018.0082.
- Lin RY, Clauss AE, Bennett ES. 2002. Hypersensitivity to common tree pollens in New York city patients. Allergy Asthma Proc. 23(4):253–258. doi:10.1016/S0091-6749(02)81434-8.
- Liu H, Hu Y, Li F, Yuan L. 2018. Associations of multiple ecosystem services and disservices of urban park ecological infrastructure and the linkages with socioeconomic factors. J Clean Prod. 174:868–879. doi:10.1016/j.jclepro.2017.10.139.
- Livesley SJ, McPherson EG, Calfapietra C. 2016. The urban forest and ecosystem services: impacts on urban water, heat, and pollution cycles at the tree, street, and city scale. J Environ Qual. 45(1):119–124. doi:10.2134/jeq2015.11.0567.
- Lõhmus M, Balbus J. 2015. Making green infrastructure healthier infrastructure. Infect Ecol Epidemiol. 5(1):30082. doi:10.3402/iee.v5.30082.
- Lovasi GS, O’Neil-Dunne JPM, Lu JWT, Sheehan D, Perzanowski MS, MacFaden SW, King KL, Matte T, Miller RL, Hoepner LA, et al. 2013. Urban tree canopy and asthma, wheeze, rhinitis, and allergic sensitization to tree pollen in a New York city birth cohort. Environ Health Perspect. 121(4):494–500. doi:10.1289/ehp.1205513.
- Lyytimäki J, Sipilä M. 2009. Hopping on one leg - the challenge of ecosystem disservices for urban green management. Urban For Urban Greening. 8(4):309–315. doi:10.1016/j.ufug.2009.09.003.
- Mallen E, Bakin J, Stone B, Sivakumar R, Lanza K. 2020. Thermal impacts of built and vegetated environments on local microclimates in an urban university campus. Urban Clim. 32:100640. doi:10.1016/j.uclim.2020.100640.
- Martin CA, Warren PS, Kinzig AP. 2004. Neighbourhood socioeconomic status is a useful predictor of perennial landscape vegetation in residential neighbourhoods and embedded small parks of Phoenix, AZ. Landsc Urban Plan. 69(4):355–368. doi:10.1016/j.landurbplan.2003.10.034.
- May KL. 2000. Sensitivity to birch pollen–under-appreciated etiology of atopic asthma in towns. Pneumonologia i alergologia polska: organ Polskiego Towarzystwa Ftyzjopneumonologicznego. Polskiego Towarzystwa Alergologicznego, I Instytutu Gruzlicy I Chorób Pluc. 68(9–10):478–485.
- McConnachie M, Shackleton CM. 2010. Public green space inequality in small towns in South Africa. Habitat Int. 34(2):244–248. doi:10.1016/j.habitatint.2009.09.009.
- Mcdonald JE. 1962. Collection and washout of airborne pollens and spores by raindrops. Sci. 135(3502):435–437. doi:10.1126/science.135.3502.435.
- McInnes RN, Hemming D, Burgess P, Lyndsay D, Osborne NJ, Skjøth CA, Thomas S, Vardoulakis S. 2017. Mapping allergenic pollen vegetation in UK to study environmental exposure and human health. Sci Total Environ. 599–600:483–499. doi:10.1016/j.scitotenv.2017.04.136.
- McPherson EG, Van Doorn NS, Peper PJ 2016. Urban tree database and allometric equations. U.S. Department of Agriculture, Forest Service, Pacific Southwest Research Station; p. 86. General Technical Report PSW-GTR-253.
- Melles SJ. 2005. Urban bird diversity as an indicator of human social diversity and economic inequality in Vancouver, British Columbia. Urban Habitats. 3(1):25–48. http://urbanhabitats.org/v03n01/vancouver_full.html.
- Molina RT, López FG, Rodríguez AM, Palaciso IS. 1996. Pollen production in anemophilous trees. Grana. 35(1):38–46. doi:10.1080/00173139609430499.
- Myrup LO. 1969. A numerical model of the urban heat island. J Appl Meteorol. 8:908–918. doi:10.1175/1520-0450(1969)008<0908:ANMOTU>2.0.CO;2.
- Nesbitt L, Meitner MJ. 2016. Exploring relationships between socioeconomic background and urban greenery in Portland, OR. Forests. 7(8):1–14. doi:10.3390/f7080162.
- Neyman J, Pearson ES. 1967. Joint statistical papers. London:Cambridge University Press.
- Nguyen N-A, Eskelson BNI, Gergel SE, Murray T. 2021. The occurrence of invasive plant species differed significantly across three urban greenspace types of Metro Vancouver, Canada. Urban For Urban Greening. 59:126999.
- Nowak DJ, Hirabayashi S, Doyle M, McGovern M, Pasher J. 2018. Air pollution removal by urban forests in Canada and its effect on air quality and human health. Urban For Urban Greening. 29:40–48. doi:10.1016/j.ufug.2017.10.019.
- Oke TR. 1982. The energetic basis of the urban heat island. Q J Royal Meteorol Soc. 108(455):1–24. doi:10.1002/qj.49710845502.
- Paciência I, Cavaleiro Rufo J, Ribeiro AI, Mendes FC, Farraia M, Silva D, Delgado L, Moreira A. 2020. Association between the density and type of trees around urban schools and exhaled nitric oxide levels in schoolchildren. Eur Ann Allergy Clin Immunol. doi:10.23822/eurannaci.1764-1489.162.
- Paciência I, Rufo JC, Silva D, Martins C, Mendes F, Rama T, Rodolfo A, Madureira J, Delgado L, De Oliveira Fernandes E, et al. 2019. School environment associates with lung function and autonomic nervous system activity in children: a cross-sectional study. Sci Rep. 9:15156. doi:10.1038/s41598-019-51659-y.
- Park BJ, Furuya K, Kasetani T, Takayama N, Kagawa T, Miyazaki Y. 2011. Relationship between psychological responses and physical environments in forest settings. Landsc Urban Plan. 102(1):24–32. doi:10.1016/j.landurbplan.2011.03.005.
- Poudyal NC, Hodges DG, Merrett CD. 2009. A hedonic analysis of the demand for and benefits of urban recreation parks. Land Use Policy. 26(4):975–983. doi:10.1016/j.landusepol.2008.11.008.
- Pretty J, Peacock J, Sellens M, Griffin M. 2005. The mental and physical health outcomes of green exercise. Int J Environ Health Res. 15(5):319–337. doi:10.1080/09603120500155963.
- R Core Team. 2019. R: a language and environment for statistical computing. Vienna (Austria): R Foundation for Statistical Computing. https://www.R-project.org/.
- Räsänen L, Reunala T, Lehto M, Virtanen E, Arvilommi H. 1992. Immediate and delayed hypersensitivity reactions to birch pollen in patients with atopic dermatitis. Acta Derm Venereol. 72(3):193–196. doi:10.102340/0001555572193196.
- Reed SD, Lee TA, McCrory DC. 2004. The economic burden of allergic rhinitis: a critical evaluation of the literature. PharmacoEconomics. 22:345–361. doi:10.2165/00019053-200422060-00002.
- Rojo J, Rapp A, Lara B, Fernández-González F, Pérez-Badia R. 2015. Effect of land uses and wind direction on the contribution of local sources to airborne pollen. Sci Total Environ. 538:672–682. doi:10.1016/j.scitotenv.2015.08.074.
- Ruan X, Huang J, Williams DAR, Harker KJ, Gergel SE. 2019. High spatial resolution landscape indicators show promise in explaining water quality in urban streams. Ecol Indic. 103:321–330. doi:10.1016/j.ecolind.2019.03.013.
- Sanesi G, Lafortezza R, Bonnes M, Carrus G. 2006. Comparison of two different approaches for assessing the psychological and social dimension of green spaces. Urban For Urban Greening. 5:121–129. doi:10.1016/j.ufug.2006.06.001.
- Schwartz J, Weiss ST. 1995. Relationship of skin test reactivity to decrements in pulmonary function in children with asthma or frequent wheezing. Am J Respir Crit Care Med. 152(6pt. I):2176–2180. doi:10.1164/ajrccm.152.6.8520794.
- SimplyAnalytics. 2018. Census 2018 median annual household income. SimplyAnalytics database. [accessed 2019 May 28].
- Sivarajah S, Smith SM, Thomas SC, Reddy SV. 2018. Tree cover and species composition effects on academic performance of primary school students. PLoS ONE. 13:2. doi:10.1371/journal.pone.0193254.
- Skjøth CA, Sikoparija B, Jager S. 2012. Pollen sources. In: Sofiev M, Bergmann K-C, editors. Allergenic pollen: a review of the production, release, distribution and health impacts. New York (NY): Springer; p. 9–27.
- Skjøth CA, Ørby PV, Becker T, Geels C, Schlünssen V, Sigsgaard T, Bønløkke JH, Sommer J, Søgaard P, Hertel O, et al. 2013. Identifying urban sources as cause of elevated grass pollen concentrations using GIS and remote sensing. Biogeosciences. 10(1):541–554. doi:10.5194/bg-10-541-2013.
- Statistics Canada. 2016. Median household total income in 2015, by 2016 census division (CD). Census of Population. https://www12.statcan.gc.ca/census-recensement/2016/geo/map-carte/ref/thematic-thematiques/inc-rev/map-eng.cfm?TYPE=1.
- Takaro TK, Knowlton K, Balmes JR. 2013. Climate change and respiratory health: current evidence and knowledge gaps. Expert Rev Respir Med. 7(4):349–361. doi:10.1586/17476348.2013.814367.
- Taylor AF, Kuo FE, Sullivan WC. 2001. Coping with ADD. The surprising connection to green play settings. Environ Behav. 33(1):54–77. doi:10.1177/00139160121972864.
- Thompson JL, Thompson JE. 2003. The urban jungle and allergy. Immunol Allergy Clin North Am. 23(3):371–387. doi:10.1016/S0889-8561(03)00006-7.
- Thompson RS. 1993. Building amplification factors for sources near buildings: a wind-tunnel study. Atmos Environ Part A, Gener Topics. 27(15):2313–2325. doi:10.1016/0960-1686(93)90400-S.
- Tranter PJ, Malone K. 2004. Geographies of environmental learning: an exploration of children’s use of school grounds. Children’s Geographies. 2(1):131–155. doi:10.1080/1473328032000168813.
- Vancouver Board of Parks and Education. 2018a. VanPlay: inventory and analysis. Chapter 2, Vancouver, British Columbia, Canada: Vancouver Board of Parks and Recreation; p. 29.
- Vancouver Board of Parks and Education. 2018b. VanPlay Report 2: 10 Goals to Shape the Next 25 Years. p. 25.
- Vilhar U. 2017. Water regulation and purification. In: Pearlmutter D, Calfapietra C, Samson R, O’Brien L, Krajter Ostoic S, Sanesi G, Alonso del Amo R, editors. The urban forest: cultivating green infrastructure for people and the environment. Vol. 7. Future City: Springer International Publishing; p. 41–47.
- Villeneuve PJ, Jerrett M, Su J G, Burnett RT, Chen H, Wheeler AJ, Goldberg MS. 2012. A cohort study relating urban green space with mortality in Ontario, Canada. Environ Res. 115:51–58. doi:10.1016/j.envres.2012.03.003.
- Von Döhren P, Haase D. 2015. Ecosystem disservices research: a review of the state of the art with a focus on cities. Ecol Indic. 52:490–497. doi:10.1016/j.ecolind.2014.12.027.
- Wang HF, Qureshi S, Knapp S, Friedman CR, Hubacek K. 2015. A basic assessment of residential plant diversity and its ecosystem services and disservices in Beijing, China. Appl Geogr. 64:121–131. doi:10.1016/j.apgeog.2015.08.006.
- Watkins SL, Mincey SK, Vogt J, Sweeney SP. 2017. Is planting equitable? An examination of the spatial distribution of nonprofit urban tree-planting programs by canopy cover, income, race, and ethnicity. Environ Behav. 49(4):452–482. doi:10.1177/0013916516636423.
- Weiss CC, Purciel M, Bader M, Quinn JW, Lovasi G, Neckerman KM, Rundle AG. 2011. Reconsidering access: park facilities and neighbourhood disamenities in New York city. J Urban Health. 88(2):297–310. doi:10.1007/s11524-011-9551-z.
- WHO Regional Office for Europe. 2016. Urban Green Spaces and Health. p. 25.
- Williams DAR, Matasci G, Coops NC, Gergel SE. 2018. Object-based urban landcover mapping methodology using high spatial resolution imagery and airborne laser scanning. J Appl Remote Sens. 12(4):1. doi:10.1117/1.jrs.12.046020.
- Yang L, Zhang L, Li Y, Wu S. 2015. Water-related ecosystem services provided by urban green space: a case study in Yixing city (China). Landsc Urban Plan. 136:40–51. doi:10.1016/j.landurbplan.2014.11.016.
- Zhou X, Parves Rana M. 2012. Social benefits of urban green space: a conceptual framework of valuation and accessibility measurements. Manage Environ Quality. 23(2):173–189. doi:10.1108/14777831211204921.
- Ziter CD, Pedersen EJ, Kucharik CJ, Turner MG. 2019. Scale-dependent interactions between tree canopy cover and impervious surfaces reduce daytime urban heat during summer. Proc Natl Acad Sci U S A. 116(15):7575–7580. doi:10.1073/pnas.1817561116.