
 ?Mathematical formulae have been encoded as MathML and are displayed in this HTML version using MathJax in order to improve their display. Uncheck the box to turn MathJax off. This feature requires Javascript. Click on a formula to zoom.
Abstract
Data visualisation is essential for communicating and interpreting biodiversity data effectively. When compared to numerical values, visualising information with images is easier. Citizen Science has facilitated the collection of biodiversity data that can be used to conserve and preserve biodiversity sites. Google Earth provides a visualisation platform that can be used for biodiversity site monitoring. The latter has frequently been expressed in terms of biodiversity indices. The use of biodiversity indices for sites can be improved by incorporating visualisation elements. Previous studies that attempted to incorporate the calculation of biodiversity indices into biodiversity monitoring systems lacked the visualisation feature. This novel study aims to create an online module that combines biodiversity data from citizen science with a visualisation component. The observation data is imported from iNaturalist (https://www.inaturalist.org/) using the REST API method, which includes the species name and location. Species richness, Shannon-Wiener index, and Simpson index, as well as Hill Numbers, are automatically calculated and displayed on the Google Map alongside the green space area. The University of Malaya, which is located in an urban area, will be used as the study site for the demonstration of the developed prototype. The online biodiversity module prototype is available at http://www.umlivinglabsystem.com/Map/multipoly.
1. Introduction
Dasmann and Jarell (Citation2000), Ehrenfeld (Citation1970), and Soulé (Citation1985) proposed the term conservation biology to address the loss of biological diversity. Peh et al. (Citation2013) stated that biodiversity conservation can benefit the community, especially ecosystem services. Decision-makers and developers need to know whether a site is suitable for development or restoration that benefits all stakeholders.
Species richness, Shannon-Wiener, and Simpson's indices are commonly used to measure biodiversity. These indices are mathematical functions that combine species richness and evenness (Colwell Citation2009). Hill Numbers (Hill Citation1973) summarised all three types of biodiversity indices in a single expression (Broms et al. Citation2015). Many researchers believe biodiversity is an indicator of ecosystem health and is commonly used in environmental assessments.
Biodiversity is becoming increasingly important in healthy ecosystems (Laurila-Pant et al. Citation2015). According to Pyron (Citation2010), species richness, diversity, and evenness are associated with biodiversity communities. A diverse ecosystem is considered more ecologically stable, productive, and sustainable (Beals et al. Citation2000). Scientists claim that areas with high species richness and rare species are biodiversity hotspots that must be protected. Normally, conservation sites are chosen based on species richness and diversity indexes, without knowledge of species distribution and patterns. Landscape and ecological patterns, along with biodiversity indices, can help conserve biodiversity (Murray Citation2002).
Volunteer participation in conservation and ecology has increased in recent years, leading to the term ‘Citizen Science’ (Wiggins and Crowston, Citation2011; Cohn, Citation2008 ). It is a non-expert form of research collaboration or data collection. Encouraging the public to participate in environmental monitoring and research has been shown to increase public awareness of environmental conservation (Toogood Citation2013). The researchers can use various publics as data gatherers and obtain vast biological data in a short period.
However, ‘Citizen Science’ projects have raised concerns about the quality of data collected by non-professional scientists and volunteers (Elliott & Rosenberg, Citation2019). Various Citizen Science Projects have been established with great success, especially with modern technology like mobile phones. iNaturalist a free online or mobile app is a crowdsourced application for observing and identifying plants and animals. Date, time, location, taxonomic identification, images, audio recordings, and other user-defined data fields are recorded by users. iNaturalist can also generate high-quality research data for scientists, which is expert-verified (https://www.inaturalist.org/) (iNaturalist, Citation2020).
Data visualisation is essential for effective information communication and interpretation. Visualizing data as an image is easier than numerical figures. Furthermore, the abundance of data necessitates efficient information access and communication (De Vries Citation2011). Geographic Information Technology (GIS) (ESRI Citation2018) has provided a significant advantage in managing and planning biodiversity conservation by allowing scientists to visualise topology and plant behaviour. Because GIS can analyse the relationship between plant traits and local gradients for given communities, an explanation can be made by understanding how plant species are distributed in a community, especially rare species, which are more easily identified (Swenson Citation2011). Areas rich in biodiversity can be identified and claimed as a protected habitat using GIS, preserving important genetic resources (Attorre et al. Citation2011).
However, few research and systems exist that combine species diversity indicators with biodiversity conservation visualisation. Existing online systems on biodiversity are less dynamic, perform specific functions such as calculating diversity indices or just displaying species distributions. The majority of the online systems do not include visualisation features and are merely an online biodiversity calculator, in which users enter the number of species and their names, and the diversity indices are produced automatically. The Tanner M. Young Biodiversity Calculator (https://www.alyoung.com/labs/biodiversitycalculator.html), the BPMSG Diversity Online Calculator (https://bpmsg.com/academic/div-calc.php), and Jean Weber's Pericopsis.org are all available systems that visualise plant species but do not measure biodiversity indices (Weber Citation2014).
Thus, in this study, we will integrate established biodiversity indices (species richness, Shannon-Wiener, Simpson's indices, and Hill numbers) with the visualisation capabilities of GIS to create an online system using data obtained from the citizen science website iNaturalist. The iNaturalist data on plant species are mapped using GIS technology and shown as a layer on the Google Earth platform. This permits the viewing of plant species in conjunction with their associated data in a specific area. Additionally, we intend to use the built online application to automatically generate biodiversity indices for the selected area. This is a novel study in which we want to gain a better understanding and insight into the diversity patterns to manage biodiversity conservation effectively.
2. Materials and methods
2.1 Study site and sampling data
Our study area is the University of Malaya (UM), an urban university located in the heart of Kuala Lumpur. The University of Malaya's Environmental Secretariat initiated the RIMBA Project to protect and promote the university's biodiversity, conserve the campus's urban biodiversity and increase campus awareness (Malaya Citation2013). The RIMBA project is closely related to our research because they regularly host events that highlight the campus's diversity of biodiversity, including increasing green cover through the planting of diverse rainforest trees, raising seedlings of native trees, tree tagging, and several workshops on communication, writing, and media. As a result of the RIMBA strategy for conservation, As the RIMBA approach to conservation has created many opportunities for volunteers through the use of citizen science software iNaturalist.which contributed and give suggestions in our research study.
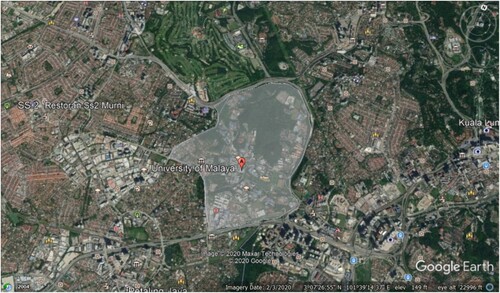
The University of Malaya is located in Kuala Lumpur, Malaysia, at coordinates of 3°07′15″N 101°39′23″E. The study area's principal focus is depicted in Figure .
Figure 1. The location of the University of Malaya in Google Earth.
The species data for the University Malaya are imported from the site – iNaturalist (https://www.inaturalist.org/). Google Earth is used to identify green space area data within the university. Before integrating data from iNaturalist, the area is selected as a polygon and uploaded into the system.
iNaturalist data include the continuous integration of field images and an array of metadata associated with observations, as well as the community-driven process for taxonomic identification and record validation. In this study, two types of iNaturalist data were used: data with a Casual ID and data with a Research ID. Users can select the type of data they want to use. When Research ID is selected, the data is verified by experts and is more accurate.
iNaturalist adheres to a set of well-established taxonomic authorities, which are updated regularly by knowledgeable users (‘Curators’). However, any user may add placeholder taxon names that iNaturalist does not presently recognise. There are numerous connections between these digital collections created and maintained by the iNaturalist community and actual herbaria collections maintained by botanical professionals. These photographic records are essentially digital specimens that lack reference material in the form of physical vouchers. Given the high degree of overlap between data associated with iNaturalist observation-based records and those associated with specimen-based records, iNaturalist is well-suited as a data collection tool for field plant collectors. The data types acquired by iNaturalist for the University of Malaya are presented in Table .
Table 1. Data Types in iNaturalist.
The Data Quality Assessment summarises the accuracy, completeness, and suitability of observation for sharing with data partners. The verifiable observation is the foundation of iNaturalist. A verifiable observation has a date, is geolocated, contains photos or sounds, and is not of a captive or cultivated organism. Table shows the data characteristics for the study site imported from iNaturalist. We chose to demonstrate using research-grade qualification data in this study.
Table 2. iNaturalist Data Quality Assessment
2.2 Green space area representation
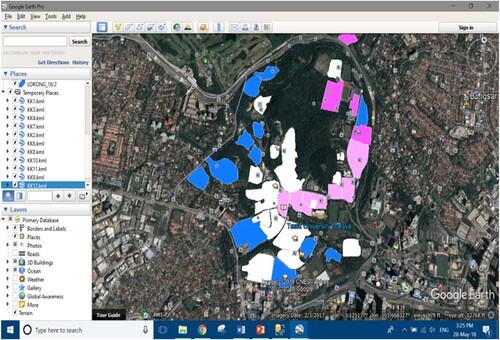
The polygon for the University of Malaya for green space area is drawn using Google Earth Pro and Geographic Information System (GIS) mapping technology.
Each polygon drawn is saved as Keyhole Markup Language (KML) file, since Google Earth renders a KML file for displaying the virtual earth browser. The KML file is a grammar of XML for marking up spatial data, thus the coordinates could be extracted from the file and create interactive mash-ups using HTML and JavaScript (Nolan and Lang Citation2014). below shows the polygon drawn within the campus.
Figure 2. Polygon files (KML files) are drawn using Google Earth Pro.
2.3 Biodiversity indices calculation
Biodiversity indices such as species richness, Shannon-Wiener Index, Simpson’s Index and Hill numbers are used in the study as these indices are common measurements for species diversity in a community. These indices are commonly used in ecology (Saint-Germain et al. Citation2005). According to Colwell (Citation2009), these indices are mathematical functions that take account of species richness and evenness and calculate in a single measure.
Species richness
Species richness (S) is the number of species within a defined region (Moore Citation2013). According to (Colwell et al., Citation2016), community ecologists and conservation biologists regarded measuring species richness as a fundamental objective where the number of species in a local aggregation is an instinctive and natural index of a community structure. Measuring species richness and diversity using a geographic approach ables to determine what species are at risk of extinction by having the species geographic coordinates, we can assemble, store, retrieve and manipulate data on the species distribution and the geographical pattern (Scott et al. Citation1987)
Shannon-Wiener index (H’)
Spellerberg and Fedor (Citation2003) researched the use of species indexes, specifically the ‘Shannon-Wiener Index.’ The Shannon-Wiener index accounts for both the abundance and evenness of the species present. It is an information statistic index; it represents all the species in the community and is commonly used to characterize species diversity in a community.
The value H increases, when the number of species in the sample increases. Normally this index is used to compare the diversity of a series of samples. Hence, a higher value of H indicates high species diversity in the sample (Magurran Citation2005). The Shannon-Wiener index is useful to determine whether an area consists of valuable and rare species. Besides it is sensitive to changes and relatively easy to measure.
Simpson’s index (D)
Simpson (Citation1949) developed the Simpson's diversity index, which describes the likelihood that a second individual drawn from a population is of the same species as the first. Simpson's index is known as a ‘dominance concentration’ measure because it is sensitive to the abundance of only the more abundant species in a sample (Whittaker, Citation1965). Unlike the Shannon-Wiener index, Simpson's diversity index is sensitive and gives more weight to the most common and dominant species, while rare species do not affect the calculation.
The value of D has the maximum value of 1, the higher the value, the higher the diversity.
Hill numbers
Hill numbers are a combination of taxonomic, functional, and phylogenetic diversity indices (Hill Citation1973). Hill numbers can be used to quantify and compute the effective number of species using the following formula (Clarke et al. Citation2014):
where often implies as the total number of species, 1D is the exponential of Shannon index. As for 2D is the reciprocal of Simpson’s index and if nD is another possible evenness index (Clarke et al. Citation2014).
Biodiversity indices used in this study are summarized in table .
Table 3. Summary of Biodiversity Indices used in the System.
2.4 Development of the web-based biodiversity system
Visual Studio 2017 was used to develop a web-based system for measuring and visualising biodiversity indices. The system is developed using the C# and ASP.net programming languages. C #'s advantage is its ease of integration with components written in other languages and with a large number of Microsoft's proprietary technologies. It also runs on a variety of platforms, including Google Earth. C# has access to the.NET Framework's class libraries, which is necessary for constructing the system's graphical representation (Microsoft. n.d.). Additionally, C# is built on a network-distributed infrastructure. The.NET platform, which is responsible for managing the code environment that enables C# and VB.net applications.
We also used, Hypertext Markup Language (HTML) to create web pages and web applications. HTML can embed scripting language programmes, such as JavaScript, that provide the functionality of the webpage. CSS is used to design the presentation of an HTML page, including the designs, layouts, colours, and fonts.
Google Maps API V3.27 (Developers Citation2015) was used to view the graphical representation of species in real-time on the Google Earth platform. The Google Maps API is required for the system to display the map, and it allows for customization by displaying polygons and markers on the maps. The data for the species and diversity indices in this study were stored in MySQL. My SQL 8.0 is a free, open-source database management system that is ideal for websites due to its high-performance query engine, fast data insert capability, and strong support for specialised web functions such as quick full-text searches (MySQL Citation2016). As a result, we used MySQL to store polygon and species information in the developed system.
iNaturalist is a global community of naturalists, scientists, and enthusiasts that share over a million wildlife sightings to educate and conserve the natural world. The California Academy of Sciences administers the iNaturalist technology infrastructure and open-source software to explore, explain, and preserve life on Earth (Matheson Citation2014).
The REST API is used to obtain specific information from iNaturalist. REST API is an architectural style for an application programme interface that uses HTTP requests to access and use data. It is used because the data can be used for a variety of functions such as GET, PUT, POST, and DELETE data types (Masse Citation2011), allowing the system to communicate with the iNaturalist platform and request species data from them. Furthermore, REST API consumes less bandwidth and supports a variety of data formats. In this study, we used JSON data format to ‘GET’ the species name, scientific name, location coordinates, observer name, and date observed (Gillis Citation2020).
The iNaturalist API is a collection of REST endpoints that can be used to read data from and write data back to iNaturalist on behalf of users. By appending, data can be retrieved in a variety of formats. [format] to the endpoints, such as ‘/observation.json’ to retrieve biodiversity observation data. In our study, we used the GET/observation fields API to obtain species information, such as species location and taxon, which does not require iNaturalist authentication because we are not accessing data such as unobscured coordinates on behalf of users or writing data to iNaturalist, which requires an authenticated request (iNaturalist Citation2020). JSON format typically contains more information, according to iNaturalist (Citation2020), because iNaturalist uses JSON responses internally.
Table depicts the iNaturalist API, which enables us to obtain the necessary observation data from the iNaturalist database in JSON format, and the data acquired is updated daily and incorporated into our biodiversity visualisation system. Our research is focused on Kuala Lumpur, Malaysia, and the data collected will be centred on place ids with the integer value of ‘97102,’ which represents the codes for the specific location.
Table 4. iNaturalist API used in the Biodiversity Visualization System Prototype
With regards to the green space area, users can upload the region they are interested in via the system using the KML file format. Then, users can build a graphical visualisation of the green space region on Google Maps, with the system retrieving the coordinates based on the data to be displayed. Using species and green space area data, the system can calculate species richness, Shannon-Wiener index, Simpson index, and Hill numbers and visualize them on a Google Map.
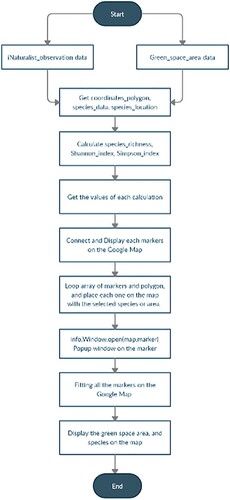
The species data will be retrieved from the iNaturalist website via the biodiversity system that has been developed in this study. It is the iNaturalist user that collects the species data, and the biodiversity system will extract the required data from iNaturalist daily via the REST API. When the data has been retrieved, the system will process it and provide a variety of reports for the system end-user based on their specific requirements. The architecture and flowchart of the system are depicted in Figures and .
Figure 3. System Architecture for the Biodiversity System
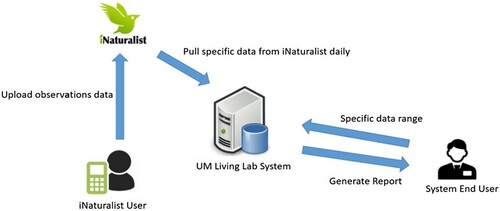
Figure 4. Biodiversity System Flowchart.
3. Results and discussion
The prototype of the biodiversity indices visualisation system is available at the following URL: http://www.umlivinglabsystem.com/Map/multipoly. The polygon representing the green space region will appear on the Google Earth Map along with the species information based on the user's selection of the species or area, as illustrated in Figure . Additionally, users can read additional information about a species by clicking on the placemark. This information includes the species’ common name, scientific name, location, date observed, and images, if available. As depicted in Figure , the system enables users to select plant species based on their species, genus, or common name. After selecting a certain plant species, the system will display its availability for the polygon of interest.
Additionally, the system offers users guidance in the form of a colour range for assessing biodiversity, which is dependent on the proportion of species richness, as illustrated in Figure . The biodiversity range is calculated using the Species Richness (N’) value, which is then converted to a percentage (percent). The polygon is coloured to correspond to a given biodiversity range, which aids in the visualisation of data. The colour guide is capable of attracting the user's attention and instantly identifying the portion of the polygon that contains the greatest percentage of species, as illustrated in Figure .
When the generate option in Figure is clicked, the information about the species of interest is displayed on the Google map as a marker. When a marker is clicked, species information is displayed in a floating window, as illustrated in Figure .
Figure 5. ‘DTC’ as the selected green space area, the species richness of the selected area is 78 with 33 different species.
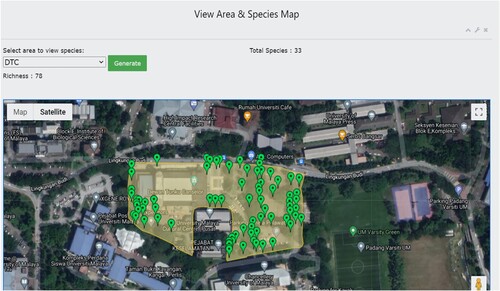
Figure 6. Species Topology page with the displayed Biodiversity Indices and Hill Numbers calculations (n = 0, 1, 2, … n).
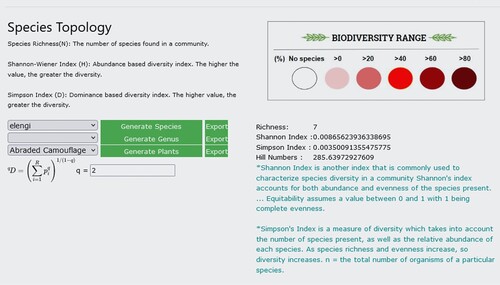
Figure 7. Biodiversity Range based on Species Richness (N’) Percentage.
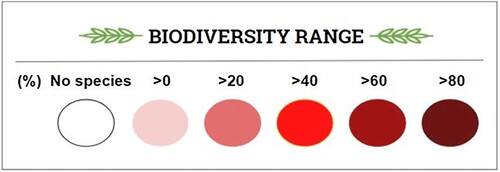
Figure 8. Polygon is red on the map indicates an area with higher species density on the Google map.
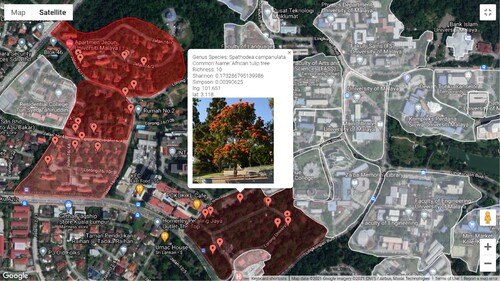
Figure 9. Float window that shows species information and diversity indices.
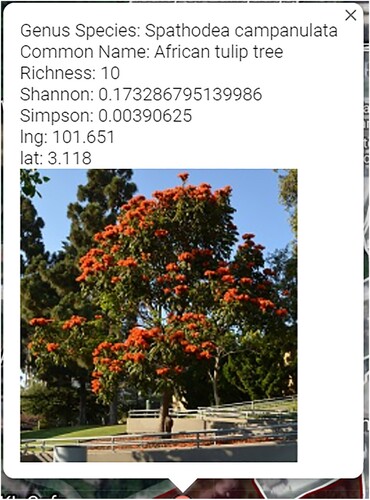
The floating window displays information on plant species and the diversity indexes, including the taxonomic classification, common name, coordinates, an image of the species, and the diversity indices Species Richness, Shannon-Wiener index, Simpson's index and Hill numbers. Users can choose the hill number order (q = 0, 1, 2,) in a drop down list and the system will automatically calculate it, as illustrated in Figure .
In this study we have introduced effective data visualisation facilitates inference and decision-making, as well as the clear and effective transmission of information via graphical means that are not readily visible in numerical summaries. Data visualisation is important because it permits the clear and effective conveyance of information via graphical means. It is beneficial for assessing facts that are crucial for decision-making for the preservation of rare and endangered species in the community. Data visualization makes environmental data more comprehensible and facilitates the identification of trends, patterns, and outliers. Graphical analysis is essential for identifying patterns, trends, and other characteristics that are not readily visible from numerical summaries. Effective visual data mining methods are necessary to visualise multivariate and spatiotemporal ecological data so that patterns and linkages may be clearly perceived. The conventional strategies for visualising multivariate data are geometric, glyph or icon-based, pixel-oriented, and hierarchical in nature (Schroeder Citation2005).
We also integrate human vision, creativity, and general knowledge with the storage capacity and processing power of modern computers in order to investigate large amounts of biodiversity data. This is accomplished in this study by presenting the user with graphical representations of the data, which enables the user to interact with the data to acquire insight and quickly form conclusions (Keim Citation2005). Additionally, the ability to depict relationships and patterns revealed in complicated ecological data is critical. To accomplish this, we used data gathered through citizen science, as well as established biodiversity indices, and the visualisation capabilities of the Google Earth platform to accomplish our research.
To demonstrate the biodiversity indices, we used Geographic Information System (GIS), symbols, and various colour and species information, which we deployed on the Google Earth platform. To ensure the accuracy of the information provided by the developed system, we used data from iNaturalist, a well-designed and widely used platform for species observation, with experts validating each observation. Citizen science is defined by (Burgess et al. Citation2017), (Cooper et al. Citation2007), (Cosquer et al. Citation2012), (Danielsen et al. Citation2013), and (Theobald et al. Citation2015). Increased use of citizen science in ecology and conservation would be enormously beneficial due to citizen science's ability to offer data at large spatiotemporal scales. Additionally, by applying the citizen science idea, global conservation issues can be addressed (Burgess et al. Citation2017). The iNaturalist project's purpose is to enable citizens to record biodiversity data; it has been crowdsourcing biodiversity observation since 2008, collecting over 25 million recordings from over 700,000 people and involving 90,000 people in data verification (Seltzer Citation2019). However, citizen science data are frequently not well welcomed by the scientific community due to worries about the rigour of data collection, which results in data quality erosion (Burgess et al. Citation2017). iNaturalist's effort to ensure the data's quality and suitability for use by the scientific community includes the introduction of ‘Research Grade’ observations, which are spatially georeferenced, contain images or recorded sound, and are identified and additionally examined by two independent reviewers. We choose to add ‘research quality’ observation data into our system since they are more reliable and persuasive to the scientific community and can be used in future scientific publications.
As a result, the information obtained is trustworthy and can be used in the system for visualisation, calculation of diversity indices, and decision making. We chose Google Earth because the interface is simple to use and allows for quick scale changes from global to local and back. Sampling points are easily located, and Google Earth's spatial database keeps background information such as rivers and road data up to date. The lighter green space area represents fewer species observed in the area, whereas the darker green space area represents otherwise. Each placemark can be clicked, and a more detailed explanation, as well as the diversity indices, are displayed in the web-based system's pop-up window. This allows for improved visualisation of biodiversity data for use in biodiversity-related decision making.
4. Conclusion
This is a novel study in which we integrated Google Earth's visualisation capabilities with a large amount of biodiversity data gathered through a citizen science approach. Using Google Earth, the developed biodiversity system enables users to calculate and visualise species information and essential biodiversity indices. By utilising GIS technology, varied colours and forms, as well as placemarks, it is possible to easily analyse patterns of species distribution and diversity, allowing for more informed judgments regarding environmental conservation and protection, implying less damage. The web-based system intends to increase awareness and comprehension of various patterns while also indirectly educating the community about environmental conservation.
5. Data availability statement
The data that support the findings of this study are available in Global Biodiversity Information Facility (GBIF) Registry with the references from iNaturalist contributors, iNaturalist (Citation2020). iNaturalist Research-grade Observations. iNaturalist.org. Occurrence dataset https://doi.org/10.15468/ab3s5x accessed via GBIF.org.
Disclosure statement
No potential conflict of interest was reported by the author(s).
Correction Statement
This article has been corrected with minor changes. These changes do not impact the academic content of the article.
Additional information
Funding
References
- Attorre F, Taleb N, De Sanctis M, Farcomeni A, Guillet A, Vitale M. 2011. Developing conservation strategies for endemic tree species when faced with time and data constraints: Boswellia spp. on Socotra (Yemen). Biodiversity and Conservation. 20(7):1483–1499.
- Beals M, Gross L, Harrell S. 2000. Diversity indices: Shannon’s H and E. Knoxville (TN): The Institute for Environmental Modelling (TIEM), University of Tennessee.
- Broms KM, Hooten MB, Fitzpatrick RM. 2015. Accounting for imperfect detection in Hill numbers for biodiversity studies. Methods in Ecology and Evolution. 6(1):99–108.
- Burgess HK, DeBey LB, Froehlich HE, Schmidt N, Theobald EJ, Ettinger AK, HilleRisLambers J, Tewksbury J, Parrish JK. 2017. The science of citizen science: Exploring barriers to use as a primary research tool. Biol Conserv. 208:113–120.
- Clarke KR, Gorley RN, Somerfield PJ, Warwick RM. 2014. Change in marine communities: an approach to statistical analysis and interpretation. Primer-E Ltd. 8(2).
- Cohn JP. 2008. Citizen science: Can volunteers do real research? BioScience. 58(3):192–197.
- Colwell RK. 2009. Biodiversity: concepts, patterns, and measurement. The Princeton Guide to Ecology. 663:257–263.
- Colwell RK, Gotelli NJ, Ashton LA, Beck J, Brehm G, Fayle TM, Novotny. 2016. Midpoint attractors and species richness: modelling the interaction between environmental drivers and geometric constraints. Ecology letters. 19(9):1009–1022.
- Cooper CB, Dickinson J, Phillips T, Bonney R. 2007. Citizen science as a tool for conservation in residential ecosystems. Ecol. Soc. 12(2):1–11.
- Cosquer A, Raymond R, Prevot-Julliard AC. 2012. Observations of everyday biodiversity: a new perspective for conservation? Ecol. Soc. 17(4):2–17.
- Danielsen F, Adrian T, Brofeldt S, Van Noordwijk M, Poulsen MK, Rahayu S, Rutishauser E, et al. 2013. Community monitoring for REDD+ International promises and field realities. Ecol. Soc. 18(3):41–71.
- Dasmann RF, Jarrell R. 2000. Raymond F. Dasmann: a life in conservation biology. Santa Cruz (CA): University Library University of California, Santa Cruz.
- Developers G. 2015. Introduction to the Google Maps SDK for iOS. https://developers.google.com/maps/documentation/ios/intro.
- De Vries P. 2011. The resilience principles: A framework for new ICT governance. J. on Telecomm. & High Tech. L. 9:137–173.
- Ehrenfeld DW. 1970. Biological Conservation. New York (NY): Holt, Rinehart and Winiston.
- Elliott KC, Rosenberg J. 2019. Philosophical foundations for citizen science. Citizen Science: Theory and Practice. 4(1).
- ESRI. 2018. Coordinate systems, projections, and transformations. Accessed November 15, 2019. https://pro.arcgis.com/en/pro-app/help/mapping/properties/coordinate-systems-and-projections.htm.
- Gillis AS. 2020. REST API (RESTful API). 22 September. Accessed December 2020. https://searchapparchitecture.techtarget.com/definition/RESTful-API.
- Gotelli NJ, Colwell RK. 2001. Quantifying biodiversity: procedures and pitfalls in the measurement and comparison of species richness. Ecology letters. 4(4):379–391.
- Hill MO. 1973. Diversity and evenness: a unifying notation and its consequences. Ecology. 54(2):427–432.
- iNaturalist. 2020. iNaturalist [online] 2020 January 1. https://www.inaturalist.org/.
- Keim DA, Panse C, Sips, M. 2005. Information Visualization: Scope, Techniques and Opportunities for Geovisualization. In: Exploring Geovisualization. Amsterdam: Elseveir.
- Laurila-Pant M, Lehikoinen A, Uusitalo L, Venesjärvi R. 2015. How to value biodiversity in environmental management? Ecological indicators. 55:1–11.
- Magurran AE. 2005. Species abundance distributions: pattern or process? Functional Ecology. 19(1):177–181.
- Malaya, University of. 2013. The RIMBA Project. https://www.um.edu.my/the-rimba-project.
- Masse M. 2011. REST API design rulebook: designing consistent RESTful Web service interfaces. Sebastopol: O'Reilly Media, Inc.
- Matheson CA. 2014. “iNaturalist.” Reference Reviews.
- Moore JC. 2013. Diversity, taxonomic versus functional. Elsevier. 646–656.
- Murray MG. 2002. Current issues in biodiversity conservation. Rome: FAO.
- MySQL. 2016. MySQL 8.0 Release Notes. 12 09. https://dev.mysql.com/doc/relnotes/mysql/8.0/en/.
- Nolan D, Lang DT. 2014. Javascript object notation. In: XML and Web technologies for data sciences with R. New York (NY): Springer. p. 227–253.
- Peh KSH, Balmford A, Bradbury RB, Brown C, Butchart SH, Hughes FM, Birch JC. 2013. TESSA: A toolkit for rapid assessment of ecosystem services at sites of biodiversity conservation importance. Ecosystem Services. 5:51–57.
- Pyron M. 2010. Characterizing communities. Nature Education Knowledge. 3(10):39.
- Saint-Germain M, Larrivée M, Drapeau P, Fahrig L, Buddle CM. 2005. Short-term response of ground beetles (Coleoptera: Carabidae) to fire and logging in a spruce-dominated boreal landscape. Forest Ecology and Management. 212(1–3):118–126.
- Schroeder M. 2005. Intelligent information integration: from infrastructure through consistency management to information visualization. Exploring Geovisualization. 1:477–494.
- Scott JM, Csuti B, Jacobi JD, Estes JE. 1987. Species richness. BioScience. 37(11):782–788.
- Seltzer C. 2019. Making biodiversity data social, shareable, and scalable: reflections on iNaturalist & citizen science. Biodiversity Information Science and Standards. e10197–e10197.
- Shannon CE. 1949. The mathematical theory of communication, by CE Shannon (and recent contributions to the mathematical theory of communication). Champaign (IL): University of Illinois Press.
- Simpson EH. 1949. Measurement of diversity. Nature. 163(4148):688–688.
- Soulé ME. 1985. What is conservation biology? BioScience. 35(11):727–734.
- Spellerberg IF, Fedor PJ. 2003. A tribute to Claude Shannon (1916-2001) and a plea for more rigorous use of species richness, species diversity and the ‘Shannon-Wiener’ Index. Global Ecology and Biogeography. 12(3):177–179.
- Swenson NG. 2011. Phylogenetic beta diversity metrics, trait evolution and inferring the functional beta diversity of communities. PloS one. 6(6):e21264.
- Theobald EJ, Ettinger AK, Burgess HK, DeBey LB, Schmidt NR, Froehlich HE, Wagner C, et al. 2015. Global change and local solutions: tapping the unrealized potential of citizen science for biodiversity research. Biol Conserv. 181:236–244.
- Toogood M. 2013. Engaging publics: biodiversity data collection and the geographies of citizen science. Geography Compass. 7(9):611–621.
- Weber J. 2014. About pericopsis. Accessed May 05, 2021. http://pericopsis.org/trees/about.php.
- Whittaker RH. 1965. Dominance and diversity in land plant communities: numerical relations of species express the importance of competition in community function and evolution. Science. 147(3655):250–260.
- Wiggins A, Crowston K. 2011. From conservation to crowdsourcing: A typology of citizen science. In: 44th Hawaii international conference on system sciences. IEEE; January; p. 1–10.