
ABSTRACT
Type 2 diabetes mellitus (T2DM) is a leading global health concern. The study estimated the lncRNA UCA1 expression in peripheral blood of T2DM patients and its clinical value for diagnosing T2DM and predicting cardiovascular disease (CVD) in T2DM. A total of 80 T2DM patients (37 cases with T2DM complicated with CVD) were selected, with another 70 healthy people as controls. UCA1 expression was measured, and its diagnostic efficacy for T2DM was assessed. Median UCA1 level divided T2DM patients into UCA1 low expression group and UCA1 high expression group, and its correlation with clinical indicators of T2DM patients was analyzed. Relevance between UCA1 and SADN, YKL-40 or CTRP-3 in T2DM complicated with CVD patients, and independent correlation between UCA1 and CVD in T2DM were evaluated. UCA1 was downregulated in T2DM patients, associated with clinical indicators, and assisted the diagnosis of T2DM. UCA1 was positively-correlated with SADN and CTRP-3, and negatively interrelated with YKL-40. UCA1 low expression was independently linked with and predicted an enhanced risk of CVD in T2DM patients. Briefly, UCA1 low expression assists the diagnosis of T2DM and predicts an increased risk of CVD in T2DM patients.
Introduction
Diabetes mellitus is a metabolic disorder featured by chronic high blood glucose due to a deficiency in insulin action, insulin secretion, or both, which is commonly correlated with different chronic pathologies (Kousaxidis et al. Citation2020). Globally, diabetes mellitus afflicts approximately 1 in 11 adults, 90% of whom are diagnosed with type 2 diabetes mellitus (T2DM) (Zheng et al. Citation2018). T2DM is manifested as the occurrence of postprandial and fasting hyperglycemia, which can induce multiple life-threatening comorbidities and complications (Javeed and Matveyenko Citation2018). Since obesity is a common cause of T2DM, the morbidity of T2DM remains increasing among children and adolescents (Zenno and Nadler Citation2021). Indeed, dysfunction of pancreatic β cells and insulin resistance (IR) are major pathophysiologic characteristics of T2DM (Palacios et al. Citation2019). Chronic vascular complications are leading contributors to death and disability in T2DM patients (Yang and Han Citation2020). Among these, cardiovascular disease (CVD) is the major cause of mortality in T2DM patients (Strain and Paldanius Citation2018), which is also the most frequent contributor to mortality worldwide (Deerochanawong et al. Citation2019). Besides, inflammation-associated proteins are crucial players in the pathogenesis of CVD in patients with T2DM (Garcia-Fontana et al. Citation2015; Jaiswal and Libby Citation2020; Li et al. Citation2021). Therefore, exploring the inflammation-related biomarkers for T2DM and its CVD complications is essential.
Adiponectin is a polypeptide protein composed of 244 amino acids, which is encoded on chromosome 3q27 (Nagaraju et al. Citation2016). Adiponectin regulates inflammation, cell proliferation, energy homeostasis, and insulin sensitivity, and low serum adiponectin (SADN) is linked with increased levels of insulin-like growth factors and vascular endothelial growth factors (Gu et al. Citation2018). Human cartilage glycoprotein 39 (YKL-40), a chitin-binding lectin, is a member of the glycosyl hydrolase family 1 (Muszynski et al. Citation2017). YKL-40 is produced by various cells such as activated macrophages and neutrophils in diverse tissues and is associated with inflammation and vascular smooth muscle cells (VSMCs), which are involved in the mechanism of cardiovascular disease, diabetes, and cancer (Umapathy et al. Citation2018). In addition, C1q/tumor necrosis factor NF-Related Protein 3 (CTRP3) belongs to the CTRPs family of secretory cytokines and is capable of regulating diverse metabolic processes (Youngstrom et al. Citation2020). At present, the diagnostic tools for T2DM and related complications have been preliminarily formed, but they are not complete, and the clinical parameters used for T2DM diagnosis are non-specific parameters. Therefore, it is of great significance to explore a non-invasive biomarker with high specificity for the diagnosis of T2DM and to assess the risk of T2DM-related complications.
Long non-coding RNAs (lncRNAs) refer to the RNA molecules with a length of more than 200 nucleotides and regulate multiple biological processes including cell invasion, migration, apoptosis, and growth (Wang et al. Citation2018). LncRNAs can be regarded as the mediators of IR in T2DM (Liu et al. Citation2019) and are involved in the development of T2DM and CVD (Suwal et al. Citation2019). In particular, urothelial carcinoma-associated 1 (UCA1) has strong specificity and is easily detected in urine, plasma, and serum (Liu et al. Citation2021). LncRNA UCA1 is differentially expressed in lymphatic endothelial cells of diabetic patients (Qi et al. Citation2017), and it can stimulate the repair of hyperglycemic VSMCs by negatively modulating miR-582-5p (Yang and Han Citation2020). However, there are limited reports on the role of lncRNA UCA1 in T2DM. Therefore, this study investigated the lncRNA UCA1 expression in peripheral blood of T2DM patients and its clinical value in the diagnosis of T2DM and assessment of cardiovascular complications.
Materials and methods
Ethics statement
The study was approved by the academic ethics committee of The First Affiliated Hospital of Harbin Medical University. All participants signed the informed consent.
Study subjects
A total of 80 T2DM patients admitted to The First Affiliated Hospital of Harbin Medical University from January to October 2020 were enrolled in the T2DM group, including 51 males and 29 females, aged 31–73 years, with an average age of 55.9 ± 9.2 years, all of whom met the 1999 WHO diagnostic and classification criteria of T2DM (Alberti and Zimmet Citation1998). The T2DM group was subdivided into the following two groups: 43 cases with T2DM and no CVD as the T2DM + CVD− group and 37 cases with T2DM complicated with CVD as the T2DM + CVD+ group. Meanwhile, another 70 healthy subjects who underwent physical examination in The First Affiliated Hospital of Harbin Medical University during the same period were selected into the normal group, including 45 males and 25 females.
Inclusion and exclusion criteria
All included T2DM patients (age > 18 years) were in accord with the diagnostic criteria for T2DM issued by WHO in 1999: besides the diabetic symptoms, patients had the manifestation of random blood glucose ≥ 11.1 mmol/L, fasting plasma glucose (FPG) ≥ 7.0 mmol/L or 2-h oral glucose tolerance test ≥ 11.1 mmol/L, which needed to be confirmed by another test.
T2DM complicated with CVD referred to the T2DM patients with the clear occurrence and onset of CVD (including hypertension and hyperlipidemia), or without typical symptoms of CVD, but with abnormal heart disease indicated by electrocardiogram or echocardiography (Shuangying Citation2016).
Exclusion criteria were as follows: (1) patients with T1DM, special types of DM, and acute complications; (2) patients with tumors, acute and chronic infections, blood system diseases, or liver and kidney dysfunctions; (3) patients with rheumatic diseases or other endocrine and metabolic diseases; (4) women who were pregnant, breastfeeding, or those who have been taking contraceptive pills for a long time.
Detection of clinical and pathological characteristics
The following clinical indicators were recorded at enrollment of the study population: age, gender, body mass index (BMI), smoking, systolic blood pressure (SBP), diastolic blood pressure (DBP), and mean arterial pressure (MAP) = DBP + 1/3* (SBP-DBP). FPG level was determined using the glucose oxidase method. The automatic biochemical analyzer (Beckman Coulter, Miami, FL, USA) was used to measure the triacylglycerol (TG), total cholesterol (TC), fasting insulin (FINS), high-density lipoprotein cholesterol (HDL-C), and low-density lipoprotein cholesterol (LDL-C). Insulin resistant index (IRI) and insulin sensitivity index (ISI) were calculated based on the following formulas: IRI = FPG*FINS/22.5, and ISI = 1/(FPG*FINS). SADN was measured using the radioimmunoassay kit (Linco Research, St. Charles, MO, USA). The fasting venous blood (8 mL) was collected from the patients in the morning on the next day after admission and then centrifuged at 2805 g for 5 min to separate the supernatant, followed by storing at −80°C for future detection. Double-antibody sandwich enzyme-linked immunosorbent assay (ELISA) was performed to detect the levels of YKL-40 and CTRP-3 after thawing serum samples at room temperature. The kits were purchased from Cusabio (Wuhan, China) and the specific operations were performed in strict accordance with the instructions.
Reverse transcription quantitative polymerase chain reaction (RT-qPCR)
Total RNA was extracted from the peripheral blood serum using the TRIzol reagent (Invitrogen, Carlsbad, CA, USA) and then reverse transcribed into cDNA using PrimeScriptRT reagent (TaKaRa, Otsu, Shiga, Japan). Subsequently, RT-qPCR was employed to detect the obtained cDNA using SYBR®PremiexExTaqTM (TaKaRa, Otsu, Shiga, Japan). β-actin was used as an internal reference. The 2−ΔΔCt method was adopted to calculate the relative expression. Primer sequences were shown in Table .
Table 1. Primer sequences.
Data analysis
SPSS 21.0 software (IBM Corp, Armonk, NY, USA) and GraphPad Prism 6.0 software (GraphPad Software Inc., San Diego, CA, USA) were adopted for the statistical analysis and plotting of data. Shapiro-Wilk test was used to examine the normal distribution and the measurement data of normal distribution were expressed as mean ± standard deviation (SD). The data with skewed distribution were naturally log-transformed to conform to the normal distribution and then subjected to the statistical calculation. An independent sample t-test was performed for comparisons between groups. The enumeration data were exhibited as the number of cases and percentage (n/%). Receiver operating characteristic (ROC) curve was employed to evaluate the diagnostic efficacy of lncRNA UCA1 for T2DM and to gain the cut-off value. Logistic binary regression was used to assess the influencing factors of T2DM complication outcomes, and the Enter method was introduced to screen independent variables. The P value was acquired from a two-sided test, and P value < 0.05 was considered statistically significant.
Results
Comparative analysis of clinical data in T2DM patients and healthy subjects
In the enrolled study subjects, the T2DM group (N = 80) and the normal group (N = 70) showed no significant differences in gender, age, DBP, BMI, and smoking, while presenting prominent differences in SBP, MAP, FPG, FINS, ISI, IRI, TC, TG, HDL-C, LDL-C, and plasminogen activator inhibitor-1 (PAS-1) (all P < 0.01, Table ).
Table 2. Comparisons of clinical baseline characteristics between Normal group and T2DM group.
LncRNA UCA1 was downregulated in peripheral blood of T2DM patients and had high diagnostic efficacy
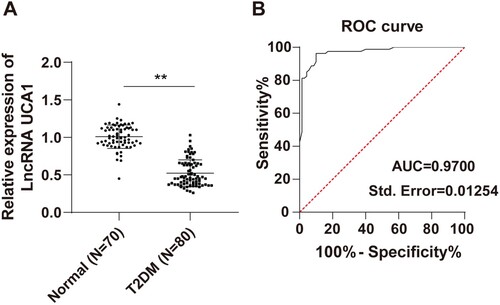
The differences in lncRNA UCA1 expression in peripheral blood between the T2DM group and the normal group were compared in this study, and the results showed that lncRNA UCA1 was significantly decreased in peripheral blood of T2DM patients compared with normal subjects (P < 0.01, Figure A). The ROC curve was further plotted for distinguishing T2DM patients from normal healthy people based on the expression of lncRNA UCA1 (P < 0.01, Figure B). The area under the curve (AUC) was 0.9700 and the cutoff value was 0.8600, with 96.25% sensitivity and 90.00% specificity. These results indicated that serum lncRNA UCA1 level < 0.8600 could assist the diagnosis of T2DM.
Figure 1. LncRNA UCA1 was downregulated in peripheral blood of T2DM patients and had high diagnostic efficacy. (A) RT-qPCR was performed to detect the expression of lncRNA UCA1 in the serum; (B) ROC curve was adopted to analyze the diagnostic efficacy of lncRNA UCA1 in T2DM patients. Independent sample t test was employed to check panel A. ROC curve was used to analyze panel B. **p < 0.01.
Correlation analysis of lncRNA UCA1 expression and clinical indicators of T2DM patients
To further investigate the correlation between lncRNA UCA1 and clinical indicators in T2DM patients, T2DM patients were divided into the high-expression group (N = 40) and low-expression group (N = 40) according to the median lncRNA UCA1 level. The analysis results revealed that the lncRNA UCA1 low-expression group had higher levels of FPG, FINS, TC, TG, and PAS-1 and lower levels in ISI and IRI than the lncRNA UCA1 high-expression group (all P < 0.01, Table ).
Table 3. Comparisons of clinical baseline characteristics between lncRNA UCA1 low expression group and lncRNA UCA1 high expression group in T2DM patients.
Correlation analysis of lncRNA UCA1 with SADN, YKL-40, and CTRP-3
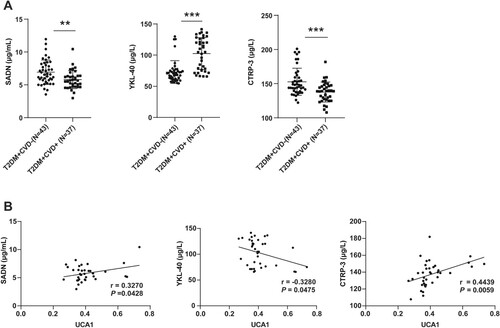
It has been reported that lncRNA UCA1 induces the repair of hyperglycemic VSMCs by negatively regulating miR-582-5p (Yang and Han Citation2020). SADN and YKL-40 are involved in the generation, growth, proliferation, differentiation, and remodeling processes of blood vessels in multiple disorders (Nathan et al. Citation2004; Rathcke and Vestergaard Citation2006; Freitas Lima et al. Citation2015). Additionally, CTRP-3 participates in the proliferative responses of blood vessels in multiple chronic diseases (Chen, Qin, et al. Citation2019). The previous evidence suggests that SADN, YKL-40, and CTRP-3 may serve as potential biomarkers of T2DM+ CVD+. To further investigate whether lncRNA UCA1 in peripheral blood is associated with T2DM+ CVD+, the expression levels of SADN, YKL-40, and CTRP-3 in the peripheral blood of T2DM + CVD− group and T2DM + CVD+ group were determined using ELISA assay. The results suggested that the T2DM + CVD+ group had lower SADN and CTRP-3 levels and markedly higher YKL-40 level than the T2DM + CVD− group (Figure A, all P < 0.01). Next, the relevance between biomarkers and lncRNA UCA1 in peripheral blood of T2DM+ CVD+ patients was analyzed by the Pearson correlation, which demonstrated that lncRNA UCA1 was remarkably positively correlated with SADN and CTRP-3 and negatively linked with YKL-40 (Figure B, all P < 0.05), indicating that lncRNA UCA1 low expression may be associated with the incidence of CVD in T2DM.
Figure 2. Correlation analysis of lncRNA UCA1 with SADN, YKL-40, and CTRP-3. (A) The levels of SADN, YKL-40, and CTRP-3 in peripheral blood were measured using ELISA kits; (B) The correlation between lncRNA UCA1 and SADN, YKL-40, or CTRP-3 respectively was analyzed by the Pearson correlation. Independent sample t test was used to check panel A. Pearson correlation was employed to analyze panel B. **p < 0.01, ***p < 0.001. The μg/L and μg/mL were the concentration units.
LncRNA UCA1 low expression predicted a high incidence of CVD in T2DM
In the pathogenesis of CVD in diabetes, hyperglycemia induces many changes in metabolic physiology and function, thus affecting the endothelium. As indicated, the number of patients with CVD was 31 cases (77.50%) in T2DM patients with lncRNA UCA1 low expression, while the number of patients with CVD was 6 cases (15.00%) in T2DM patients with lncRNA UCA1 high expression. The incidence of CVD was prominently higher in T2DM patients with lncRNA UCA1 low expression than in T2DM patients with lncRNA UCA1 high expression (P < 0.05).
To further investigate whether lncRNA UCA1 is independently correlated with the occurrence of T2DM+ CVD+, the gender, age, DBP, BMI, smoking, SBP, MAP, FPG, FINS, ISI, IRI, TC, TG, HDL-C, PAS-1, SADN, YKL-40, and CTRP-3 were enrolled in the logistic multi-factor regression analysis. Logistic regression analysis was performed to screen the risk factors for T2DM+ CVD+, with CVD as the dependent variable and biochemical indexes as the independent variables. The results showed that lncRNA UCA1 was a risk factor for CVD in T2DM patients (Table , P < 0.05), indicating that T2DM patients with lncRNA UCA1 low expression may have an increased risk of CVD relative to those with lncRNA UCA1 high expression (OR = 0, 95% CI: 0∼3.268).
Table 4. LncRNA UCA1 low expression increased the risk of CVD in T2DM patients.
Discussion
The prevalence of T2DM is increasing worldwide, especially in middle-income countries (Bosun-Arije et al. Citation2020). T2DM is correlated with an enhanced risk of lethal CVD, which is the leading cause of mortality and morbidity in diabetes (Petrie et al. Citation2018). Several lncRNAs are accumulated in pancreatic islets and associated with T2DM (Zhou et al. Citation2021) and CVD (Li et al. Citation2019). In this study, we explored the expression pattern and clinical value of lncRNA UCA1 in peripheral blood of T2DM patients.
A previous report reveals that SBP and LDL-C are vital predictors of T2DM (Erfanian Omidvar et al. Citation2019). MAP is a significant indicator for differentiating T2DM patients from normal people (Guo et al. Citation2020). IR is one of the key features of T2DM (Chen, Sun, et al. Citation2019). Firstly, we analyzed the baseline clinical data of T2DM patients and healthy people. The results showed that the levels of SBP, MAP, FPG, FINS, ISI, IRI, TC, TG, HDL-C, LDL-C, and PAS-1 were different. The elevation of SBP increases the risk of T2DM (Aikens et al. Citation2017). In agreement with our results, rats with T2DM have increased FPG and FINS (Tian et al. Citation2021). Increased TC, TG, and reduced HDL-C levels are risk factors for the incidence of T2DM (Cheng, Liu, et al. Citation2019; Cui et al. Citation2019). Compelling evidence suggests that PAS-1 is elevated in patients with T2DM (Bayomy et al. Citation2017). Briefly, analyzing these indexes which presented different levels in T2DM individuals was of certain value for clinical diagnosis of T2DM.
It is noteworthy that lncRNAs play an essential role in several complex disorders, such as T2DM (Mohamadi et al. Citation2019). Importantly, UCA1 is differentially expressed in T2DM patients (Qi et al. Citation2017). Hence, the expression of UCA1 in peripheral blood was measured and the results unveiled that UCA1 was lowly expressed in T2DM patients, consistent with previous research (Yang and Han Citation2020). Subsequently, the ROC curve of UCA1 in T2DM observed that the AUC was 0.9700 and the cutoff value was 0.8600, with 96.25% sensitivity and 90.00% specificity. LncRNAs play a remarkable role in the diagnosis of T2DM (Kazerouni et al. Citation2020). Our study initially illustrated that serum lncRNA UCA1 level < 0.8600 can assist the T2DM diagnosis. However, the included sample size was small, and hence expanding the sample size was necessitated for an in-depth study.
Increasing studies indicate that lncRNAs emerge as potential biomarkers and clinical therapeutic targets for T2DM (Mohamadi et al. Citation2019; Hu et al. Citation2020; Ma et al. Citation2020). Furthermore, we analyzed the correlation between the UCA1 level and clinical indexes of T2DM patients. The results suggested that in UCA1-downregulated T2DM patients, FPG, FINS, TC, TG, and PAS-1 were elevated, while ISI and IRI were decreased. UCA1 upregulation can effectively promote glucose uptake and lactate output, whereas UCA1 silencing has the opposite impact (Liu et al. Citation2020). The altered expression of lncRNAs (including UCA1) may be associated with the response to insulin stimulus (Qi et al. Citation2017). However, evidence favoring the clinical value of UCA1 for T2DM is sparse. Our results elicited the clinical diagnostic efficacy of UCA1 in T2DM and its correlation with clinical indicators of T2DM for the first time.
Interestingly, individuals with T2DM have two-fold elevated risks of CVD (Cheng et al. Citation2021). SADN is linked with the incidence of microvascular complications and T2DM (Wang et al. Citation2020). YKL-40 is involved in the process of T2DM, lipid metabolism, and atherosclerosis (Chen, Zheng, et al. Citation2019; Dieset et al. Citation2019). CTRP-3 is a key player in the regulation of glucose metabolism and belongs to the family of CTRPs, which exerts biological effects on the cardiovascular system (Choi et al. Citation2012; Wang et al. Citation2017). Therefore, we explored the relationship of UCA1 with SADN, YKL-40, and CTRP-3 in T2DM complicated with CVD. ELISA found that SADN and CTRP-3 levels were evidently reduced and YKL-40 expression was remarkably increased in T2DM complicated with CVD patients. In addition, the Pearson correlation illustrated the positive correlation of UCA1 with SADN and CTRP-3 and the negative correlation between UCA1 and YKL-40. Similarly, adiponectin level is decreased in patients with T2DM (Tong et al. Citation2017), and low SADN level is linked with CVD (Peters et al. Citation2018). Plasma CTRP-3 is lower in T2DM patients and is strongly correlated with insulin resistance, glucose, and lipid metabolism (Qu et al. Citation2015). Moreover, CTRP-3 exerts beneficial effects on the cardiovascular system and is diminished in myocardial infarction (Sawicka et al. Citation2016). There is evidence to suggest that YKL-40 is enhanced in obesity-related T2DM and CVD (Thomsen et al. Citation2015). Equally importantly, UCA1 regulates the migration and proliferation of VSMCs (Xu et al. Citation2020) and is involved in cardiovascular injury (Tian et al. Citation2018). These results indicated the potential association of UCA1 and CVD complications in T2DM. Moreover, we found that UCA1-downregulated T2DM patients had elevated risks of CVD, and UCA1 was a risk factor for CVD in patients with T2DM. Altogether, UCA1 low expression was correlated with the incidence and increased the risk of CVD in T2DM patients.
Conclusion
In conclusion, this study elucidated that lncRNA UCA1 was downregulated in the peripheral blood of T2DM patients, and the low expression of UCA1 could assist the diagnosis of T2DM and correlate with the increased risk of CVD complications. Our findings provided a new reference for the diagnosis of T2DM, the evaluation of the severity, and the prediction of cardiovascular complications. However, the number of cases and events included was small. In future studies, we shall further expand the sample size and perform a multi-center prospective study to increase the reliability of the results to clarify the diagnostic and prognostic ability of UCA1.
Ethics approval
The study was approved by the academic ethics committee of The First Affiliated Hospital of Harbin Medical University (Approval number 2020-KY-02-27-005). All participants signed the informed consent.
Authors’ contributions
HY contributed to the study concepts, study design, and guarantor of integrity of the entire study; HY contributed to the literature research; HT contributed to the experimental studies and data acquisition; HT, LS contributed to the manuscript preparation and LS contributed to the manuscript editing and review. All authors read and approved the final manuscript.
Availability of data and materials
The data that support the findings of this study are available in figshare, reference number https://doi.org/10.6084/m9.figshare.20708902.v1.
Disclosure statement
No potential conflict of interest was reported by the author(s).
References
- Aikens RC, Zhao W, Saleheen D, Reilly MP, Epstein SE, Tikkanen E, Salomaa V, Voight BF. 2017. Systolic blood pressure and risk of type 2 diabetes: a Mendelian randomization study. Diabetes. 66(2):543–550.
- Alberti KG, Zimmet PZ. 1998. Definition, diagnosis and classification of diabetes mellitus and its complications. Part 1: diagnosis and classification of diabetes mellitus. Provisional report of a WHO consultation. Diabetic Med 15:539–553.
- Bayomy O, Rao AD, Garg R, Vaidya A, Kotin AR, Reiber B, Nijmeijer S, Di Carli MF, Jerosch-Herold M, Kwong RY, Adler GK. 2017. Plasminogen activator inhibitor-1 and pericardial fat in individuals with type 2 diabetes mellitus. Metab Syndr Relat Disord. 15(6):269–275.
- Bosun-Arije FS, Ling J, Graham Y, Hayes C. 2020. Organisational factors influencing non-pharmacological management of type 2 diabetes mellitus (T2DM) in public hospitals across Lagos, Nigeria: a qualitative study of nurses’ perspectives. Diabetes Res Clin Pract. 166:108288.
- Chen L, Qin L, Liu X, Meng X. 2019. CTRP3 alleviates Ox-LDL-induced inflammatory response and endothelial dysfunction in mouse aortic endothelial cells by activating the PI3K/Akt/eNOS pathway. Inflammation. 42(4):1350–1359.
- Chen L, Sun X, Xiao H, Xu F, Yang Y, Lin Z, Chen Z, Quan S, Huang H. 2019. PAQR3 regulates phosphorylation of FoxO1 in insulin-resistant HepG2 cells via NF-κB signaling pathway. Exp Cell Res. 381(2):301–310.
- Chen L, Zheng J, Xue Q, Zhao Y. 2019. YKL-40 promotes the progress of atherosclerosis independent of lipid metabolism in apolipoprotein E−/− mice fed a high-fat diet. Heart Vessels. 34(11):1874–1881.
- Cheng C, Liu Y, Sun X, Yin Z, Li H, Zhang M, Zhang D, Wang B, Ren Y, Zhao Y, et al. 2019. Dose-response association between the triglycerides: high-density lipoprotein cholesterol ratio and type 2 diabetes mellitus risk: the rural Chinese cohort study and meta-analysis. J Diabetes. 11(3):183–192.
- Cheng CF, Lin YJ, Lin MC, Liang WM, Chen CC, Chen CH, Wu JY, Lin TH, Liao CC, Huang SM, et al. 2021. Genetic risk score constructed from common genetic variants is associated with cardiovascular disease risk in type 2 diabetes mellitus. J Gene Med. 23(2):e3305.
- Choi KM, Hwang SY, Hong HC, Yang SJ, Choi HY, Yoo HJ, Lee KW, Nam MS, Park YS, Woo JT, et al. 2012. C1q/TNF-related protein-3 (CTRP-3) and pigment epithelium-derived factor (PEDF) concentrations in patients with type 2 diabetes and metabolic syndrome. Diabetes. 61(11):2932–2936.
- Cui J, Ma P, Sun JP, Baloch Z, Yin F, Xin HL, Ren J, Tan JB, Wang BL. 2019. The ability of baseline triglycerides and total cholesterol concentrations to predict incidence of type 2 diabetes mellitus in Chinese men and women: a longitudinal study in Qingdao, China. Biomed Environ Sci. 32(12):905–913.
- Deerochanawong C, Chan SP, Matawaran BJ, Sheu WH, Chan J, Man NH, Suastika K, Khoo CM, Yoon KH, Luk A, et al. 2019. Use of sodium-glucose co-transporter-2 inhibitors in patients with type 2 diabetes mellitus and multiple cardiovascular risk factors: an Asian perspective and expert recommendations. Diabetes Obes Metab. 21(11):2354–2367.
- Dieset I, Morch RH, Hope S, Hoseth EZ, Reponen EJ, Gran JM, Aas M, Michelsen AE, Reichborn-Kjennerud T, Nesvag R, et al. 2019. An association between YKL-40 and type 2 diabetes in psychotic disorders. Acta Psychiatr Scand. 139(1):37–45.
- Erfanian Omidvar M, Ghaedi H, Kazerouni F, Kalbasi S, Shanaki M, Miraalamy G, Zare A, Rahimipour A. 2019. Clinical significance of long noncoding RNA VIM-AS1 and CTBP1-AS2 expression in type 2 diabetes. J Cell Biochem. 120(6):9315–9323.
- Freitas Lima LC, Braga VA, do Socorro de Franca Silva M, Cruz JC, Sousa Santos SH, de Oliveira Monteiro MM, Balarini CM. 2015. Adipokines, diabetes and atherosclerosis: an inflammatory association. Front Physiol. 6:304.
- Garcia-Fontana B, Morales-Santana S, Longobardo V, Reyes-Garcia R, Rozas-Moreno P, Garcia-Salcedo JA, Munoz-Torres M. 2015. Relationship between proinflammatory and antioxidant proteins with the severity of cardiovascular disease in type 2 diabetes mellitus. Int J Mol Sci. 16(5):9469–9483.
- Gu L, Cao C, Fu J, Li Q, Li DH, Chen MY. 2018. Serum adiponectin in breast cancer: a meta-analysis. Medicine (Baltimore). 97(29):e11433.
- Guo C, Qin P, Li Q, Zhang D, Tian G, Liu D, Liu L, Cheng C, Chen X, Qie R, et al. 2020. Association between mean arterial pressure and risk of type 2 diabetes mellitus: the Rural Chinese Cohort Study. Prim Care Diabetes. 14(5):448–454.
- Hu W, Ding Y, Wang S, Xu L, Yu H. 2020. The construction and analysis of the aberrant lncRNA-miRNA-mRNA network in adipose tissue from type 2 diabetes individuals with obesity. J Diabetes Res. 2020:3980742.
- Jaiswal S, Libby P. 2020. Clonal haematopoiesis: connecting ageing and inflammation in cardiovascular disease. Nat Rev Cardiol. 17(3):137–144.
- Javeed N, Matveyenko AV. 2018. Circadian etiology of type 2 diabetes mellitus. Physiology (Bethesda). 33(2):138–150.
- Kazerouni F, Bayani A, Asadi F, Saeidi L, Parvizi N, Mansoori Z. 2020. Type2 diabetes mellitus prediction using data mining algorithms based on the long-noncoding RNAs expression: a comparison of four data mining approaches. BMC Bioinformatics. 21(1):372.
- Kousaxidis A, Petrou A, Lavrentaki V, Fesatidou M, Nicolaou I, Geronikaki A. 2020. Aldose reductase and protein tyrosine phosphatase 1B inhibitors as a promising therapeutic approach for diabetes mellitus. Eur J Med Chem. 207:112742.
- Li J, Wang C, Liu J, Yu Y, Liu Y, Peng Q, Liu H, Guan X. 2021. A feedback loop: interactions between inflammatory signals and clonal hematopoiesis in cardiovascular disease. Mol Biol Rep. 48(4):3785–3798.
- Li M, Duan L, Li Y, Liu B. 2019. Long noncoding RNA/circular noncoding RNA-miRNA-mRNA axes in cardiovascular diseases. Life Sci. 233:116440.
- Liu HE, Shi HH, Luo XJ. 2020. Upregulated long noncoding RNA UCA1 enhances warburg effect via miR-203/HK2 axis in esophagal cancer. J Oncol. 2020:8847687.
- Liu SX, Zheng F, Xie KL, Xie MR, Jiang LJ, Cai Y. 2019. Exercise reduces insulin resistance in type 2 diabetes mellitus via mediating the lncRNA MALAT1/MicroRNA-382-3p/Resistin Axis. Mol Ther Nucleic Acids. 18:34–44.
- Liu Z, Wang Y, Yuan S, Wen F, Liu J, Zou L, Zhang J. 2021. Regulatory role of long non-coding RNA UCA1 in signaling pathways and its clinical applications. Oncol Lett. 21(5):404.
- Ma Q, Wang L, Yang Y, Su Y, Wang T, Hou Q, Cai R, Wang Z, Yao H. 2020. Association between lncRNA and GCKR gene in type 2 diabetes mellitus. Clin Chim Acta. 501:66–71.
- Mohamadi M, Ghaedi H, Kazerouni F, Erfanian Omidvar M, Kalbasi S, Shanaki M, Miraalamy G, Rahimipour A. 2019. Deregulation of long noncoding RNA SNHG17 and TTC28-AS1 is associated with type 2 diabetes mellitus. Scand J Clin Lab Invest. 79(7):519–523.
- Muszynski P, Groblewska M, Kulczynska-Przybik A, Kulakowska A, Mroczko B. 2017. YKL-40 as a potential biomarker and a possible target in therapeutic strategies of Alzheimer’s disease. Curr Neuropharmacol. 15(6):906–917.
- Nagaraju GP, Rajitha B, Aliya S, Kotipatruni RP, Madanraj AS, Hammond A, Park D, Chigurupati S, Alam A, Pattnaik S. 2016. The role of adiponectin in obesity-associated female-specific carcinogenesis. Cytokine Growth Factor Rev. 31:37–48.
- Nathan RA, Sorkness CA, Kosinski M, Schatz M, Li JT, Marcus P, Murray JJ, Pendergraft TB. 2004. Development of the asthma control test: a survey for assessing asthma control. J Allergy Clin Immunol. 113(1):59–65.
- Palacios OM, Kramer M, Maki KC. 2019. Diet and prevention of type 2 diabetes mellitus: beyond weight loss and exercise. Expert Rev Endocrinol Metab. 14(1):1–12.
- Peters KE, Davis WA, Beilby J, Hung J, Bruce DG, Davis TME. 2018. The relationship between circulating adiponectin, ADIPOQ variants and incident cardiovascular disease in type 2 diabetes: the Fremantle Diabetes Study. Diabetes Res Clin Pract. 143:62–70.
- Petrie JR, Guzik TJ, Touyz RM. 2018. Diabetes, hypertension, and cardiovascular disease: clinical insights and vascular mechanisms. Can J Cardiol. 34(5):575–584.
- Qi M, Zhou Q, Zeng W, Shen M, Liu X, Luo C, Long J, Chen W, Zhang J, Yan S. 2017. Analysis of long non-coding RNA expression of lymphatic endothelial cells in response to type 2 diabetes. Cell Physiol Biochem. 41(2):466–474.
- Qu H, Deng M, Wang H, Wei H, Liu F, Wu J, Deng H. 2015. Plasma CTRP-3 concentrations in Chinese patients with obesity and type II diabetes negatively correlate with insulin resistance. J Clin Lipidol. 9(3):289–294.
- Rathcke CN, Vestergaard H. 2006. YKL-40, a new inflammatory marker with relation to insulin resistance and with a role in endothelial dysfunction and atherosclerosis. Inflamm Res. 55(6):221–227.
- Sawicka M, Janowska J, Chudek J. 2016. Potential beneficial effect of some adipokines positively correlated with the adipose tissue content on the cardiovascular system. Int J Cardiol. 222:581–589.
- Shuangying L. 2016. Analysis of clinical characteristics of newly diagnosed type 2 diabetes mellitus patients complicated with cardiovascular disease. Chinese Remedies Clinics. 16(11):1667–1668.
- Strain WD, Paldanius PM. 2018. Diabetes, cardiovascular disease and the microcirculation. Cardiovasc Diabetol. 17(1):57.
- Suwal A, Hao JL, Liu XF, Zhou DD, Pant OP, Gao Y, Hui P, Dai XX, Lu CW. 2019. NONRATT021972 long-noncoding RNA: a promising lncRNA in diabetes-related diseases. Int J Med Sci. 16(6):902–908.
- Thomsen SB, Gjesing AP, Rathcke CN, Ekstrom CT, Eiberg H, Hansen T, Pedersen O, Vestergaard H. 2015. Associations of the inflammatory marker YKL-40 with measures of obesity and dyslipidaemia in individuals at high risk of type 2 diabetes. PLoS One. 10(7):e0133672.
- Tian J, Zhao Y, Wang L, Li L. 2021. Role of TLR4/MyD88/NF-κB signaling in heart and liver-related complications in a rat model of type 2 diabetes mellitus. J Int Med Res. 49(3):030006052199759.
- Tian S, Yuan Y, Li Z, Gao M, Lu Y, Gao H. 2018. LncRNA UCA1 sponges miR-26a to regulate the migration and proliferation of vascular smooth muscle cells. Gene. 673:159–166.
- Tong HV, Luu NK, Son HA, Hoan NV, Hung TT, Velavan TP, Toan NL. 2017. Adiponectin and pro-inflammatory cytokines are modulated in Vietnamese patients with type 2 diabetes mellitus. J Diabetes Investig. 8(3):295–305.
- Umapathy D, Dornadula S, Krishnamoorthy E, Mariappanadar V, Viswanathan V, Ramkumar KM. 2018. YKL-40: a biomarker for early nephropathy in type 2 diabetic patients and its association with inflammatory cytokines. Immunobiology. 223(11):718–727.
- Wang J, Su Z, Lu S, Fu W, Liu Z, Jiang X, Tai S. 2018. LncRNA HOXA-AS2 and its molecular mechanisms in human cancer. Clin Chim Acta. 485:229–233.
- Wang LK, Wang H, Wu XL, Shi L, Yang RM, Wang YC. 2020. Relationships among resistin, adiponectin, and leptin and microvascular complications in patients with type 2 diabetes mellitus. J Int Med Res. 48(4):300060519870407.
- Wang S, Ling Y, Liang W, Shen L. 2017. Association of serum C1q/TNF-related protein-3 (CTRP-3) in patients with coronary artery disease. BMC Cardiovasc Disord. 17(1):210.
- Xu Z, Zuo Z, Dong D, Liu J, Tang Y, Gu Y, Liu H. 2020. Downregulated lncRNA UCA1 accelerates proliferation and migration of vascular smooth muscle cells by epigenetic regulation of MMP9. Exp Ther Med. 19(6):3589–3594.
- Yang JL, Han NH. 2020. LncRNA UCA1 stimulates the repair of hyperglycemic vascular smooth muscle cells through targeting miR-582-5p. Eur Rev Med Pharmacol Sci. 24(24):12859–12866.
- Youngstrom DW, Zondervan RL, Doucet NR, Acevedo PK, Sexton HE, Gardner EA, Anderson JS, Kushwaha P, Little HC, Rodriguez S, et al. 2020. CTRP3 regulates endochondral ossification and bone remodeling during fracture healing. J Orthop Res. 38(5):996–1006.
- Zenno A, Nadler EP. 2021. Surgical treatment of type 2 diabetes mellitus in youth. Adv Exp Med Biol. 1307:321–330.
- Zheng Y, Ley SH, Hu FB. 2018. Global aetiology and epidemiology of type 2 diabetes mellitus and its complications. Nat Rev Endocrinol. 14(2):88–98.
- Zhou AX, Mondal T, Tabish AM, Abadpour S, Ericson E, Smith DM, Knoll R, Scholz H, Kanduri C, Tyrberg B, Althage M. 2021. The long noncoding RNA TUNAR modulates Wnt signaling and regulates human beta-cell proliferation. Am J Physiol Endocrinol Metab. 320(4):E846–E857.