 ?Mathematical formulae have been encoded as MathML and are displayed in this HTML version using MathJax in order to improve their display. Uncheck the box to turn MathJax off. This feature requires Javascript. Click on a formula to zoom.
Abstract
Data analytics and programming skills are increasingly important in the humanities, especially in disciplines like linguistics due to the rapid growth of natural language processing (NLP) technologies. However, attitudes and perceptions of students as novice learners, and the attendant pedagogical implications, remain underexplored. This article reports a combined SWOT (strengths, weaknesses, opportunities, threats) and survey analysis of how postgraduate linguistics students reflect on internal qualities and external circumstances that affect their learning. SWOT is a popular self-reflective strategic planning tool by organizations. An innovative approach was used to classify students into four SWOT-defined learner dispositions (SO, ST, WO, and WT) based on their relative emphasis on strengths versus weaknesses, and opportunities versus threats. Scores on a modified Mathematics Attitude Survey measuring self-rated ABILITY, INTEREST, UTILITY, and PERSONAL GROWTH were then compared across these dispositions. Results reveal (i) some unexpected and interesting strengths/weaknesses/opportunities/threats, (ii) perceived internal traits (strengths/weaknesses) play a greater role than external traits (opportunities/threats) in shaping students’ attitudes, (iii) a paradox where more confident students tend to be less interested, and vice-versa. Pedagogical implications arising from the results are discussed with an eye on enhancing the teaching of data analytics and programming skills to this target population.
1 Introduction
The case for teaching quantitative skills across the curriculum (Steen Citation2001; Miller Citation2010) has been backed by research initiatives like analyses of student attitudes (Korey Citation2000; Bond, Perkins, and Ramirez Citation2012; Code et al. Citation2016; Chen et al. Citation2019) and pedagogical best practices (Jordan and Haines Citation2006). Recent developments have brought a renewed sense of urgency to these initiatives, even more so in contexts that are not typically associated with quantitative analysis. These developments range from emerging inter-disciplinary degree programs (James Jacob Citation2015) and fields like digital humanities (Berry Citation2012), to technologies like Natural Language Processing (NLP) that draw from linguistics and other humanities disciplines (Bender Citation2013). An obvious case-in-point is the advent of large language models like GPT, PaLM, and their growing generative AI applications. The teaching of analytic techniques for humanistic data and their implementation in programming languages like Python and R (Levshina Citation2015; Winter Citation2019; Tay Citation2020; Tay and Pan Citation2022) are thus becoming common in humanities degree programs.
Against this backdrop, our understanding of how these students feel about data analytics and programming literacy is lagging behind (Tay Citation2022, Citation2023). Relevant studies mostly employ survey methods on students from social science disciplines like sociology, psychology, and education, with results painting a mixed picture. Williams et al. (2020), for example, found that British sociology students tended to perceive their field as more humanistic than scientific, and a considerable number expressed anxiety about quantitative methods. Lavidas et al.’s (Citation2020) study of early childhood education students in Greece focused instead on how attitudes are correlated with perceived competence and engagement in learning, and how these are predictive of students’ eventual performance. Liau, Kiat, and Nie (Citation2015) had similar findings for psychology students in Malaysia, concluding that more collaborative pedagogy contributes toward positive attitude changes and performance in statistics courses. Languages and linguistics students—one of the most relevant target groups given the aforementioned growth of NLP—have nevertheless not been investigated in detail. Given the multifaceted nature of attitudes and perceptions, it is also desirable to diversify methods like questionnaires and interviews to include more critical self-reflective tools.
Addressing these gaps, this article reports a holistic investigation of postgraduate linguistics students’ perceptions of data analytics and programming literacy, in the setting of a university in Hong Kong. A self-reflective SWOT (Strengths, Weaknesses, Opportunities, Threats) analysis was used to elicit reflections on strengths, weaknesses, opportunities, and threats to learning, and classify students into different “learner dispositions.” A modified Mathematics Attitude Survey (Korey Citation2000) was then administered for further insight into the relationship between dispositions and attitudes. Lastly, classification models were used to evaluate if survey scores (as features) could reliably predict dispositions (as outcome labels), and potential applications discussed. Pedagogical implications stemming from the findings are elaborated, and future research directions outlined.
2 Combining SWOT with Surveys
SWOT is a popular strategic planning tool used by organizations to critically evaluate their strengths and weaknesses, as well as opportunities and threats in their environment (Dyson Citation2004). Strengths and weaknesses are “internal” elements while opportunities and threats are “external.” A SWOT analysis provides a framework of how an organization’s internal qualities, which are within control, (mis)align with uncontrollable external realities (Gürel and Tat Citation2017). Respondents are usually asked to list relevant points under each of the four elements and discuss them to discern emergent themes and formulate concrete actions (Chermack and Kasshanna Citation2007). The elements can be analyzed separately or combined in synergistic ways. An example of this synergy is a “SWOT matrix” () that intersects the elements.
Table 1 A SWOT matrix.
Discussing the intersection of identified strengths and opportunities (SO) may reveal opportunities that match existing strengths. Similarly, ST may suggest strengths that reduce vulnerability to threats, WO may suggest opportunities attainable by overcoming weaknesses, and WT may reveal weaknesses that increase vulnerability to threats. Collectively, these intersectional readings help organizations capitalize on opportunities and minimize weaknesses to the greatest extent possible (Pahl and Richter Citation2009).
SWOT is common in industries like healthcare, marketing, agriculture, and education, the context of present interest (Benzaghta et al. Citation2021). Longhurst et al. (Citation2020) recent SWOT analysis sought to identify how 14 UK and Irish institutions overcame challenges brought by COVID-19 to anatomy education. SWOT has also been used to guide strategic adjustments to curricula (Orr Citation2013) and position institutions in the academic market (Balamuralikrishna and Dugger Citation1995). Most of these studies focus on the institutional perspective and the views of institutional representatives. Comparable attention has not been paid to student views, despite them arguably being the most important stakeholders. In the context of the present study, for example, several Hong Kong universities have recently introduced degree programs that combine humanities and social sciences with artificial intelligence, data analytics, and related fields, but it remains unclear to what extent they are expected or welcomed by students. The SWOT approach is likely to be palatable to linguistics students trained to verbalize critical thoughts including their expectations, concerns, (de)motivators, and the learning environment. The present study will use the four intersecting categories above as an innovative classification scheme. Each student will be assigned to a category based on whether they emphasized strengths or weaknesses, and threats or opportunities in their individual SWOT reflection. Therefore, rather than using the categories for strategy formulation as explained above, they are construed as “learner dispositions”—SO and ST learners are confident of their strengths, but SO perceives more opportunities than threats to their learning process. WO and WT learners emphasize their weaknesses, WO likewise perceiving more opportunities than WT.
SWOT has also been used in combination with other decision-making tools and research methods (see Benzaghta et al. Citation2021 for a review). Chermack and Kasshanna (Citation2007) advocate complementing SWOT’s qualitative analytic approach with quantitative instruments and methods like surveys and regression models to explore relationships between attitudinal, perception, and outcome measures. The Mathematics Attitude Survey (Korey Citation2000), originally designed for students in interdisciplinary math and humanities courses, is suitable in this regard. This 20-item survey has four constructs with five items each that measure self-perceived ABILITY and INTEREST, as well as the UTILITY of and PERSONAL GROWTH from studying mathematics. It has since been modified for novice learners in related fields like statistics and, more narrowly, regression analysis (Jordan and Haines Citation2006; Tay Citation2022). Tay (Citation2022), for example, examined perceptions of UTILITY and PERSONAL GROWTH among language and communication undergraduates exposed to different regression teaching strategies. Such surveys are often used to compare pre- and post-course perceptions, but the present focus is on learners at the onset of the course. Combining SWOT and the modified Mathematics Attitude Survey, this article reports a combined analysis of (i) self-perceived strengths, weaknesses, opportunities, and threats, (ii) the relationship between survey scores and learner disposition categories, and (iii) the resulting pedagogical implications. The following research questions will be answered:
What do postgraduate linguistics students, as novice learners of data analytics and programming, perceive as strengths, weaknesses, opportunities, and threats (SWOT) to their learning?
How do they perceive their ability, interest, and the practical utility and contribution to their personal growth by data analytics and programming?
Do these perceptions vary systematically across SWOT-defined learner dispositions?
What implications and recommendations do the results suggest for teaching data analytics and programming to linguistics students?
3 Methodology
3.1 Participants
Participants (N = 58) were students enrolled in a postgraduate linguistics program at the Hong Kong Polytechnic University, taking a 13-week course on data analytics and programming. Although they passed a prior research methods course with limited exposure to data analytics, all participants self-identify as novices due to the lack of systematic and in-depth training. The main course objective was to teach basic machine learning techniques (e.g., regression, classification, and clustering) for language and social data, and their implementation in the Python programming language. As a postgraduate level course, it also aimed to develop critical interpretation skills for insights and decision-making. Students were invited to submit their individual SWOT reflections and survey scores through an online platform after the first introductory lecture. They consented to the use of the data for research. All procedures were approved by the institutional review board of the Hong Kong Polytechnic University. The data and code for this article are available at https://github.com/dennistay1981.
3.2 SWOT Reflections
Students were asked to provide short answers to the following questions for the SWOT reflection.
Strengths: What are my qualities, attributes, skills, experiences, etc. that may advantage me in learning data analytics and programming?
Weaknesses: What are my qualities, attributes, skills, experiences, etc. that may disadvantage me in learning data analytics and programming?
Opportunities: What are some opportunities, resources, etc. that may help me to learn data analytics and programming?
Threats: What are some circumstances, factors, events etc. that may cause me trouble when learning data analytics and programming?
Two additional questions were asked in order to categorize each student into one of the four dispositions (SO, ST, WO, WT) as described above. For example, someone having more strengths and facing more threats will be categorized as ST.
On the whole, do I have more strengths or more weaknesses for learning data analytics and programming?
On the whole, do I face more opportunities or more threats when learning data analytics and programming?
3.3 Survey
Students then completed a modified version of the Mathematics Attitude Survey (Korey Citation2000) where the word “mathematics” in the original items was replaced by “data analytics (and programming).” The twenty items comprise four constructs: ABILITY, INTEREST, UTILITY, and PERSONAL GROWTH (see Appendix A). Each item was rated on a scale of 1–5 reflecting strongly disagree, disagree, neutral, agree, and strongly agree. The item sequence was randomized for each participant.
3.4 Combined Analysis
The combined mixed-method analysis of SWOT reflections and survey scores was conducted in three steps: (i) content analysis of SWOT reflections to uncover strengths, weaknesses, opportunities, and threats, (ii) quantitative analysis of survey scores across the learner dispositions (SO, ST, WO, WT), and (iii) fitting classification models to evaluate the predictability of these dispositions from the survey scores.
4 Results and Discussion
The content analysis approach to analyze SWOT reflections follows the general inductive logic of grounded theory (Corbin Citation2008). Each response is assigned to a tentative theme, noteworthy responses are highlighted for further discussion, and themes adjusted as more responses are read. The responses range from being predictable to unexpected, the latter in particular bearing potential implications for teaching data analytics and programming literacy. The analysis focuses on qualitative content rather than quantitative comparisons of theme frequencies since some responses may reflect more than one theme and there is no practical reason to compartmentalize them as such.
4.1 Strengths: Personal Traits, Background Knowledge, and Other Skills and Experiences
Self-perceived strengths fall under three themes in order of frequency: (i) favorable personal traits, (ii) background knowledge in relevant areas, and (iii) other relevant skills and experiences. The greater number of personal than knowledge-related strengths is expected given linguistics students’ general lack of training in data analytics and programming. Among the stated personal traits, the more predictable ones include “being hardworking,” “passion for learning something new,” “open to learning new skills,” “patience and perseverance,” “strong adaptability,” “determination,” “strong interest for data analytics,” and “curiosity.” While these traits would apply to any learning endeavor, some students also offered unique responses like the following ([sic], emphasis mine for all examples throughout).
I am a creative learner and I think I can analysis statistics in a more humanities way.
I am adventurous and like challenges. I like digging out patterns of something that seems to be chaotic or messy at the first glance.
I like quantitative analysis. I believe in statistical evidence more than pure argument.
Creativity and a sense of adventure are not normally associated with data analytics, given prevalent stereotypes that typify STEM (science, technology, engineering, and mathematics) disciplines and students as practical and (overly) logical. Conversely, non-STEM students may also be perceived by others and themselves as being less logical or even less “brilliant” (Chestnut et al. Citation2018). There have nevertheless been recent calls to highlight how data science ranging from visualization to statistical modeling is both practical and creative (Donoghue, Voytek, and Ellis Citation2021). The expressed confidence in creatively analyzing statistics “in a more humanities way” and interest in “digging out patterns of something that seems to be chaotic or messy” suggests that some students are already equipped to refute these stereotypes, and can appreciate the complementary nature of quantitative and humanistic analysis. Nevertheless, traces of such stereotypes are still found in the third example. By construing their personal belief in statistical evidence as a strength, the student reveals an implicit dichotomous view of quantitative versus humanistic analysis, and their conviction that the former is superior to (humanistic) “pure argument.”
A number of students also describe background knowledge in relevant areas as their strength. These include “math,” “machine learning,” “Javascript,” “bachelor’s degree in science,” and “corpus,” a computational approach to analyze large bodies of text in the field of linguistics. However, expressions of background knowledge are almost always accompanied by qualifier statements that downplay them. Consider the following examples.
Bachelor in systems science and engineering, trained in lots of courses related to maths but forgot almost all of them.
I have some conceptual knowledge about math and logic but I am not familiar with the practical codes in python.
I am quite used to learning softwares from scratch so I think this might be not as difficult as I have expected it to be.
The students highlight different background knowledge as a strength but also display varying degrees of a lack of confidence. They either have obvious reservations like in the first two quotes, or are not completely sure if these strengths can meet the demands of the course, like in the third quote where the expression of confidence is still attenuated with “might not be.” We in fact also observe this downplaying tendency in discussions of personal traits like the following. Given that these self-perceived strengths seem to be presented as almost borderline weaknesses, educators may need to play a more affirmative role in acknowledging their usefulness.
Actually I am not good at computing or mathematics but I do consider myself as a hard-working person, maybe this kind of trait might help me to learn data analytics and programming
Lastly, some students also highlight other skills and experiences that seem less directly relevant. These include “good communication skills,” “English skills,” “good at using resources and online materials to solve challenging issues,” and “many years of teaching experience.”’ From the perspective of learning models that regard synergies between different knowledge domains as integral to successful learning (Hattie and Donoghue Citation2016), the recognition that skills central to their linguistics training and professional experiences are transferable to data analytics is encouraging.
4.2 Weaknesses: Personal Traits and Lack of Knowledge, with(out) Explicit Mention of Linguistics
Self-perceived weaknesses fall under two equally frequent themes that mirror the strengths above: unfavorable personal traits, and a lack of background knowledge, skills, and/or experiences. Many of these personal traits are also predictable like a tendency to “overlook details,” “avoid computing,” “inattentive,” “lazy,” “afraid and avoid programming,” “losing enthusiasm halfway through,” and perhaps too self-disparagingly, “not thinking fast enough and my IQ might not be very high.” As with their self-perceived strengths, there are also some responses providing some unique insights like the following.
Lack of creativity, especially adapting what I have learned in solving problems I encounter.
Reluctance to take risks. I often fear if I change some codes, I will mess up the whole thing
I can’t multitask and it makes me anxious.
Haven’t studied maths or quantitative data analysis for years. I’m a visual learner. I’m not sensitive to numbers, but more sensitive to pictures
Just as creativity was highlighted as a strength, a lack of creativity was acknowledged as a weakness with the further expression that data analytics and programming require an adaptive mentality. Reporting “reluctance to take risks” and the inability to “multitask” as weaknesses is likewise surprising, as they go against the stereotypical perception of data analytics/programming as a systematic, logical, and therefore focused and (relatively) risk-free activity. While the risk of modifying code was given as a very specific and “frontline” example, it remains an interesting question the extent to which learners perceive the general study of data analytics/programming as a risk, and what educators could do to strategically package it as a creative, adventurous, and rewarding (albeit “risky”) experience. The final comment on learning styles, and the belief that a visual learning style is disadvantageous, could be seen as a partial misunderstanding of the nature of data analytics/programming. The most obvious counterpoint to this is the importance of data visualization. Such comments remind educators of the need to highlight data analytics as a trajectory, from descriptive visualizations where visual learners would in fact have an edge, to subsequent modeling processes where the converse is admittedly true.
The second theme of lack of background knowledge, skills, and/or experiences likewise mirrors self-perceived strengths. Expected responses include “lack of experience in actual coding,” “poor programming skills,” and “don’t have a strong sense in mathematics.” However, comments like
I am weak in managing with programmes and relating statistical knowledge in the “problem-solving” process, I tend to take a bit more time to process the newly introduced conceptssuggest that students may possess useful meta-knowledge about the subject matter, understanding the abstract objectives of data analytics despite not knowing or being confident about the details. Another important observation is that many students explicitly foreground their linguistics/humanities training as the reason, or justification, for their reported lack of knowledge. The following examples are illustrative.
My background is in linguistics so I don’t have a solid mathematics or computer background.
I major in humanities. I haven’t applied it in my real life to solve a real case.
Since I am a linguistic major student and have not done any quantitative course combined with programming before like this course, my lack of experience and exposure to this field might put me into a disadvantage. Furthermore, I have no experience at all in any kind of programming and Python. This is one of the university course that I have taken that is more of a hands on subject rather than my usual subjects where I do a lot of readings, critical analysis and academic essays
Most of the courses I studied are about language and I do not have related experience about programming so I am a bit nervous about it.
These examples reflect students’ assumption that linguistics knowledge is vastly different than data analytics/programming, and training in the former is therefore a liability. This attitude appears to be similar to students in the previous section who do have relevant background knowledge but still downplay these, presenting their strengths as borderline weaknesses. The pedagogical implication is the same, in that educators need to acknowledge the relevance and usefulness of linguistics training. Examples include knowing how to pose critical questions of a dataset and to challenge standard interpretation of results.
4.3 Opportunities: Resources, Other People, and Real-World Needs
Recall that strengths and weaknesses are considered internal while opportunities and threats external. Students’ responses show a general awareness of this distinction. Perceived opportunities fall under three types of external elements: resources for learning, help and support from other people, and real-world needs that motivate their learning. Resources is the most frequent theme with expected responses like the availability of online learning platforms (e.g., Datacamp, YouTube), resources provided by the school library, and the present course itself. As alluded in the introduction and further discussed below, although not explicitly mentioned by students in this study, emerging generative AI tools (e.g., ChatGPT, Google Bard) could play an important role as both a potential learning resource and a motivating exemplar of what AI, data analytics, and language sciences could combine to produce (Ellis and Slade Citation2023). The course instructor as a “resource” and students’ confidence in their willingness to help was also frequently mentioned, which testifies to the importance of educators’ (inter)personal qualities. A more easily overlooked resource is specific real-world data from previous projects that some students have access to, as expressed below.
I have worked at a project which needs to collect data from survey. So I have the original data from a real research project.
Interestingly, students also relate external resources to their internal traits, like in the following example where being “forced” to do assignments and projects is seen as a forthcoming opportunity for learning.
The assignments and projects of the course may force me to practice, otherwise I always will avoid programming when there are no stress.
Students expectedly mentioned “classmates and friends” as presenting opportunities for discussion and learning. Particular mention was made of friends with relevant expertise like “the help of my best friend who works as a programmer,” as well as “friends majoring in computing.” The final type of opportunity was various kinds of real-world needs faced by students. For example, “genuine needs in my job” and the “need to write a thesis supported by data.” Some students may not have a present need, but describe the potential to apply data analytics/programming as an opportunity, like in the following examples. Together with the previous example, it appears that some students are able to look beyond existing opportunities and find latent ones that lie in the future, and this may be a useful point for educators to emphasize more explicitly.
Solving my own research problem.
Reading more examples and try to relate them into our everyday life, particular social issues/social phenomena.
4.4 Threats
Just as weaknesses mirrored strengths, the final SWOT element of threats tended to mirror opportunities. Many students reported a lack of resources, including a lack of time and support from other people, as jeopardizing their learning. An interesting point from the examples below is that threats are perceived from both “directions”—not just aspects that are deemed too hard, but those deemed too easy as well. This suggests that even among a seemingly homogenous group of learners that educators may assume as novices, like the present case of linguistics students, expectations about desired levels of attainment may vary in ways that need to be addressed.
It is very difficult for me to find someone to turn to if I encounter some errors when running my codes if having real problems, no one else to approach to in real life
The instructor delivers too much knowledge instead of offering hands-on training.
Maybe the basic python skills I learn can’t provide the data I need for my thesis and I need to learn text analysis crawler.
Two other prevalent themes that are familiar at first glance are personal traits, and a lack of experience, knowledge, and/or skills. However, different than the internal strengths and weaknesses articulated above, students describe them here not so much as inherent dispositions, but those that may be amplified by situations foreseen to arise during the course. This nuanced distinction suggests that students may tend to (over)imagine problematic scenarios despite, or perhaps precisely because, they lack foundational knowledge of the subject matter. Consider the following examples.
I always feel frustrated when I read various tables and plots
I tend to get stressed when I cannot find a solution. In cases when I’m under pressure or there is time constraint, I may give up and resort to manual analysis
If I can’t understand the concept of the code or there are some bugs in the program, that troubles me a lot when learning it.
Programming language looks so complex, which may threaten me
I am worried about whether I could have a systematic understanding about the analysis and techniques since I often just googled the practical codes I need
If I cannot pick up in the beginning, then it may be troubling to learn something more difficult as weeks go by.
The different examples share a similar pattern—a statement of some unpleasant disposition (e.g., frustration, stress, trouble, threat, worry), and an imagined but not necessarily true scenario to trigger the former (e.g., the complexity of tables, plots, and code, not finding a solution, or not understanding something). The same tendency to imagine problematic scenarios is likewise observed when the focus shifts away from personal dispositions, like the following imagined threat of incomplete data and giving up prematurely.
I think the incompleteness of the data will be an obstacle in my learning because most of the data is from the internet. Therefore, this situation will make me want to change on other topic that will cause waste of time
I can only debug by copying the error message and searching it online. If I cannot find a good solution online, I’m done with it
The SWOT responses above placed students into four learner dispositions (SO, ST, WO, WT) based on their explicit indication of whether strengths outweigh weaknesses, and opportunities outweigh threats (or vice-versa) (see ).
Table 4 Frequency distribution of learner dispositions.
To further understand their attitudes in quantitative terms, we now examine their Mathematics Attitude Survey scores and how they vary across the four learner dispositions. presents the overall summary statistics (N = 58) for each survey construct—ABILITY, INTEREST, UTILITY, and PERSONAL GROWTH. The mean of each construct was calculated by first averaging the five relevant items for each student, and then averaging this across all students. All constructs have good scale reliability with respective Cronbach α of 0.83, 0.78, 0.77, and 0.74.
Table 2 Summary survey score statistics (N = 58).
The 95% confidence intervals suggest that students generally perceived their ABILITY as the lowest among the four constructs, and INTEREST and PERSONAL GROWTH as the highest. Pairwise correlational analyses () further indicate that PERSONAL GROWTH is weakly positively correlated with ABILITY (r = .33, p = .011) and INTEREST (r = .27, p = .038), while UTILITY is more strongly positively correlated with INTEREST (r = .34, p = .008).
Table 3 Pairwise correlations among survey constructs.
The absence of a clear link between ability and interest seems to go against the general observation of a (moderate) positive relationship between the two (Pässler, Beinicke, and Hell Citation2015)—the better one is at something, the more likely they will be interested in it. The present findings suggest that interest is instead linked to perceptions of practical utility, which reflects the increasing recognition among linguistics students of the growing need for data analytics/programming skills. These correlations will be explored in further detail below by considering their variation across the four SWOT-defined learner dispositions.
4.4.1 Comparison of Survey Scores across Learner Dispositions
The frequency distribution of the four learner dispositions among the 58 students is shown in .
Recall that SO and ST learners are confident of their strengths, but SO perceives more opportunities than threats to their learning process. WO and WT learners acknowledge their weaknesses more, with WO perceiving more opportunities than WT. A majority 39.7% fall into what could be considered the most “optimistic” SO disposition. Conversely, the least optimistic WT accounts for 17.2%. Learners are in general more likely to emphasize strengths (SO + ST
) over weaknesses (WO + WT
), and opportunities (SO + WO
) over threats (ST + WT
).
shows the distribution of survey scores within and across each disposition. Vertical bars indicate 95% confidence intervals of the means. Each construct is discussed in turn below.
Fig. 1 Mean survey scores across learner dispositions.
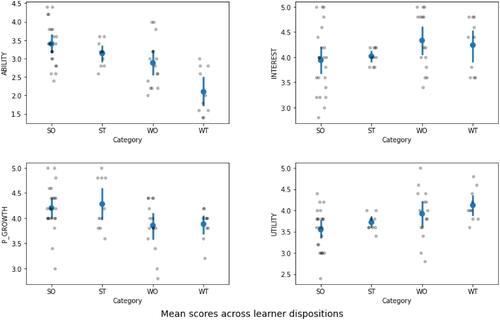
Perceptions of ABILITY differ significantly across the four categories (Kruskal-Wallis
, p < 0.001). The ratings decline from SO to WT, with significant pairwise differences between SO versus WT (p < 0.001) and ST versus WT (p = 0.008), based on post-hoc Dwass-Steel-Critchlow-Fligner pairwise comparisons. The higher ratings from SO and ST, compared to WO and WT, suggest that students who verbally emphasized their strengths over weaknesses are unsurprisingly more confident of their ability. The same applies to those who perceive more opportunities than threats. The rank order SO-ST-WO-WT further suggests that internal traits (strengths vs. weaknesses) play a greater role than external traits (opportunities vs. threats), a pattern that will recur across the remaining constructs.
Perceptions of INTEREST are somewhat reversed from the above. While the overall difference across the four categories is not significant (Kruskal-Wallis
, p = 0.271), those who emphasize weaknesses have a slight tendency to rate INTEREST higher than those who emphasize strengths. In particular, the highest ratings are given by those who also emphasize learning opportunities (WO). This presents a curious paradox since it implies that interest, be it interest in the subject matter or learning about the subject matter, could be raised by lowering confidence. We will return to this point below. Just as before, the rank order continues to suggest that internal traits play a greater role than external traits in determining scores.
Perceptions of PERSONAL GROWTH revert to a somewhat pattern similar with perceptions of ability. The overall difference across the four categories is not significant (Kruskal-Wallis
, p = 0.053). However, those that emphasize strengths appear to be more likely to acknowledge the role of data analytics and programming in personal growth, although the relative weighing of opportunities versus threats (i.e., SO vs. ST, and WO vs. WT) does not seem to influence these perceptions. This again implies the stronger influence of internal compared to external traits. This recurring observation suggests that “heartware” is still more important than hardware even for subjects like data analytics and programming that may require more concrete learning resources (e.g., computers, datasets) than typical linguistics subjects. It is more critical to pay attention to how students perceive themselves and others along their unfamiliar learning journey, than to simply ensure resource availability.
Lastly, perceptions of practical UTILITY are even more neatly reversed from perceptions of ability, with ratings increasing steadily from SO to WT. The overall difference is significant (Kruskal-Wallis
, p = 0.015), with significant pairwise differences in SO versus WT (p = 0.022) based on post-hoc Dwass-Steel-Critchlow-Fligner pairwise comparisons. Those who emphasize weaknesses and perceive more threats tend to find the subject matter more useful for their study, work, and personal lives. This reinforces the aforementioned paradox where confident and optimistic students believe in their ability and personal growth, but also have less interest and rate utility lower. Conversely, diffident and pessimistic students believing less in their ability and personal growth demonstrate greater interest and rate utility higher. Given that any random sample would likely contain both types of students, educators should be prepared to manage both extremes. One way to do so is to capitalize on the aforementioned generative AI tools to complement human instruction. Given their exemplary status as what AI, data analytics, and language sciences can combine to achieve, they should have strong appeal for confident and diffident students alike and bridge the gap between them. Students could be encouraged to prompt such tools to recommend datasets and algorithms for their projects, generate practice questions and code, troubleshoot code, or even role-play as tutors with specific pedagogical styles, among other ideas pointed out in recent research (Ellis and Slade Citation2023) and online community resources (e.g., www.towardsdatascience.com).
4.4.2 Predicting Learner Dispositions from Survey Scores
The final analysis involves fitting machine learning classification models (with Python 3.10) to evaluate the extent to which survey construct scores could be used as attributes/features to predict the SWOT-defined learner dispositions as outcome labels. There are two reasons for this. First, a classification model goes beyond the construct-by-construct comparative analysis above to evaluate the collective relationship of all four constructs with students’ learner dispositions. This in turn better reflects how the various pedagogical implications presented in the SWOT and survey analyses above are interrelated. Second, as a fitting illustration of how data analytics (the subject matter of the course) could itself be harnessed for pedagogy, classification models can help educators predict and make subsequent use of learner dispositions using pre-course survey scores. If predictive accuracy is high, it could even replace the need for a SWOT analysis altogether, which is more time consuming and demands more critical self-reflective skills. is an initial scatterplot matrix showing the distribution of the learner disposition categories along individual ABILITY, INTEREST, UTILITY, and PERSONAL GROWTH scores.
Fig. 2 Distribution of learner dispositions by survey scores.
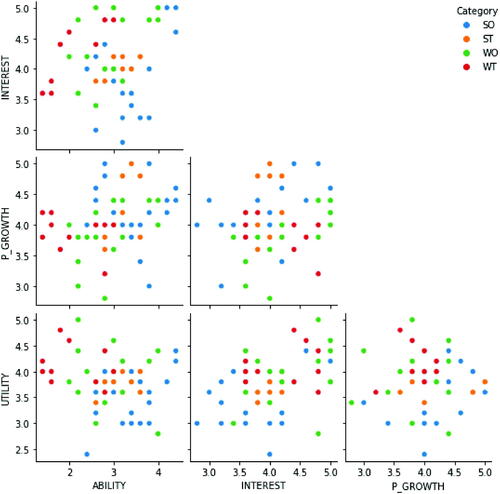
The scatterplots show that students in the same category/color are clustered to varying degrees for each survey construct permutation. This implies that there should be reasonable success with predicting categories using a classification model. In general, the optimal modeling approach involves balancing maximum rigor with practical considerations, including the nature of the context and data at hand. The following steps were taken accordingly, with rationale explained.
First, given the practical constraint of a limited sample size (N = 58), instead of predicting four categories with a single model, a hierarchical approach was taken to separately predict S versus W and then O versus T. This reduces the risk of over/underfitting and class imbalance. The two sets are then combined to derive the final predictions of all four categories.
Second, to enhance rigor given this constraint, a nested cross-validation approach was used (Cawley and Talbot Citation2010). This is a generalization of k-folds cross-validation and incorporates a hyperparameter optimization procedure. In short, the training folds of a standard k-folds cross validation (“outer folds”) are further split into “inner-folds” where different hyperparameter settings are tested, and the best ones used to train models across the outer folds. Five outer folds and two inner folds were used.
Finally, to minimize assumptions about the underlying data distribution, the above approach was applied to a nonparametric k-nearest-neighbors (k-NN) classifier as opposed to parametric classifiers or classifier ensembles. Hyperparameter tuning for k-NN is also relatively straightforward, that is, (i) number of neighbors, (ii) weighting of distances between nearest neighbors, and (iii) distance metric to be used.
The first model predicting S versus W yielded a high mean nested cross-validation score of 0.794 across 5-fold, with a standard deviation of 0.111. The second model predicting O versus T performed empirically less well with a mean score of 0.708 and standard deviation of 0.034. Returning to the distinction between internal (S and W) and external (O and T) traits discussed earlier, these results again suggest that students’ perceptions of the former are more systematically linked to their attitudes toward data analytics and programming. shows the two confusion matrices resulting from the respective cross-validation models.
Fig. 3 Confusion matrices for predicting S versus W and O versus T.
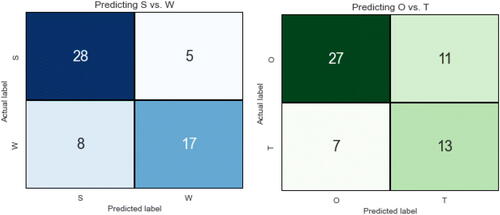
The first model attained a predictive accuracy of 77.6% (45 correct out of 58) and the second model an accuracy of 69.0% (40 out of 58).Footnote1 In terms of precision, recall, and f1-scores, the S category scored 0.78, 0.85 and 0.81 respectively, W scored 0.77, 0.68, and 0.72, O scored 0.79, 0.71, and 0.75, while T scored 0.54, 0.65, and 0.59. Students who emphasized threats in the environment as undermining their learning therefore had the least consistency in terms of their survey-measured attitudes.
Following this hierarchical approach, the S versus W and O versus. T predictions for each student were combined to obtain the final predictions. A student predicted as S and O is for example deemed to be predicted as SO. shows the resulting confusion matrix.
Fig. 4 Confusion matrix of final combined predictions.
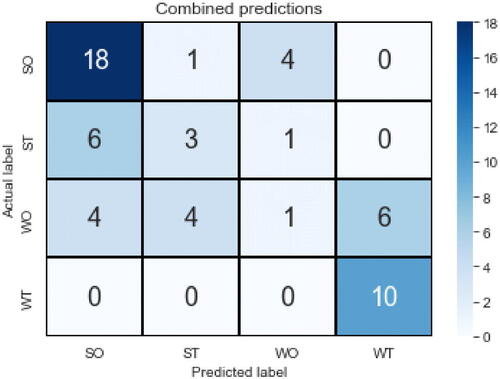
The combined predictions expectedly inherited the inaccuracies above and are not fully satisfactory. The overall predictive accuracy is poor at 55.2% (32 correct out of 58), but note that the most and least “optimistic” categories of SO and WT were relatively accurately predicted. In terms of precision, recall, and F1-scores, the SO category scored 0.64, 0.78, and 0.71, while WT scored 0.62, 1.00, and 0.77. WT in particular had perfect recall, meaning no false negatives. ST and WO as “mixed” categories had very low precision/recall/F1-scores ranging from 0.07 to 0.38. These results suggest that the ease of predicting learner dispositions from attitudinal surveys may be limited to students at the most and least “optimistic” ends. Those with mixed profiles like perceiving strengths and threats (ST), or weaknesses and opportunities (SO), tend to have more nuanced attitudes that may still need to be explored with a more critical and reflective instrument like the SWOT analysis.
5 Limitations
The present study has several limitations to be addressed in future work. Most obvious is the restriction of the sampling frame to a single typical linguistics postgraduate degree program, which may limit generalizability to the wider population of linguistics and humanities students. While linguistics is an important part of the humanities, the very different epistemologies and modes of inquiry among other humanities fields like anthropology, literary studies, and history strongly suggest that students in these fields may not regard data analytics and programming in the same ways. Another is the limitation of data collection to only the pre-course phase. While this is appropriate for the present focus on attitudes and perceptions toward an unfamiliar subject matter, a more comprehensive analysis could incorporate longitudinal measures during and after the course, including assessment results and their relationship with attitudes and perceptions.
6 Conclusion
Growing initiatives to promote data analytics and programming literacy have not been matched by efforts to understand students’ attitudes and perceptions, many of whom have no prior background in these areas. This article reported a combined SWOT and survey analysis on a focused sample of postgraduate students in linguistics, which is arguably the humanities discipline most related to the subject matter at hand. Addressing the first research question (what do students perceive as strengths, weaknesses, opportunities, and threats to their learning?), responses across the four SWOT elements ranged from the predictable to the unexpected. Many students expressed confidence and optimism in both their internal characteristics and external learning environment, and some demonstrated meta-knowledge of the subject matter. Nevertheless, there is also a tendency to (over)imagine problematic scenarios and attenuate self-perceived strengths as almost borderline weaknesses.
As for the second question (self-rated ability, interest, practical utility, and the subject’s contribution to their personal growth), results of the modified Mathematics Attitude Survey showed that ability was rated lowest while interest and personal growth the highest. The lack of a clear relationship between ability and interest, coupled with a much stronger relationship between utility and interest, reflects the increasing recognition among linguistics students of the practical importance of data analytics/programming in their field.
Next, the innovative classification of students into four SWOT-defined learner dispositions (SO, ST, WO, WT) helped us address the third question on how perceptions vary among learners. A key general finding is that across the four constructs, perceptions of internal traits (strengths and weaknesses) influenced the survey scores to a greater extent than external qualities (opportunities and threats), suggesting that attention to “heartware” may still be more important than “hardware”. Otherwise, for each construct, the four dispositions displayed somewhat contrasting score profiles: those that emphasize (i) strengths and opportunities were more confident in their abilities and personal growth, (ii) weaknesses and opportunities had more interest in the subject matter, and (iii) weaknesses and threats were more convinced about its practical utility. The paradoxical situation of confident/diffident students being less/more interested is seldom attested to in the literature. A possible explanation beyond the present scope to pursue is that students who cross an individual-specific threshold of over-confidence (Sheldrake Citation2016) may lose motivation in the subject matter, which poses a considerable pedagogical challenge. A suggested approach is to leverage emerging technologies that are likely to be both inspirational and practically useful even to students with high levels of actual or self-perceived ability.
Lastly, nested cross-validated classification models were fitted in an attempt to predict learner dispositions from survey scores. While the overall predictive accuracy was not satisfactory, learner dispositions at the opposite ends (SO and WT) could still be discerned more easily from survey scores than the two “mixed” dispositions (ST and WO).
As mentioned at relevant points throughout, the analyses bear implications for optimizing the teaching of data analytics and programming to linguistics students. While it is easy to assume this group as homogenous because of their general lack of prior training, the present study has instead revealed different expectations and assumptions, some of which may be misinformed precisely due to this lack. Students might consequently view the learning process as more risky than rewarding, and amplify demotivating problematic scenarios. It is thus important for educators to affirm how linguistics training is both relevant and beneficial to their learning. For example, those already aware that linguistic analysis is fundamental to NLP might still (rightly) feel that data analytics and programming is much broader, and it is enough to compartmentalize and “just learn NLP.” Educators could motivate students to learn so-called less relevant techniques with numerical rather than linguistic features and outcomes by demonstrating them on “language-related” (rather than “linguistic”) datasets. A useful example is to perform regression analysis on demographics and rated attitudes toward different accents. More generally, educators could attempt to frame data analytics as a humanistic process of critical interrogation rather than mechanically applying algorithms. for instance is a schematic representation of a “data analytic workflow” introduced to students early in the present course.
Fig. 5 Confusion matrix of final combined predictions.
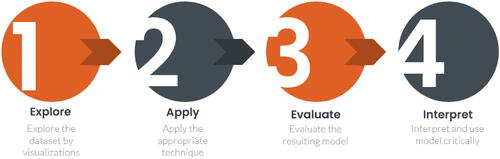
While steps 1 to 3 are standard textbook descriptions, the emphasis on “critical interpretation and use” in step 4 is an explicit attempt to contextualize data analytics for humanistic inquiry. Take a concrete example of a k-means clustering outcome of countries around the world in terms of test takers’ performance in English language assessments like IELTS or TOEFL. Aspects ranging from the optimal number of clusters, to central vs. peripheral cluster members, could be readily connected to humanistic themes like judgements of native vs. non-native English that are familiar to most linguistics students. Importantly, by couching such thematic connections as outcomes that explain rather than initiate data analysis, students could better appreciate their primary expertise as contributing to the solution rather than generating the problem.
Note
Data Availability Statement
The data and code for this article are available at https://github.com/dennistay1981 (under “Resources” and “Code and data in publications”).
Disclosure Statement
No potential conflict of interest was reported by the author(s).
Notes
1 There is a conceptual difference between the mean nested cross-validation scores reported above (e.g., 0.794 for the first model), and the predictive accuracy scores (0.776 for the first model). The mean nested cross-validation scores report the average accuracy across the five outer folds (with optimal hyperparameters), which serve to estimate model performance on unseen data. On the other hand, the predictive accuracy scores do not involve unseen data, and are based solely on in-sample predictions of the cross-validation model.
References
- Balamuralikrishna, R., and Dugger, J. C. (1995), “SWOT Analysis: A Management Tool for Initiating New Programs in Vocational Schools,” Journal of Career and Technical Education, 12, Article 1. DOI: 10.21061/jcte.v12i1.498.
- Bender, E. M. (2013), Linguistic Fundamentals for Natural Language Processing: 100 Essentials from Morphology and Syntax, Cham: Springer. Available at 10.1007/978-3-031-02150-3.
- Benzaghta, M. A., Elwalda, A., Mousa, M., Erkan, I., and Rahman, M. (2021), “SWOT Analysis Applications: An Integrative Literature Review,” Journal of Global Business Insights, 6, 55–73. DOI: 10.5038/2640-6489.6.1.1148.
- Berry, D. M., ed. (2012), Understanding Digital Humanities, London: Palgrave Macmillan UK. DOI: 10.1057/9780230371934.
- Bond, M. E., Perkins, S. N., and Ramirez, C. (2012), “Students’ Perceptions of Statistics: An Exploration of Attitudes, Conceptualizations, and Content Knowledge of Statistics,” Statistics Education Research Journal, 11, 6–25. DOI: 10.52041/serj.v11i2.325.
- Cawley, G. C., and Talbot, N. L. C. (2010), “On over-Fitting in Model Selection and Subsequent Selection Bias in Performance Evaluation,” The Journal of Machine Learning Research, 11, 2079–2107.
- Chen, C., Haduong, P., Brennan, K., Sonnert, G., and Sadler, P. (2019), “The Effects of First Programming Language on College Students’ Computing Attitude and Achievement: A Comparison of Graphical and Textual Languages,” Computer Science Education, 29, 23–48. DOI: 10.1080/08993408.2018.1547564.
- Chermack, T. J., and Kasshanna, B. K. (2007), “The Use and Misuse of SWOT Analysis and Implications for HRD Professionals,” Human Resource Development International, 10, 383–399. DOI: 10.1080/13678860701718760.
- Chestnut, E. K., Lei, R. F., Leslie, S.-J., and Cimpian, A. (2018), “The Myth That Only Brilliant People Are Good at Math and Its Implications for Diversity,” Education Sciences, 8, Article 65. DOI: 10.3390/educsci8020065.
- Code, W., Merchant, S., Maciejewski, W., Thomas, M., and Lo, J. (2016), “The Mathematics Attitudes and Perceptions Survey: An Instrument to Assess Expert-like Views and Dispositions among Undergraduate Mathematics Students,” International Journal of Mathematical Education in Science and Technology, 47, 917–937. DOI: 10.1080/0020739X.2015.1133854.
- Corbin, J., S., A. L. (2008), Basics of Qualitative Research: Grounded Theory Procedures and Techniques (3rd ed.), Thousand Oaks, CA: Sage.
- Donoghue, T., Voytek, B., and Ellis, S. E. (2021), “Teaching Creative and Practical Data Science at Scale,” Journal of Statistics and Data Science Education, 29, S27–S39. DOI: 10.1080/10691898.2020.1860725.
- Dyson, R. G. (2004), “Strategic Development and SWOT Analysis at the University of Warwick,” European Journal of Operational Research, 152, 631–640. DOI: 10.1016/S0377-2217(03)00062-6.
- Ellis, A. R., and Slade, E. (2023), “A New Era of Learning: Considerations for ChatGPT as a Tool to Enhance Statistics and Data Science Education,” Journal of Statistics and Data Science Education, 31, 128–133. DOI: 10.1080/26939169.2023.2223609.
- Gürel, E., and Tat, M. (2017), “SWOT Analysis: A Theoretical Review,” Journal of International Social Research, 10, 994–1006. DOI: 10.17719/jisr.2017.1832.
- Hattie, J. A. C., and Donoghue, G. M. (2016), “Learning Strategies: A Synthesis and Conceptual Model,” NPJ Science of Learning, 1, 16013. DOI: 10.1038/npjscilearn.2016.13.
- James Jacob, W. (2015), “Interdisciplinary Trends in Higher Education,” Palgrave Communications, 1, 1–5. DOI: 10.1057/palcomms.2015.1.
- Jordan, J., and Haines, B. (2006), “The Role of Statistics Educators in the Quantitative Literacy Movement,” Journal of Statistics Education, 14, 1–16. DOI: 10.1080/10691898.2006.11910583.
- Korey, J. (2000), Dartmouth College of Mathematics Across the Curriculum Evaluation Summary: Mathematics and Humanities Courses. Hanover, NH: Dartmouth College. Available at www.math.dartmouth.edu/∼matc/Evaluation/humeval.pdf.
- Lavidas, K., Barkatsas, T., Manesis, D., and Gialamas, V. (2020), “A Structural Equation Model Investigating the Impact of Tertiary Students’ Attitudes toward Statistics, Perceived Competence at Mathematics, and Engagement on Statistics Performance,” Statistics Education Research Journal, 19, 27–41. DOI: 10.52041/serj.v19i2.108.
- Levshina, N. (2015), How to Do Linguistics with R, Amsterdam: John Benjamins.
- Liau, A. K., Kiat, J. E., and Nie, Y. (2015), “Investigating the Pedagogical Approaches Related to Changes in Attitudes toward Statistics in a Quantitative Methods Course for Psychology Undergraduate Students,” The Asia-Pacific Education Researcher, 24, 319–327. DOI: 10.1007/s40299-014-0182-5.
- Longhurst, G. J., Stone, D. M., Dulohery, K., Scully, D., Campbell, T., and Smith, C. F. (2020), “Strength, Weakness, Opportunity, Threat (SWOT) Analysis of the Adaptations to Anatomical Education in the United Kingdom and Republic of Ireland in Response to the Covid-19 Pandemic,” Anatomical Sciences Education, 13, 301–311. DOI: 10.1002/ase.1967.
- Miller, J. E. (2010), “Quantitative Literacy across the Curriculum: Integrating Skills from English Composition, Mathematics, and the Substantive Disciplines,” The Educational Forum, 74, 334–346. DOI: 10.1080/00131725.2010.507100.
- Orr, B. (2013), “Conducting a SWOT Analysis for Program Improvement,” US-China Education Review A, 3, 381–384.
- Pahl, N., and Richter, A. (2009), SWOT Analysis. Idea, Methodology and a Practical Approach, Munchen: GRIN Verlag.
- Pässler, K., Beinicke, A., and Hell, B. (2015), “Interests and Intelligence: A Meta-Analysis,” Intelligence, 50, 30–51. DOI: 10.1016/j.intell.2015.02.001.
- Sheldrake, R. (2016), “Confidence as Motivational Expressions of Interest, Utility, and Other Influences: Exploring under-Confidence and over-Confidence in Science Students at Secondary School,” International Journal of Educational Research, 76, 50–65. DOI: 10.1016/j.ijer.2015.12.001.
- Steen, L. A., eds. (2001), Mathematics and Democracy: The Case for Quantitative Literacy, Washington, DC: Woodrow Wilson National Fellowship Foundation. DOI: 10.1111/j.1949-8594.1939.tb04037.x.
- Tay, D., and Pan, M. X., eds. (2022), Data Analytics in Cognitive Linguistics: Methods and Insights, Berlin: De Gruyter Mouton.
- Tay, D. (2020), “A Computerized Text and Cluster Analysis Approach to Psychotherapy Talk,” Language & Psychoanalysis, 9, 1–22.
- Tay, D. (2022), “Metaphor Types as Strategies for Teaching Regression to Novice Learners,” Journal of Statistics and Data Science Education, 30, 3–14. DOI: 10.1080/26939169.2021.2024777.
- Tay, D. (2023), “Turning Metaphor on Its Head: A “Target-to-Source Transformation” Approach in Statistics Education,” Frontiers in Psychology, 14, 1162925. DOI: 10.3389/fpsyg.2023.1162925.
- Williams, M., Payne, G., Hodgkinson, L., and Poade, D. (2008), “Does British Sociology Count?: Sociology Students’ Attitudes toward Quantitative Methods,” Sociology, 42, 1003–1021. DOI: 10.1177/0038038508094576.
- Winter, B. (2019), Statistics for Linguists: An Introduction Using R, New York: Routledge.
Appendix A
The (modified) Mathematics Attitude Survey. * = reverse-scaled items.
ABILITY
If I work at it, I can do well in data analytics and programming.
*I often feel like I’m missing something important in data analytics and programming-related classes.
When I get stuck on a data analysis problem, I can usually find my way out.
I’m never sure my answer is right until I’m given the solution.
Learning data analytics and programming makes me nervous.
INTEREST
Most subjects interest me more than data analytics and programming.
I enjoy learning new things in data analytics and programming.
I want to study more data analytics and programming.
I try to avoid courses that involve data analytics and programming.
I like exploring problems using real data and computers.
PERSONAL GROWTH
To understand data analytics and programming, I sometimes think about my personal experiences.
Doing data analytics and programming helps me understand myself.
In data analytics and programming, you can be creative and discover things for yourself.
Doing data analytics and programming raises interesting new questions about the world.
Data analytical thinking helps me make intelligent decisions about my life.
UTILITY
Data analytics and programming helps me understand the world around me.
Data analytics and programming has been an important tool to help me learn other subjects.
Many situations in the world around me can be modeled mathematically.
I rarely encounter situations that are data analytical in nature outside school.
I don’t need a good understanding of data analytics and programming to achieve my career goals.