 ?Mathematical formulae have been encoded as MathML and are displayed in this HTML version using MathJax in order to improve their display. Uncheck the box to turn MathJax off. This feature requires Javascript. Click on a formula to zoom.
ABSTRACT
The double mass curve method has been widely used in studying the trend change of hydrological elements. Based on the deviation sequence of the linear regression of cumulative value and extreme value, this paper improves the trend analysis method of the double mass curve and puts forward the selection criterion of abrupt change point of runoff and sediment load. Using the improved double mass curve method, we find there are two abrupt change points of runoff and sediment load in the lower reaches of Jinsha River basin in 2000 and 2012, which correspond to the completion and use of Ertan Hydropower Station and Xiluodu Hydropower Station, respectively, and their contributions to the change of sediment discharge in the basin are −0.33 and −0.99, respectively. Compared with the double mass curve method before and after the improvement, the improved method has a higher accuracy in judging the trend of water and sediment, which provides a mathematical basis for the selection of abrupt change points.
RÉSUMÉ
La méthode de la double courbe de masse a été largement utilisée pour étudier le changement de tendance des processus hydrologiques. Basé sur la séquence de déviation de la régression linéaire de la valeur cumulée et de la valeur extrême, cet article propose d’améliorer la méthode d’analyse de tendance de la double courbe de masse et met en avant le critère de sélection du point de changement brusque du ruissellement et de la charge sédimentaire. En utilisant la méthode améliorée de la double courbe de masse, nous constatons qu’il existe deux points de changement brusque pour les valeurs de ruissellement et de charge sédimentaire dans le cours inférieur du bassin de la rivière Jinsha en 2000 et 2012. Ces variations correspondent à l’achèvement et à l’utilisation des centrales hydroélectriques d’Ertan et de Xiluodu. Leurs contributions à la variation du débit sédimentaire dans le bassin sont de −0,33 et −0,99, respectivement. Par rapport à la méthode de la double courbe de masse avant et après l’amélioration, la méthode proposée a une plus grande précision pour juger de la tendance de l’évolution de l’écoulement et du transport sédimentaire. La méthode qui fournit une base mathématique pour la sélection des points de changement majeurs.
1. Introduction
The variation of runoff and sediment load in watersheds includes complex influencing factors, such as climate, sediment production conditions, river branching, the nested structure of the sub-watershed, etc. (Chalov et al., Citation2017; Kleinhans et al., Citation2007; Smith & Dragovich, Citation2009). Analysing the long-term series of water and sediment in a large basin, the trend of variation of runoff and sediment load at the outlet of the basin is closely related to the sediment containment of the reservoirs on the mainstream and tributaries. In the current study, the double mass curve method serves as a key tool for examining trends between hydrological elements in a watershed; it is widely used for consistency testing, missing value interpolation, data correction and attribution of trend changes (Baez-Villanueva et al., Citation2018; Bodoque et al., Citation2016; K. L. Chang et al., Citation2021). The double mass curve method calculates the continuous cumulative values of runoff and sediment load in a watershed over the same period and produces a scatter plot of the double cumulative values in a Cartesian coordinate system (Choi et al., Citation2016; Dias et al., Citation2019). By observing whether the slope of the linear growth relationship between the double accumulation values changes, we can determine whether the trend of runoff and sediment variation in the basin has changed (Dike & Tilburg, Citation2007; Gebremicael et al., Citation2013; A. Guo et al., Citation2016). The double mass curve method not only reveals whether there is a trend change in the runoff–sediment relationship in the basin but also identifies the point of abrupt change in the runoff–sediment trend based on the change in the slope of the double mass curve.
Gao et al. (Citation2011), Han et al. (Citation2019) and Hu et al. (Citation2012) classified the change in runoff and sediment load in a basin according to the abrupt change point of the double mass curve, with the natural base period of runoff and sediment variation before the abrupt change point and the trend change response period after the abrupt change point. The changing trend of runoff and sediment in the basin is divided into phases according to the double mass curve mutation point. The difference between the response period and the base period was calculated by extrapolating the linear relationship between the runoff and sediment accumulation values in the basin during the natural base period, and the runoff–sediment trend change in the basin was attributed to the change.
Although it is simple, intuitive and easy to quantify the trend of runoff–sediment change in a watershed using double mass curves (D. Li et al., Citation2018; P. Li et al., Citation2022; Moret-Fernández et al., Citation2019), the method still has the following problems. According to Kohler (Citation1949), three conditions must be met for the application of the double mass curve method: (i) a high degree of correlation between the analysed elements; (ii) comparability of the observed data of the reference or benchmark variables over the study period; and (iii) a positive relationship between the two variables. Pettitt (Citation1981), Pirnia, Darabi et al. (Citation2019) and Weatherhead et al. (Citation1998) suggested that a generalised double mass curve approach could be used to analyse trends in the hydrological elements as long as the variables are closely related by cause and effect.
On the other hand, the double mass curve method is not very accurate (Meysam et al., Citation2012; Sy et al., Citation2021; Zhu et al., Citation2019), and Anderson (Citation1955), Choi et al. (Citation2016) and Schaubel and Wei (Citation2011) highlight the susceptibility of hydrological data to distortion, which may lead to false mutation points in the double mass curve. To ensure the accuracy of the double mass curve method, the analysis needs to be combined with a longer continuous runoff and sediment load series, and it should be recognised that any mutation features smaller than five consecutive years are inaccurate (Buishand, Citation1982; Cluis et al., Citation1989; Klemeš, Citation1983). At the same time, the selection of mutation points for bioaccumulation curves relies heavily on subjective judgement and engineering experience (Du et al., Citation2021; Klemeš, Citation1979; Manson & Halford, Citation1981; Whelan, Citation1950), and the effects of climate change and anthropogenic activities (soil and water conservation measures, reservoir regulation) on changes in runoff–sediment trends in the study area must be taken into account. However, there is still a lack of effective quantitative indicators to accurately determine the abrupt change in the runoff–sediment relationship.
In summary, the use of the double mass curve method to determine the trend changes of runoff and sediment in the basin is influenced by the volatility of the runoff–sediment process, and there is a lack of mathematical proof for the selection of abrupt change points (Cluis & Laberge, Citation2001; Q. Zhang et al., Citation2006; Zhao et al., Citation2004). This paper improves the double mass curve method based on the above problems, proposes a mathematical method for determining the trend change of the double mass curve, and analyses the characteristics of the trend change of runoff and sediment in the lower Jinsha River.
2. Theoretical basis of the double mass curve method
The double mass curve method is used to analyse changes in runoff and sediment trends in the basin by first calculating the continuous cumulative values of basin runoff and sediment transport over time during the same period.
In EquationEquation (1)(1)
(1) , Qʹ is the continuous cumulative value of watershed runoff (108 m3), Qi is the watershed runoff in the ith year of the statistical series (108 m3), and n is the number of samples in the statistical series. In EquationEquation (2)
(2)
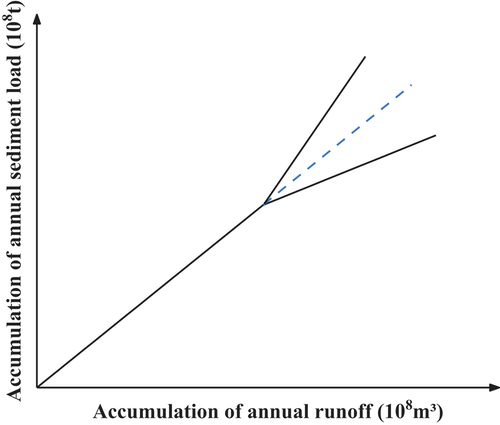
(2) , Sʹ is the continuous cumulative value of sediment transport in the basin (108 t), and Si is the sediment transport in the basin in the ith year of the statistical series (108 t). The double mass curve is shown in , using the cumulative values of runoff and sediment load as the horizontal and vertical axes, respectively. The slope of the double mass curve in represents the ratio between runoff and sediment load in the basin. When the double mass curve is upwardly skewed, the amount of sediment load for the same runoff increases; conversely, when the curve is downwardly skewed, the sediment load capacity of the runoff in the basin decreases (Ashagrie et al., Citation2006; Easterling & Peterson, Citation1995; Pirnia, Golshan et al., Citation2019).
Figure 1. Diagram of the double mass curve.
In EquationEquation (3)(3)
(3) , a and b are the slope and intercept of the double mass curve during the natural variation period, and in EquationEquation (4)
(4)
(4) , aʹ and bʹ are the slope and intercept of the double mass curve during the runoff–sediment response period, respectively. As the slope change of the double mass curve, the external factor leads to the change in the runoff–sediment load relationship in the basin, including anthropogenic or extreme climatic events. The changing process of runoff and sediment load can be divided into two periods, the early period and the response period, based on the change point in the double mass curve. In the response period, the relative difference in the accumulation of sediment load, between the original trend extension line and the response curve, is used to calculate the contribution of the external factor to sediment load change.
In EquationEquation (5)(5)
(5) , γ is the contribution of the external factor to the change in consistency of runoff and sediment load. When γ is greater than 0, the double mass curve is upwardly skewed, indicating that external factors increase the sediment transport capacity; when γ is less than 0, the double mass curve is downwardly skewed, indicating that the sediment transport capacity of the basin decreases under the same runoff conditions.
3. Improving the double mass curve method
3.1. Double mass curve trend determination
In the traditional double mass curve approach, the slope of the curve represents the ratio of sediment transport to runoff; however, the relationship between runoff and sediment volumes in a watershed generally satisfies a power function rather than a positive ratio (C. Guo et al., Citation2020). The slope of the curve represents the ratio of sediment transport to runoff.
In EquationEquation (6)(6)
(6) , c and d are the coefficient and exponent parameters of the power function, respectively. The slope of the double mass curve in the basin characterises the non-linear mapping relationship between sediment load and runoff, while the size of the exponent of the power function and the characteristics of the runoff distribution are the key factors affecting the trend change of the double mass curve. Combined with the above analysis, it can be seen that using the generalised double mass curve approach (M. Chang & Lee, Citation1974; Weiss & Wilson, Citation1953; F. Zhang et al., Citation2020), the following three conditions must be met to analyse changes in runoff–sediment trends: (i) there is a clear quantitative relationship between sediment load and runoff in the basin; (ii) the power function exponent of the runoff–sediment relationship in the basin is close to 1; and (iii) the time series of runoff meets the characteristics of a normal distribution, or the upper and lower boundary values of the range of runoff changes are close to each other.
As the runoff and sediment load processes in the basin satisfy the material continuum characteristic at long time scales but have stochastic fluctuation characteristics in specific years (Jiang et al., Citation2019; Peeters et al., Citation2014; Potter, Citation1981), the random noise of runoff–sediment variability at local time scales has a strong influence on the trend of the double mass curve. Considering the above problems, Weiss and Wilson (Citation1953) superimposed the angular variables at each point of the double mass curve in turn and applied the F-test to determine whether the slope of the double mass curve had changed significantly. This method is very effective in analysing smooth double mass curves, but the time series of runoff in this method should meet the normal distribution, whereas the actual runoff process is affected by rainfall and has periodic and random fluctuations. Therefore, according to the material continuity of the runoff and sediment process in the basin, the tolerance of the double mass curve method to the runoff distribution is improved, and the discriminative index of the change of runoff–sediment trend is clarified.
Combined with the continuously changing characteristics of the watershed runoff–sediment process, it is clear that as the length of the watershed runoff and sediment load time series increases, the more inclusive the continuous cumulative values are of the random fluctuations in runoff–sediment. When the runoff–sediment trend does not change, the sample points in the double mass curve should be symmetrically distributed in a finite space on both sides of the trend line, and the random deviations of each sample point can cancel each other out, i.e. the systematic deviations should satisfy a normal distribution centred on zero. The deviation of the cumulative value from the overall linear regression is magnified when the runoff–sediment trend in the basin changes and the centre of distribution of the systematic deviation is significantly different from 0.
To analyse whether abrupt changes in runoff–sediment trends occur in the basin, a linear regression was first established by combining the extreme values of runoff–sediment accumulation in the basin and then judging the characteristics of runoff–sediment trend changes in the basin in the sample space based on the deviation distribution of runoff–sediment accumulation samples from the regression curve. Since the successive cumulative runoff–sediment values are all monotonically increasing series, the extreme values and the minimum values correspond to the two ends of the series, so the linear regression of the cumulative runoff and sediment load in the basin is expressed as:
In EquationEquation (7)(7)
(7) , Sʹi and Qʹi correspond to the ith value in the sediment and runoff accumulation series, respectively. a0 is the slope of the linear regression, and Sʹ1 is the initial value of the sediment load accumulation. In EquationEquation (8)
(8)
(8) , n is the number of samples in the runoff–sediment series, Qʹ1 is the initial value of runoff accumulation, Sʹn is the end value of sediment load accumulation, and Qʹn is the end value of runoff accumulation. The sample deviation of the cumulative runoff–sediment values is calculated using Equation (7).
In EquationEquation (9)(9)
(9) , λi is the deviation of the ith cumulative sand loss from the linear regression of the extreme values. Using EquationEquation (9)
(9)
(9) , the deviation series corresponding to the cumulative value of sediment load is calculated.
In EquationEquation (10)(10)
(10) , λ is the deviation series corresponding to the cumulative values of runoff and sediment load for each year. Considering the large influence of extreme anomalies on the distribution of deviation, a scale scaling factor is defined to homogenise the deviation series according to the magnitude of the absolute value of the deviation of the accumulated values from the regression curve.
In EquationEquation (11)(11)
(11) , λi’ is the homogenised value corresponding to the ith deviation, and ηi is the scale scaling factor corresponding to the deviation λi. According to EquationEquation (12)
(12)
(12) , it can be seen that when the deviation is less than 0, the scale scaling factor is positively correlated with the deviation size; when the deviation is equal to 0, the scale scaling factor is also 0; when the deviation is greater than 0, the scale scaling factor is negatively correlated with the deviation size. Therefore, the more the cumulative values deviate from the extreme regression curve, the smaller the scale scaling factor is. By scaling the extreme outliers, the homogenised deviation series can effectively reduce the influence of runoff–sediment fluctuations on the trend judgement. The standardised deviation series were obtained by applying Equation (11).
In EquationEquation (13)(13)
(13) , λ’ is the homogenised deviation series corresponding to the accumulated runoff and sediment load for each year, and the statistical t-test is used to determine whether the homogenised deviation series is significantly different from the normal distribution centred on 0. When the t-test value P is greater than .05, this means that the centre of distribution of the standardised deviation series is not significantly different from 0, the deviation distribution is within the finite boundary around 0, the linear relationship between the continuous accumulation of runoff and sediment load and the extreme value is consistent, and there is no trend change in the double mass curve; on the contrary, when the t-test value P is less than .05, this means that the deviation distribution deviates significantly from the symmetric interval centred on 0. In this case, the linear relationship between the continuous accumulation value of runoff and sediment load and the extreme value is more different, and there is a trend change in the double mass curve.
3.2. Selection of abrupt change points for double mass curves
The relationship between the cumulative value and the extreme value linear regression line in the double mass curve is shown in . When there is no trend change in the double mass curve, the sample points are evenly distributed on both sides of the regression curve; when there is an upward trend in the double mass curve, the double accumulation values are distributed below the regression line, and the centre of the standard deviation distribution is located to the left of 0; when there is a downward trend in the double mass curve, the double accumulation values are distributed above the regression curve, and the centre of the standard deviation distribution is located to the right of 0.
Figure 2. Schematic of the trend of the double mass curve.
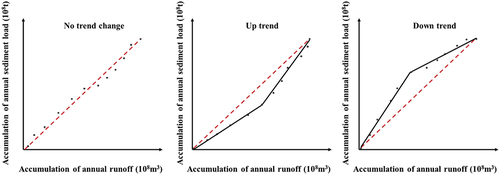
As can be seen from , when the double mass curve in the basin changes in trend, the double mass curve and the extreme value regression curve form a closed triangle, where the apex of the triangle outside the extreme value is the abrupt change point. The deviation of the cumulative and polar regression curves tends to increase with the cumulative runoff value, first increasing and then decreasing towards 0. The extreme point of the deviation series corresponds to the abrupt change point of the runoff–sediment trend. To facilitate the selection of abrupt change points for the double mass curve and to eliminate the influence of different trends on the positive and negative values of the deviations, the deviation series is criticised and all deviations are converted to positive values.
In EquationEquation (14)(14)
(14) , λ” is the quadratic series of homogenisation deviations, and the extreme value of λ” corresponds to the abrupt change point of the double mass curve. Based on the location of the abrupt change point of the double mass curve, the runoff–sediment trend in the basin can be divided into a natural base period and a response period. To check whether the runoff–sediment trend has changed again during the response period, the improved double mass curve method should be applied again to the runoff–sediment series after the abrupt change point, until all the abrupt change points of the runoff–sediment trend have been identified.
4. Analysis of variation in the trend of runoff and sediment load in the lower Jinsha River basin
4.1. Runoff and sediment processes in the lower Jinsha River basin
Based on the runoff and sediment load at the export-Pingshan hydrological station in the lower Jinsha River basin, a modified double mass curve method was applied to analyse the changes in runoff–sediment trends. The runoff and sediment processes in the lower Jinsha River basin from 1954 to 2019 were counted, and the results are shown in . The average multi-year runoff of the lower Jinsha River basin is 0.14 × 10⁸ m3, and the average annual sediment transport volume is 2.11 × 10⁸ t. Combining the runoff and sediment processes in the basin, it is easy to find that the overall changing trend of runoff in the lower Jinsha River basin is relatively stable, while the mean annual sediment load has experienced two rapid decreases in , it decreased from 4.70 ×10⁸ t to 1.51 ×10⁸ t during 1998~2012, and futher reduced to 155.38 ×10⁴ t during 2013~2019. According to the pattern of sediment load, there should be two changes in the trend of runoff and sediment load in the lower Jinsha River basin, with the abrupt change points around 1998 and 2012.
Figure 3. Process of runoff and sediment load in the lower Jinsha River basin over time.
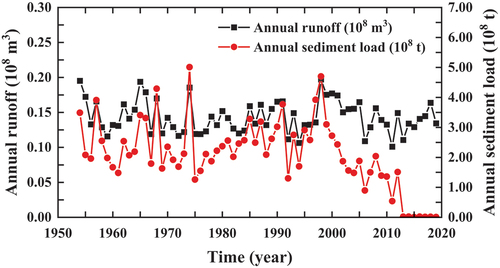
Figure 4. Process of change in sediment content in the lower Jinsha River basin.
Combined with the runoff and sediment load of the lower Jinsha River, the change process of sediment content in the lower Jinsha River basin was calculated, and the results are shown in . The average value of sediment content in the lower Jinsha River basin from 1954 to 2019 was 14.37 × 10³ kg/m3, of which the multi-year average value of sediment content from 1954 to 1997 was 17.38 × 10³ kg/m3; the average value of sediment content from 1998 to 2012 was 12.20 × 10³ kg/m3, a 17.31% decrease compared to the previous period; and the average sediment content from 2013 to 2019 was 0.12 × 10³ kg/m3, a 99.06% decrease compared to the previous period.
Figure 5. The double mass curve of runoff and sediment load in the lower Jinsha River basin.
4.2. Changing trend of runoff and sediment load in the lower Jinsha River basin
Firstly, the trend of runoff and sediment load in the Lower Jinsha River basin was analysed according to the double mass curve method; then the continuous accumulation value of runoff and sediment load in the basin was calculated using EquationEquations (1)(1)
(1) and (Equation2
(2)
(2) ), and the double mass curve was plotted as shown in . The slope of the double mass curve before 2013 was 17.07 and the accuracy of the linear regression was 0.997; the slope of the double mass curve after 2013 was 0.11 and the accuracy of the linear regression was 0.99. The slope of the double mass curve decreased by 99.39% from before 2013 to after 2013, indicating that the sediment content of the watershed decreased significantly after 2013.
From the improved double mass curve method proposed above, EquationEquations (9)(9)
(9) –(Equation12
(12)
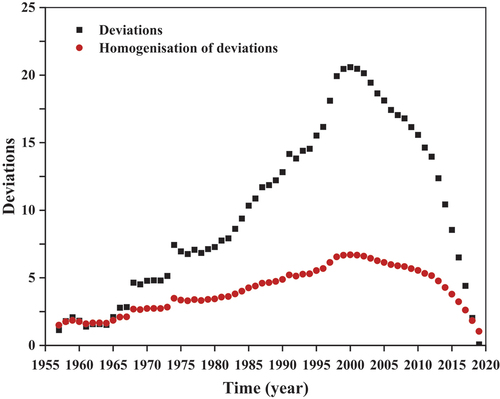
(12) ) were applied to calculate the deviation and homogenisation deviation of the linear regression of runoff–sediment accumulation and extremes in the lower Jinsha River basin, To analyse the both processes over time, the results are shown in . The distribution range of the deviation of the accumulation from 1954 to 2019 is 9.57 × 10⁸ t, and the mean value of homogenisation deviation is 3.86 × 10⁸ t. In , the mean homogenisation deviation has the same overall trend as the deviation but can significantly reduce the impact of the outliers on the overall trend. The characteristics of the homogenisation variance distribution were analysed by the t-test method, and the test value P was .00 (less than 0.05), indicating that the centre of the homogenisation deviation distribution was significantly different from 0 and that the double mass curve underwent a trend change.
Figure 6. Process of variation of runoff and deviation of sediment accumulation over time in the lower Jinsha River basin.
4.3. Analysis of abrupt change points in the runoff–sediment relationship in the lower Jinsha River basin
The extreme values of the homogenised deviation series are the abrupt change points of runoff–sediment trends in the basin, as shown by the criteria for selecting abrupt change points in the improved double mass curve method. The mean values of runoff and sediment load in the lower Jinsha River basin from 1954 to 2000 were 0.15 × 10⁸ m3 and 2.57 × 10⁸ t, respectively, while the mean values of runoff and sediment transport from 2001 to 2019 were 0.14 × 10⁸ m3 and 0.98 × 10⁸ t, respectively. There was no significant change in the runoff of the lower Jinsha River basin before and after 2000, while the average level of sediment load decreased by 61.91%.
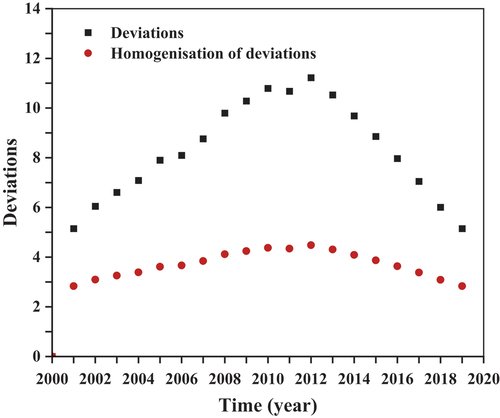
After obtaining the first year of the sudden change in runoff and sediment in the lower Jinsha River basin, the improved double mass curve method was used to further determine whether there was a trend change in the double mass curve from 2000 to 2019. Using the 2000s runoff and sediment load in the lower Jinsha River basin as the initial value, the distribution of cumulative deviation and homogenisation deviation in the basin after 2000 was calculated and the results are shown in . In , the extreme values of the cumulative deviation and homogenisation deviation are both in 2012, so 2012 is another abrupt change in the trend of runoff and sediment load in the lower Jinsha River basin.
Figure 7. Distribution of deviation and homogenisation of deviation in the lower Jinsha River basin after 2000.
In summary, it can be seen that there are two mutation points in the lower Jinsha River basin in 2000 and 2012, and the locations of the abrupt change points are consistent with the runoff and sediment load change process in the lower Jinsha River in . Comparing the results of the improved double mass curve method with the original method, the improved double mass curve method has higher theoretical accuracy and can accurately locate the two abrupt change points, while the original method ignores the abrupt change point of runoff and sediment load in 2000.
The main reason for the abrupt change in runoff and sediment load in the lower Jinsha River basin in 2000 and 2012 was the construction of a large reservoir (Ertan Hydropower Station) in the Yalong River, the main tributary of the lower Jinsha River basin, which accounts for the general runoff and sediment load inflows in 2000, and the construction of the first large reservoir (Xiluodu Hydropower Station) in the mainstream of the lower Jinsha River in 2012. In 2012, the first large reservoir (Xiluodu Hydropower Station) was built on the mainstream of the lower Jinsha River basin. The construction of two large hydropower hubs has led to a significant reduction in sediment content and an abrupt change in runoff and sediment load in the lower Jinsha River basin.
Based on the abrupt change years of runoff and sediment load in the lower Jinsha River basin, the water and sand change process in the basin was divided into three periods: 1954~2000, 2001~2012 and 2013~2019. A comparison of the runoff and sediment load change characteristics of the basin in the three periods is shown in . The average annual runoff in the lower Jinsha River basin from 1954 to 2000 was 0.15 × 10⁸ m3 and the average annual sediment transport was 2.57 × 10⁸ t, with an annual average sediment content of 17.48 × 10³ kg/m3 and a double mass curve slope characterising the sediment content mapping relationship of 17.18 × 10³ kg/m3; from 2001 to 2012 the basin had an annual average runoff of 0.14 × 10⁸ m3, an annual average sediment load of 1.54 × 10⁸ t and an annual average sediment content of 10.51 × 10³ kg/m3, with a double mass curve slope of 10.49 × 10³ kg/m3; the average annual runoff of the basin from 2013 to 2019 is 0.14 × 10⁸ billion m3, the average annual sediment transport in this period is 0.016 × 10⁸ t, the average annual sediment content is 0.12 × 10³ kg/m3, and the slope of the double mass curve is 0.12 × 10³ kg/m3.
Table 1. Characteristics of water and sand changes in the lower Jinsha River basin during different periods.
To analyse the impact of the operation of Ertan and Xiluodu hydropower plants on sediment load in the lower Jinsha River basin, EquationEquation (5)(5)
(5) was used to calculate the contribution of the hydropower plants to sediment transport after 2000, and the results are shown in . The contribution from 2000 to 2019 was all negative, indicating that sediment load in the lower Jinsha River basin decreased significantly after the hydropower plants began operating. From 2000 to 2012, the average value of the contribution of Ertan hydropower station to the change in sediment load is −0.33, and the average value of the contribution of Xiluodu hydropower station to the change in sediment load from 2013 to 2020 compared to the previous period is −0.99. The contribution of the Xiluodu hydropower station to sediment reduction in the basin is 3.03 times that of the Ertan hydropower station, so the change in the slope of the double mass curve in 2013 is more obvious than that in 2000, in .
Figure 8. Contribution of hydropower stations to changes in sediment load in the lower Jinsha River basin after 2000.
5. Discussion and conclusions
5.1. Discussion
The double mass curve method is widely used in the trend analysis of hydrological elements, which can visually reflect the changing pattern of the relationship (ratio) between variables. However, the sediment load and runoff of natural rivers satisfy the power-law relationship, and the non-linear relationship between runoff and sediment load causes the random fluctuation of runoff and sediment load to have a greater impact on the trend judgement (Awotwi et al., Citation2018; Tsirkunov et al., Citation1992; Wei & Zhang, Citation2010). This is because of the non-linear relationship between runoff and sediment load. The current use of the double mass curve method to analyse changes in runoff and sediment trends relies on subjective judgement and the F-test method; this method lacks reliable mathematical evidence, and the F-test requires a linear mapping between runoff and sediment load in the basin (Weiss & Wilson, Citation1953).
This paper proposes a generalised double mass curve. We propose that the generalised double mass curve method should satisfy the conditions of application. On the one hand, the study variables must satisfy the exact causal law, and on the other hand, the time series of the independent variables should satisfy the normal distribution characteristics as far as possible. In this paper, we consider the variability of the runoff and sediment load in the basin at different time scales.
The continuous accumulation of runoff and sediment load in the basin is the runoff and sediment load flux at the outlet of the basin, and the variability of the runoff and sediment load flux is relatively stable in the long term, while there are fluctuations in the runoff and sediment load variability in the short term, so the double mass curve has a correction for runoff and sediment load fluctuations with increasing time scales (Gao et al., Citation2017). Based on the above considerations, the overall trend is determined by the maximum and minimum values of the double mass curve, and the deviation from the linear regression of the accumulation value and the extreme value is calculated for each particular year in turn. To reduce the influence of extreme outliers on the overall trend judgement, a scale scaling factor is proposed to homogenise the deviation series, which not only ensures the overall trend of the deviation series but also weakens the magnitude of the random noise. Based on the extreme value of the homogenised deviation to determine the location of the trend abrupt change point, an accurate quantification indicator is proposed for the trend abrupt change of the double mass curve. By dividing the sequence of runoff and sediment load accumulation values into stages, the method iteratively analyses whether the abrupt change point still exists in the runoff and sediment load response period after the mutation point, until all abrupt change points are identified. The method can effectively solve the mutual masking effect between multiple mutation points in the double mass curve, and effectively improve the accuracy of the double mass curve method.
The feasibility and accuracy of the improved double mass curve method were tested in the context of the runoff–sediment change process in the lower Jinsha River basin. The results show that sudden changes in the runoff and sediment load trend in the lower Jinsha River basin occurred in 2000 and 2012, corresponding to the completion of the Ertan and Xiluodu hydropower stations, and the contribution to the change in sediment load in the basin was −0.33 and −0.99, respectively. Since Xiluodu Hydropower Station has a much greater regulating effect on the change of runoff and sediment load than Ertan Hydropower Station, the abrupt change point in 2012 has a shielding effect on the year 2000 in .
To verify the generalisability of the calculation of this method, the results of different research approaches in the Jinsha River basin were compared. Huang et al. tested the runoff and sediment load time series of Pingshan Station in the lower reaches of the Jinsha River from 1952 to 2015 using the double mass curve method and the MK method (Mann-Kendall Test), respectively. The results showed that the abrupt change of runoff and sediment in 1999 and 2012 was caused by the sand trapping of Ertan and Xiluodu hydropower stations, respectively, which is consistent with the results in this paper (Huang et al., Citation2018; Liu et al., Citation2019; X. F. Zhang et al., Citation2019). P. P. Zhang et al. (Citation2019) analysed the contributions of Ertan and Xiluodu hydropower stations to the runoff and sediment load changes in the basin, which were about 32% and 83%, respectively, according to the general approach of calculating the contribution of factors to runoff and sediment load changes. In this paper, the contribution of Xiluodu Reservoir to sediment containment is calculated to be about 17% higher than that in another study (D. Li et al., Citation2018). The main difference between the two results is that the contribution of reservoir sediment retention in this paper relates to the variation of the consistency of runoff and sediment load. However, other studies have distinguished the climate–runoff relationship and the contribution of human activities to sediment discharge.
In summary, the improved double mass curve method can greatly improve the analytical efficacy of the traditional method and enrich the theoretical basis for the analysis of abrupt changes in the runoff–sediment load relationship, which is expected to be widely promoted in the analysis of trends in hydrological elements. Essentially, the method is based on the bounded nature of runoff and sediment load variability in a watershed, and analyses the variability of runoff and sediment load fluxes in a watershed but does not address the effect of boundary changes in runoff and sediment load series on the validity of the method. Therefore, further research should consider combining the distribution probability of the independent variables and fractal theory to extend the applicability of the double mass curve.
5.2. Conclusion
This paper considers the influence of random fluctuations of runoff and sediment load on the changing trends in the basin and proposes a quantitative indicator to characterise the change of runoff and sediment variation by improving the double mass curve method. The following conclusions were obtained after analysing the change in runoff and sediment variation in the lower Jinsha River basin:
Compared with the traditional method, the improved double mass curve method proposes an index for determining the change in the trend of the double mass curve and can accurately select the location of the abrupt change in the runoff and sediment variation through statistical parameters.
Analysis using the improved double mass curve method revealed that there were two abrupt change points in runoff and sediment load in the lower Jinsha River basin between 1954 and 2019, in the years 2000 and 2012, respectively.
The two abrupt change points in runoff and sediment load in the lower Jinsha River basin correspond to the completion and use of the Ertan and Xiluodu hydropower stations, respectively, and their contributions to the change in runoff and sediment load in the basin are −0.33 and −0.99, respectively.
Disclosure statement
No potential conflict of interest was reported by the authors.
Additional information
Funding
References
- Anderson, H. W. (1955). Detecting hydrologic effects of changes in watershed conditions by double‐mass analysis. Eos, Transactions American Geophysical Union, 36(1), 1–12. https://doi.org/10.1029/TR036i001p00119
- Ashagrie, A. G., De Laat, P. J., De Wit, M. J., Tu, M., & Uhlenbrook, S. (2006). Detecting the influence of land use changes on discharges and floods in the Meuse River Basin – The predictive power of a ninety-year rainfall-runoff relation? Hydrology and Earth System Sciences, 10(5), 691–701. https://doi.org/10.5194/hess-10-691-2006
- Awotwi, A., Anornu, G. K., Quaye‐Ballard, J. A., & Annor, T. (2018). Monitoring land use and land cover changes due to extensive gold mining, urban expansion, and agriculture in the Pra River Basin of Ghana, 1986–2025. Land Degradation & Development, 29(10), 3331–3343. https://doi.org/10.1002/ldr.3093
- Baez-Villanueva, O. M., Zambrano-Bigiarini, M., Ribbe, L., Nauditt, A., Giraldo-Osorio, J. D., & Thinh, N. X. (2018). Temporal and spatial evaluation of satellite rainfall estimates over different regions in Latin-America. Atmospheric Research, 213, 34–50. https://doi.org/10.1016/j.atmosres.2018.05.011
- Bodoque, J. M., Amérigo, M., Díez-Herrero, A., García, J. A., Cortés, B., Ballesteros-Cánovas, J. A., & Olcina, J. (2016). Improvement of resilience of urban areas by integrating social perception in flash-flood risk management. Journal of Hydrology, 541, 665–676. https://doi.org/10.1016/j.jhydrol.2016.02.005
- Buishand, T. A. (1982). Some methods for testing the homogeneity of rainfall records. Journal of Hydrology, 58(1–2), 11–27. https://doi.org/10.1016/0022-1694(82)90066-X
- Chalov, S., Golosov, V., Tsyplenkov, A., Theuring, P., Zakerinejad, R., Märker, M., & Samokhin, M. (2017). A toolbox for sediment budget research in small catchments. Geography, Environment, Sustainability, 10(4), 43–68. https://doi.org/10.24057/2071-9388-2017-10-4-43-68
- Chang, M., & Lee, R. (1974). Objective double‐mass analysis. Water Resources Research, 10(6), 1123–1126. https://doi.org/10.1029/WR010i006p01123
- Chang, K. L., Schultz, M. G., Lan, X., McClure-Begley, A., Petropavlovskikh, I., Xu, X., & Ziemke, J. R. (2021). Trend detection of atmospheric time series: Incorporating appropriate uncertainty estimates and handling extreme events. Elementa: Science of the Anthropocene, 9(1), 00035. https://doi.org/10.1525/elementa.2021.00035
- Choi, W., Nauth, K., Choi, J., & Becker, S. (2016). Urbanization and rainfall–runoff relationships in the Milwaukee River basin. The Professional Geographer, 68(1), 14–25. https://doi.org/10.1080/00330124.2015.1007427
- Cluis, D., & Laberge, C. (2001). Climate change and trend detection in selected rivers within the Asia-Pacific region. Water International, 26(3), 411–424. https://doi.org/10.1080/02508060108686933
- Cluis, D., Langlois, C., Van Coillie, R., & Laberge, C. (1989). Development of a software package for trend detection in temporal series: Application to water and industrial effluent quality data for the St. Lawrence River. Environmental Monitoring and Assessment, 13(2), 429–441. https://doi.org/10.1007/BF00394243
- Dias, J. P., Ekwaro-Osire, S., Cunha, A., Jr, Dabetwar, S., Nispel, A., Alemayehu, F. M., & Endeshaw, H. B. (2019). Parametric probabilistic approach for cumulative fatigue damage using double linear damage rule considering limited data. International Journal of Fatigue, 127, 246–258. https://doi.org/10.1016/j.ijfatigue.2019.06.011
- Dike, J., & Tilburg, C. (2007). Climatic timescale temperature and precipitation increases on Long Island, New York. Atmosphere-ocean, 45(2), 93–105. https://doi.org/10.3137/ao.450203
- Du, M., Mu, X., Zhao, G., Gao, P., & Sun, W. (2021). Changes in runoff and sediment load and potential causes in the Malian River basin on the Loess Plateau. Sustainability, 13(2), 443. https://doi.org/10.3390/su13020443
- Easterling, D. R., & Peterson, T. C. (1995). A new method for detecting undocumented discontinuities in climatological time series. International Journal of Climatology, 15(4), 369–377. https://doi.org/10.1002/joc.3370150403
- Gao, P., Li, P., Zhao, B., Xu, R., Zhao, G., Sun, W., & Mu, X. (2017). Use of double mass curves in hydrologic benefit evaluations. Hydrological Processes, 31(26), 4639–4646. https://doi.org/10.1002/hyp.11377
- Gao, P., Mu, X. M., Wang, F., & Li, R. (2011). Changes in streamflow and sediment discharge and the response to human activities in the middle reaches of the Yellow River. Hydrology and Earth System Sciences, 15(1), 1–10. https://doi.org/10.5194/hess-15-1–2011
- Gebremicael, T. G., Mohamed, Y. A., Betrie, G. D., Van der Zaag, P., & Teferi, E. (2013). Trend analysis of runoff and sediment fluxes in the Upper Blue Nile basin: A combined analysis of statistical tests, physically-based models and landuse maps. Journal of Hydrology, 482, 57–68. https://doi.org/10.1016/j.jhydrol.2012.12.023
- Guo, A., Chang, J., Liu, D., Wang, Y., Huang, Q., & Li, Y. (2016). Variations in the precipitation–runoff relationship of the Weihe River basin. Hydrology Research, 48(1), 295–310. https://doi.org/10.2166/nh.2016.032
- Guo, C., Jin, Z., Guo, L., Lu, J., Ren, S., & Zhou, Y. (2020). On the cumulative dam impact in the upper Changjiang River: Streamflow and sediment load changes. Catena, 184, 104250. https://doi.org/10.1016/j.catena.2019.104250
- Han, J., Gao, J., & Luo, H. (2019). Changes and implications of the relationship between rainfall, runoff and sediment load in the Wuding River basin on the Chinese Loess Plateau. Catena, 175, 228–235. https://doi.org/10.1016/j.catena.2018.12.024
- Huang, X. R., Gao, L. Y., Yang, P. P., & Xi, Y. Y. (2018). Cumulative impact of dam constructions on streamflow and sediment regime in lower reaches of the Jinsha River, China. Journal of Mountain Science, 15(12), 2752–2765. https://doi.org/10.1007/s11629-018-4924-3
- Hu, C., Wang, Y., Guan, J., & Shi, Z. (2012). The causes of runoff variation based on double cumulative curve analysis method. Journal of Water Resources Research, 1(4), 204–210. https://doi.org/10.12677/JWRR.2012.14028
- Jiang, S., Wang, M., Ren, L., Xu, C. Y., Yuan, F., Liu, Y., Lu, Y., & Shen, H. (2019). A framework for quantifying the impacts of climate change and human activities on hydrological drought in a semiarid basin of Northern China. Hydrological Processes, 33(7), 1075–1088. https://doi.org/10.1002/hyp.13386
- Kleinhans, M. G., Wilbers, A. W. E., & Ten-Brinke, W. B. M. (2007). Opposite hysteresis of sand and gravel transport upstream and downstream of a bifurcation during a flood in the River Rhine. Netherlands Journal of Geosciences, 86(3), 273–285. https://doi.org/10.1017/S0016774600077854
- Klemeš, V. (1979). Storage mass‐curve analysis in a systems‐analytic perspective. Water Resources Research, 15(2), 359–370. https://doi.org/10.1029/WR015i002p00359
- Klemeš, V. (1983). Conceptualization and scale in hydrology. Journal of Hydrology, 65(1–3), 1–23. https://doi.org/10.1016/0022-1694(83)90208-1
- Kohler, M. A. (1949). On the use of double-mass analysis for testing the consistency of meteorological records and for making required adjustments. Bulletin of the American Meteorological Society, 30(5), 188–195. https://doi.org/10.1175/1520-0477-30.5.188
- Li, P., Chen, J., Zhao, G., Holden, J., Liu, B., Chan, F. K. S., Hu, J., Wu, P., & Mu, X. (2022). Determining the drivers and rates of soil erosion on the Loess Plateau since 1901. Science of the Total Environment, 823, 153674. https://doi.org/10.1016/j.scitotenv.2022.153674
- Li, D., Lu, X. X., Yang, X., Chen, L., & Lin, L. (2018). Sediment load responses to climate variation and cascade reservoirs in the Yangtze River: A case study of the Jinsha River. Geomorphology, 322, 41–52. https://doi.org/10.1016/j.geomorph.2018.08.038
- Liu, S. W., Zhang, X. F., Xu, Q. X., Liu, D. C., Yuan, J., & Wang, M. L. (2019). Variation and driving factors of water discharge and sediment load in dierent regions of the Jinsha River Basin in China in the past 50 years. Water, 11(1109), w11051109.
- Manson, S. S., & Halford, G. R. (1981). Practical implementation of the double linear damage rule and damage curve approach for treating cumulative fatigue damage. International Journal of Fracture, 17(2), 169–192. https://doi.org/10.1007/BF00053519
- Meysam, S., Ali-Mohammad, A. A., Arash, A., & Alireza, D. (2012). Trend and change-point detection for the annual stream-flow series of the Karun River at the Ahvaz hydrometric station. African Journal of Agricultural Research, 7(32), 4540–4552.
- Moret-Fernández, D., Latorre, B., Giner, M. D. L. L., Ramos, J., Alados, C. L., Castellano, C., López, M. V., Jimenez, J. J., & Pueyo, Y. (2019). Estimation of the soil hydraulic properties from the transient infiltration curve measured on soils affected by water repellency. Catena, 178, 298–306. https://doi.org/10.1016/j.catena.2019.03.031
- Peeters, S. H., Van Zwet, E. W., Oepkes, D., Lopriore, E., Klumper, F. J., & Middeldorp, J. M. (2014). Learning curve for fetoscopic laser surgery using cumulative sum analysis. Acta obstetricia et gynecologica Scandinavica, 93(7), 705–711. https://doi.org/10.1111/aogs.12402
- Pettitt, A. N. (1981). Posterior probabilities for a change-point using ranks. Biometrika, 68(2), 443–450. https://doi.org/10.1093/biomet/68.2.443
- Pirnia, A., Darabi, H., Choubin, B., Omidvar, E., Onyutha, C., & Haghighi, A. T. (2019). Contribution of climatic variability and human activities to stream flow changes in the Haraz River basin, northern Iran. Journal of Hydro-Environment Research, 25, 12–24. https://doi.org/10.1016/j.jher.2019.05.001
- Pirnia, A., Golshan, M., Darabi, H., Adamowski, J., & Rozbeh, S. (2019). Using the Mann–Kendall test and double mass curve method to explore stream flow changes in response to climate and human activities. Journal of Water and Climate Change, 10(4), 725–742. https://doi.org/10.2166/wcc.2018.162
- Potter, K. W. (1981). Illustration of a new test for detecting a shift in mean in precipitation series. Monthly Weather Review, 109(9), 2040–2045. https://doi.org/10.1175/1520-0493(1981)109<2040:IOANTF>2.0.CO;2
- Schaubel, D. E., & Wei, G. (2011). Double inverse‐weighted estimation of cumulative treatment effects under nonproportional hazards and dependent censoring. Biometrics, 67(1), 29–38. https://doi.org/10.1111/j.1541-0420.2010.01449.x
- Smith, H. G., & Dragovich, D. (2009). Interpreting sediment delivery processes using suspended sediment-discharge hysteresis patterns from nested upland catchments, south-eastern Australia. Hydrological Processes, 23(17), 2415–2426. https://doi.org/10.1002/hyp.7357
- Sy, S., Madonna, F., Rosoldi, M., Tramutola, E., Gagliardi, S., Proto, M., & Pappalardo, G. (2021). Sensitivity of trends to estimation methods and quantification of subsampling effects in global radiosounding temperature and humidity time series. International Journal of Climatology, 41(S1), E1992–E2014. https://doi.org/10.1002/joc.6827
- Tsirkunov, V. V., Nikanorov, A. M., Laznik, M. M., & Dongwei, Z. (1992). Analysis of long-term and seasonal river water quality changes in Latvia. Water Research, 26(9), 1203–1216. https://doi.org/10.1016/0043-1354(92)90181–3
- Weatherhead, E. C., Reinsel, G. C., Tiao, G. C., Meng, X. L., Choi, D., Cheang, W. K., Keller, T., DeLuisi, J., Wuebbles, D. J., Kerr, J. B., Miller, A. J., Oltmans, S. J., & Frederick, J. E. (1998). Factors affecting the detection of trends: Statistical considerations and applications to environmental data. Journal of Geophysical Research: Atmospheres, 103(D14), 17149–17161. https://doi.org/10.1029/98JD00995
- Weiss, L. L., & Wilson, W. T. (1953). Evaluation of significance of slope changes in double‐mass curves. Eos, Transactions American Geophysical Union, 34(6), 893–896. https://doi.org/10.1029/TR034i006p00893
- Wei, X., & Zhang, M. (2010). Quantifying streamflow change caused by forest disturbance at a large spatial scale: A single watershed study. Water Resources Research, 46(12). https://doi.org/10.1029/2010WR009250
- Whelan, D. E. (1950). A method of evaluating the hydrologic effects of land use on large watersheds. Eos, Transactions American Geophysical Union, 31(2), 253–261. https://doi.org/10.1029/TR031i002p00253
- Zhang, P. P., Cai, Y. P., Wei, Y., Yi, Y. J., & Yang, Z. F. (2019). Climatic and anthropogenic impacts on water and sediment generation in the middle reach of the Jinsha River basin. River Research and Applications, 36(12), 1–13.
- Zhang, F., Shi, X., Zeng, C., Wang, L., Xiao, X., Wang, G., Chen, Y., Zhang, H., Lu, X., & Immerzeel, W. (2020). Recent stepwise sediment flux increase with climate change in the Tuotuo River in the central Tibetan Plateau. Science Bulletin, 65(5), 410–418. https://doi.org/10.1016/j.scib.2019.12.017
- Zhang, Q., Xu, C. Y., Becker, S., & Jiang, T. (2006). Sediment and runoff changes in the Yangtze River basin during past 50 years. Journal of Hydrology, 331(3–4), 511–523. https://doi.org/10.1016/j.jhydrol.2006.05.036
- Zhang, X. F., Yan, H. C., Yue, Y., & Xu, Q. X. (2019). Quantifying natural and anthropogenic impacts on runoff and sediment load: An investigation on the middle and lower reaches of the Jinsha River basin. Journal of Hydrology: Regional Studies, 25, 100617. https://doi.org/10.1016/j.ejrh.2019.100617
- Zhao, W. W., Fu, B. J., Chen, L. D., Zhang, Q. J., & Zhang, Y. H. (2004). Effects of land-use pattern change on rainfall-runoff and runoff-sediment relations: A case study in Zichang watershed of the Loess Plateau of China. Journal of Environmental Sciences, 16(3), 436–442.
- Zhu, S. P., Liao, D., Liu, Q., Correia, J. A., & De Jesus, A. M. (2019). Nonlinear fatigue damage accumulation: Isodamage curve-based model and life prediction aspects. International Journal of Fatigue, 128, 105185. https://doi.org/10.1016/j.ijfatigue.2019.105185