
Abstract
Phase-pure cuprous oxide (Cu2O) crystals are difficult to grow since cupric oxide can form within the crystal as the crystal is cooled to ambient conditions. Vacancies are the solute which causes precipitation of macroscopic defects. Therefore, even when a mostly phase-pure single crystal is used as a feed rod, cupric oxide inclusions persist in the recrystallized solid. Control of the thermal profile during crystal growth, however, can improve phase-purity; a slow counter-rotation rate of the feed and seed rods results in fewer inclusions. Cupric oxide can be removed by annealing, which produces a factor of 540 ± 70 increase in phase-purity.
1. Introduction
High quality single crystals of cuprous oxide are required for optical experiments such as third harmonic generation [Citation1, Citation2] and exciton scattering [Citation3–Citation5]. Cuprous oxide also has potential as a photovoltaic and photocatalytic material since it is composed of non-toxic, Earth-abundant elements and has a high theoretical solar energy efficiency [Citation6–Citation11]. While single crystals can be found in nature as the mineral cuprite, natural samples are difficult to obtain and can vary in purity and quality [Citation12, Citation13]. Synthetic routes [Citation14–Citation18] to grow cuprous oxide crystals are therefore needed to rapidly obtain samples whose purity and quality can be systematically determined. Though small single crystals can be grown from the thermal oxidation of copper metal [Citation19, Citation20] or from solution using hydrothermal methods [Citation18, Citation21], crystals grown from a melt have yielded the largest and most thoroughly characterized crystals.
Molten cuprous oxide will react with many crucible materials, which makes growth from a melt difficult with techniques that require use of a crucible. Cuprous oxide can be grown using the Czochralski method with a magnesia crucible, although some reactivity is still observed [Citation22]. We have used the crucible-free floating zone method to prevent contamination during cuprous oxide crystal growth [Citation23–Citation28].
Three prominent defects are present in these crystals. On the atomic scale, copper vacancies are the dominant defect [Citation29]. On the macroscopic scale, some gas inclusions or voids can be found in cuprous oxide crystals [Citation19, Citation20, Citation23, Citation30]. Cupric oxide (CuO) inclusions are also present since cupric oxide is the thermodynamic phase at ambient conditions [Citation26]. In this paper we manipulate the macroscopic inclusions in cuprous oxide single crystals.
While a surface layer of cupric oxide can be expected if the crystal is grown in the presence of oxygen, it is perhaps initially surprising to find that cupric oxide inclusions are also found within the bulk of the crystal since the oxidation of cuprous oxide occurs primarily through the outward migration of copper atoms (as opposed to the inward migration of oxygen atoms) [Citation31–Citation34]. Furthermore, the presence of cupric oxide inclusions persists in crystals grown under reduced oxygen pressures [Citation25–Citation27].
In this study, we find inclusions also exist when crystals are grown under argon, even though the surface cupric oxide layer does not form. This suggests that the oxygen in the atmosphere does not directly influence cupric oxide inclusion formation and there is another mechanism that occurs within the bulk of the crystal.
Conversion between copper vacancies in cuprous oxide and the cupric oxide phase allows cupric oxide inclusions to form within the bulk of the crystal even in an oxygen-free atmosphere [Citation23, Citation26]. While cupric oxide inclusions can ultimately be removed in thin slices through annealing procedures, bulk single crystals larger than 1mm thick that do not contain macroscopic defects are still difficult to obtain. Inclusions are opaque and can induce strain [Citation35, Citation36] in bulk crystals; they may be undesirable based on the intended applications.
This work examines the effect of crystal growth conditions on macroscopic defects in cuprous oxide single crystals grown by the floating zone method in an effort to obtain bulk defect-free crystals without post-growth annealing. The number and distribution of defects in as-grown single crystals are compared to both the polycrystalline rods prior to crystal growth and crystal slices after annealing. The morphology is also examined because both crystals and their inclusions, owing to anisotropic surface energy, do not grow with perfect circular cross sections.
2. Materials and methods
The methods for thermal oxidation of feed rods, floating zone crystal growth, and annealing were previously described [Citation23]. X-ray diffraction results are also described in that paper. Briefly, polycrystalline feed and seed rods of cuprous oxide were obtained through thermal oxidation of copper metal rods. Grooves were machined into one end of the feed rod prior to oxidation. The groove allows for the feed rod to be easily aligned in the floating zone furnace. Metal rods were etched in 1M HCl for about 1 h and rinsed with water. Metal rods were then placed horizontally on supports made from copper metal foil on top of an inverted alumina boat. The foil supports were needed to prevent reactions between the metal rod and the alumina. Metal rods were then oxidized in a furnace at 1045 °C for 3 d. Crystal growth was conducted in an optical image furnace (CSI-FZ-T-10000-H-VI-VP) equipped with four 300 W tungsten halide lamps. Floating zone growth conditions for each sample are shown in table . Crystal slices were annealed in a box furnace at 1045 °C for 1–5 d and cooled to room temperature at a rate of 5 °C min−1.
Table 1. Sample growth conditions. The ∗ indicates variable rotation rate described below.
3. Results and discussion
The basic starting point for oxidation of copper to cuprous oxide is1 The kinetics of this reaction has been measured [Citation37]. The material can be further oxidized at lower temperatures or higher oxygen pressures to cupric oxide
2 Incomplete equilibration, however, produces some significant complications. The dominant transport mechanism in cuprous oxide is the outward diffusion of copper atoms via copper vacancies [Citation29, Citation38]. Diffusion of copper radioisotopes [Citation32] and oxygen-18 [Citation39] in cuprous oxide have been measured.
Oxidation of cuprous oxide begins with the formation of a cupric oxide surface, which continues to grow on two fronts [Citation34]. The process starts with the reaction3 at the Cu2O/CuO interface. The Cu2+ cations and two electrons migrate through the CuO layer toward the surface to combine with oxygen following the reaction
4
Chemical reactions, however, are not independent of the atomic environment in which they occur.
The slight copper deficiency in Cu2O can form through the creation of copper vacancies by5 This reaction, written in a modified Kröger–Vink notation of species
to indicate the atomic environment, does not go to completion in this experiment. Reactions (Equation1
1 ) and (Equation5
5 ) can be simultaneous. Under more oxidizing conditions, copper vacancies in the cuprous oxide lattice can precipitate as CuO inclusions [Citation23, Citation26]
6 resulting in cupric oxide without direct reactivity with O2 in the atmosphere. Similarly, it is possible to form a gaseous void at a cuprous oxide/cupric oxide interface via
7 Equations (Equation5
5 )–(Equation7
7 ) demonstrate some mechanisms by which vacancies and inclusions can form at low vacancy concentrations.
Equation (Equation77 ) is not unique for including a gaseous phase, but compared to the alternatives it has the advantage that it results in cuprous oxide which is more stoichiometric. It also does not rely on the existence of any isolated cupric oxide vacancies, which are predicted [Citation40], but whose existence we have not addressed experimentally. This equation is appropriate for explaining the formation of gaseous inclusions in samples formed from a homogeneous melt. For copper oxidized in the solid phase, expansion related stress and grain boundaries are substantial additional factors.
3.1. Feed rod preparation
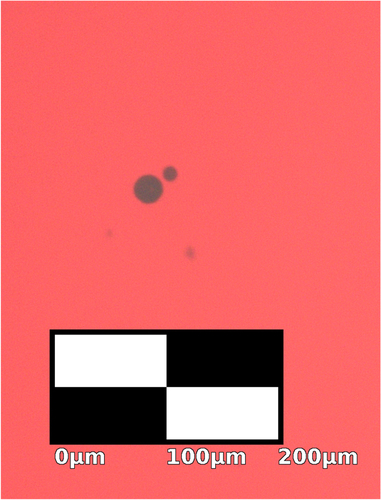
The quality of the feed rod can affect floating zone crystal growth: feed rods should be straight and have a uniform density as close to the crystal density as possible [Citation41, Citation42]. Polycrystalline rods of cuprous oxide were obtained through the thermal oxidation of copper metal rods. While straight and dense rods ( crystal density) were obtained through the thermal oxidation of copper metal, defects were still present. Figures and show defects on the mm and μm scale, respectively. Several voids can be seen in a radial cross-section of the thermally oxidized rod in figure . Smaller voids can be seen using scanning electron microscopy (SEM), as shown in figure . The image was collected with a MIRAII TESCAN at 7 kV with a secondary electron detector. These defects are significantly reduced during floating zone crystal growth.
Figure 1. A radial cross-section of a thermally oxidized copper rod. This sample has not been polished. There are multiple black inclusions. Thermally oxidized samples are polycrystalline, though grains are not easily visible without polishing.
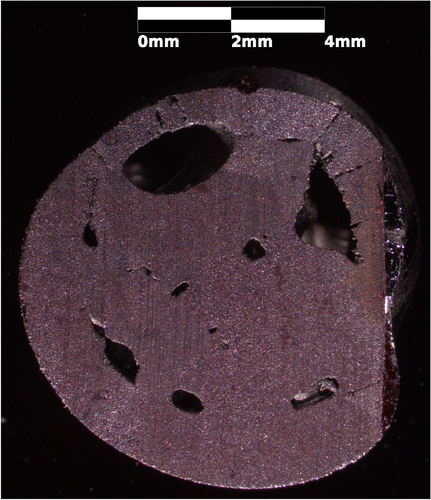
Figure 2. An SEM image of an inclusion in a longitudinally cut and polished slice of the Cu2O support rod used to grow sample A. The floating zone grown region is essentially featureless in the SEM. This inclusion is a cavity rather than CuO though it may have a CuO surface layer. There is low contrast between CuO and Cu2O in SEM images because the compounds have similar density. Notice the fine faceting on the interior of the inclusion.
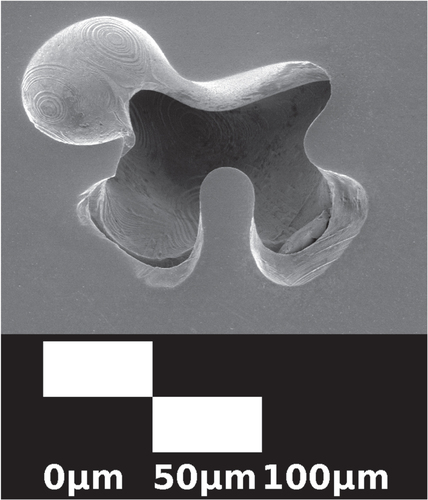
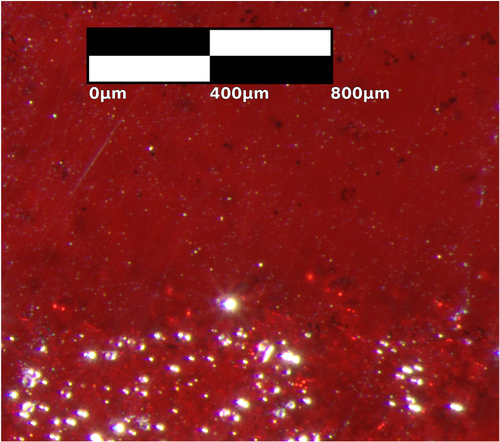
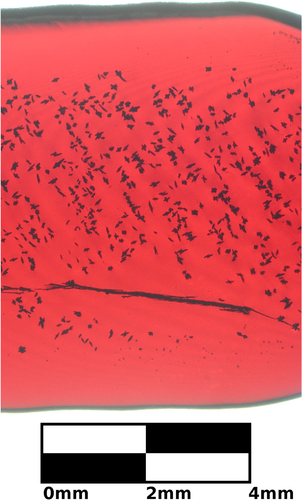
Figure shows an optical microscopy image of a polished slice of a cuprous oxide crystal where the feed and seed rods first connected, cut parallel to the direction of growth. Dark regions are CuO inclusions beneath the crystal surface. Bright regions are defects on the surface, which scatter light. The surface defects alone in the polycrystalline seed rod are more prevalent than all macroscopic defects in the crystallized region. The sample was oxidized in the box furnace but not in the floating zone furnace. In this case the box furnace atmosphere was air but the floating zone furnace atmosphere was argon.
Figure 3. Transmission microscopy image of a polished slice of a cuprous oxide crystal (sample A) that shows the horizontal boundary between the feed rod that was melted (top) and the unmelted support rod (bottom). The boundary is about one third of the way up the image. Dark regions are CuO in the bulk. Light regions are surface defects, which scatter light. The surface defects in the unmelted support rod outnumber all macroscopic defects in the bulk of the melted region. Melting and recrystallization therefore dramatically improves the phase purity of cuprous oxide.
3.2. Crystal growth
It is reasonable to think that cupric oxide initially contained in the feed rod causes cupric oxide inclusions to persist in crystals after floating zone growth. Equilibrium may not be achieved in the molten zone in all systems, i.e. not all the cupric oxide is reduced to cuprous oxide. In our experiment, however, results suggest that the oxidation state of copper reaches equilibrium in the melt.
The growth rate was varied to manipulate the time available for the material in the molten zone to reach equilibrium. The growth rate ranged from 3.5 to 17.5 mm h−1. If cupric oxide inclusions or liquid were present in the melt (which is around 1125 °C in air [Citation26] and has thermal gradients) the section grown at a faster rate should have a greater number and/or larger cupric oxide inclusions. No qualitatively significant difference was found, however, in the size or number of inclusions for the growth rates examined, which suggests that equilibrium is achieved in the molten zone, and the cupric oxide inclusions form in the solid after crystallization.
For further validation, a single crystal was recrystallized through a second floating zone growth cycle to determine if equilibrium is achieved in the molten zone. A second growth cycle did not have a significant effect on the size and number of cupric oxide inclusions, which confirms that cupric oxide inclusions do not persist in the molten zone and instead form inside the crystal upon cooling.
When crystals are grown in air, a cupric oxide film grows on the crystal surface. When crystals are grown under argon, the cupric oxide surface film does not grow, but inclusions continue to form. Previously we reported the advantages of growing crystals in an oxidizing atmosphere [Citation23]. Varying the oxygen partial pressure changes the cuprous oxide melting point [Citation26]. The fact that cupric oxide inclusions persist in crystals when grown under argon and are not dependent on growth rate or amount of cupric oxide in the feed rod suggests that the inclusions can only be manipulated by changing how the crystal cools. There are two ways to potentially affect the cooling profile of the crystal as growth progresses other than a change in the growth rate: the power of the lamps and the rotation rate of the feed and seed rods.
The dependence of the temperature profile of a crystal in a similar four-mirror floating zone furnace on the operating lamp power has been previously described. While the temperature gradient does initially increase with increasing lamp power, the average increase in temperature per unit length from the hottest point starts to plateau at around 50% lamp power [Citation43]. We have previously demonstrated that 56.8–60.8% lamp power was the approximate power range at which cuprous oxide crystals could be grown. Crystals grown within this temperature range therefore will experience very similar cooling curves. This hypothesis is supported by the fact that the copper vacancy concentration does not vary as a function of lamp power [Citation23]. Since copper vacancy concentration and cupric oxide are related by equation (Equation66 ), the cupric oxide inclusions should also not be significantly influenced by lamp power.
While the counter-rotation of the seed and feed rods does not ultimately affect the average copper vacancy concentration either [Citation23], faster rotation causes forced convection which decreases thermal gradients. Thermal gradients in and temperature homogeneity of the molten zone can affect how the crystal below the molten zone cools as growth continues and in turn affect the size, number, and radial distribution of inclusions in the crystal.
To clearly demonstrate the effect of rod rotation rate on inclusions, figure shows a longitudinal slice cut parallel to the direction of growth through the approximate center of rod D and compares the size and number of inclusions of samples grown with 7 RPM and 70 RPM rotation rates. Figure was taken through parallel polarizers, so it shows stress induced birefringence near the inclusions and edges.
Figure 4. Transmission microscopy image of two sections of sample D that were grown with different counter-rotation rates of feed and support rods. Top: 70 RPM per rod. Bottom: 7 RPM per rod. The counter-rotation rate changes the size, number, and distribution of CuO inclusions, which are small, dark spots.
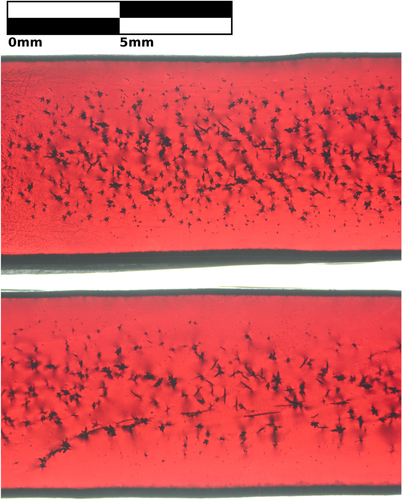
Figure was examined with threshold particle analysis [Citation44]. The quantity, size, and radial distribution of inclusions are summarized in figure . There are 2.2 ± 0.3 times as many inclusions in the region grown with a rotation rate of 70 RPM (p < 0.000 01, one tailed exact Poisson test [Citation45]). Inclusions are 1.9 ± 0.2 times larger in volume when a rotation rate of 7 RPM is used (p < 0.05, two sample t-test [Citation45]). With respect to the total volume fraction of inclusions, the volume increase of individual inclusions does not compensate for the smaller number of inclusions; the volume fraction of inclusion is greater for a fast rotation. In this case, there is a deviation from the suggested inverse relationship between inclusion size and number [Citation27] owing to the exchange between inclusions and vacancies.
Figure 5. Threshold particle analysis of crystal segments grown with counter-rotation rates of 70 RPM per rod (+ symbol) and 7 RPM per rod (× symbol). The volume and radial position of each inclusion is shown. The inclusions in the crystal grown with a faster rotation rate are more numerous, smaller, and spread farther from the center of the sample. Crystals analyzed were from sample D and are shown in figure .
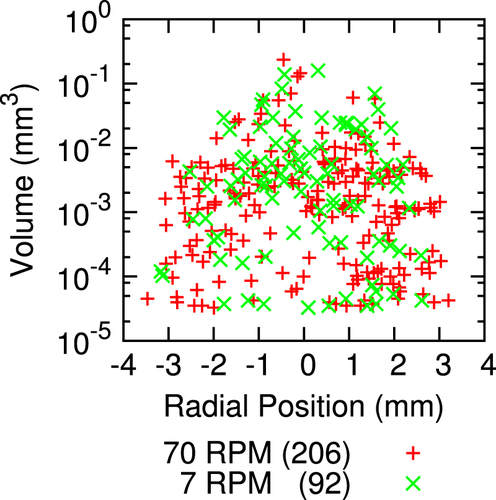
Owing to sintering at the surface and slower cooling in the interior, most of the included cupric oxide is near the center of the rod for slow rotation. However, inclusions are spread out 20% further radially when the rotation rate is faster (p < 0.01, F-test [Citation45]). Most applications (e.g. [Citation1, Citation3]) benefit from using a slow rotation rate to minimize the volume fraction of the inclusions and make the inclusions more concentrated so they are easily avoided.
3.3. Annealing
We have previously shown how phase separation of cupric oxide from cuprous oxide can be achieved if samples about 1 mm thick are annealed in air from 1045 °C and cooled at 5 °C per minute. Annealing eliminates CuO inclusions via the reverse of equation (Equation66 ). Gradual cooling rate allows equation (Equation6
6 ) to operate close to equilibrium, where the copper vacancies diffuse to the location where CuO will have the lowest energy before undergoing the forward direction in equation (Equation6
6 ). The end result is that most CuO sinters to the surface, where it can easily be removed through the polishing process.
While most cupric oxide inclusions can be removed with this process, some inclusions do persist in annealed samples. Inclusions in oxidized and floating zone crystallized samples that have not been annealed are highly irregular in shape and quite large [Citation26, Citation27]. Figure shows residual inclusions under an optical microscope after annealing, which are much smaller and rounded with a slight Wulff-construction-like faceting owing to anisotropic surface energy. The bulk crystal is also subject to anisotropic surface energy during growth [Citation27, Citation46–Citation48]. Phenomenologically, the observed shape of sample B, which was grown in the direction, is a squircle [Citation49, Citation50]. A squircle with radius r is described by
8 The observed squareness s = 0.564.
Figure 6. A transmission microscopy image of black CuO inclusions in a Cu2O crystal slice from sample B that has been annealed for 5 d at 1045 °C with heating and cooling rates of 5 °C min−1. The annealed inclusions are small and rounded, but show faceting in contrast with the inclusions before annealing in figure .
Threshold particle analysis was performed on crystal slices with and without a post growth annealing (see figures 8(a) and (d) in [Citation23]). The inclusion volume fraction in the interior improved from 0.28 ± 0.02 to 0.00051 ± 0.00007, which is a factor of 540 ± 70 improvement in this particular sample. While we have previously demonstrated how CuO quantities in annealed samples are too small to measure with powder x-ray diffraction, they can be measured very accurately using a transmission microscope. The inclusion fraction in annealed samples does vary. It is quite costly to collect statistics on this variation because the volume fraction is so low, but in all cases observed the inclusion fraction is greatly improved after annealing.
3.4. Grain boundaries
Though previous studies reported grain nucleation in cuprous oxide grown directionally from a melt [Citation24, Citation25], in 35 trials no grain nucleation was observed. The improved reliability of growth may be explained by our use of a four lamp furnace design [Citation43], which provides more stable heating and cooling. However, if a polycrystalline support is used to grow the crystal, occasionally grain boundaries may persist in the sample until they are eliminated through random walk or differences in the growth rate in different crystallographic directions. Frequently the remaining grain is growing in a direction close to [100].
An example of a grain boundary in a polished slice under an optical microscope is shown as a dark, uneven horizontal line in figure . The boundary is marked by an accumulation of inclusion material along the two-dimensional grain surface, which is viewed nearly edge on. The surrounding area is depleted of inclusions. This indicates that there is an attractive minimum in the chemical potential of defects near grain boundaries, which would trap vacancies and prevent CuO from precipitating on the surface of the crystal. The energy of a grain boundary plus the energy of an inclusion in different locations is greater than the energy of both in the same location. Therefore preparation of a single crystal improves transparency.
Figure 7. A transmission microscopy image of sample C that shows black CuO inclusions accumulate along a grain boundary. The area around the grain boundary is free of inclusions. Grain boundaries can be avoided if crystals are grown from a single crystal seed rod.
4. Conclusions
Floating zone growth followed by annealing is an excellent means of obtaining cuprous oxide crystals for optical applications. Transport of copper vacancies through the cuprous oxide lattice, however, leads to the formation of cupric oxide and gaseous inclusions. Proper annealing procedures eliminate inclusions in thinner samples using vacancy transport and surface energy minimization to separate phases. For applications where thicker samples are needed, however, it is difficult to obtain a larger, thicker crystal without cupric oxide inclusions.
Cupric oxide inclusions persist in floating zone crystals, even if a cuprous oxide single crystal is used as the feed rod. The rotation rate was the only variable that had a qualitative effect on the size and distribution of inclusions. While inclusions are always present after crystal growth, a slower rotation rate provided a smaller number and volume fraction of inclusions at the expense of a larger average inclusion size. Larger inclusion size can make inclusions easier to locate and avoid. The phase and structure of small inclusions are influenced by minimization of interfacial energy between phases and grains, as is the overall crystal morphology. Optical microscopy effectively characterizes phase purity, morphology, and grains, which has allowed us to demonstrate the conversion of opaque cuprous oxide to transparent crystals.
Acknowledgments
The authors thank Alexandre Revcolevschi for helpful discussions. We gratefully acknowledge NSF IGERT DGE-0801685. This work was funded by the Institute for Sustainability and Energy at Northwestern (ISEN). Crystal growth was supported by NSF DMR-1307698 and in part by Argonne National Laboratory under US. Department of Energy contract DE-AC02-06CH11357. This work made use of the x-ray, OMM, and Keck-II Facilities supported by the MRSEC program of the NSF (DMR-1121262) at the MRC of Northwestern. KC was supported as part of the Center for Inverse Design, an Energy Frontier Research Center funded by the US. Department of Energy, Office of Science, Office of Basic Energy Sciences, under award number DE-AC36-08GO28308. Use of the Center for Nanoscale Materials was supported by the US. Department of Energy, Office of Science, Office of Basic Energy Sciences, under Contract No. DE-AC02-06CH11357. In addition we thank Leo Ocola, Valentina Kutepova, and Xinqi Chen.
References
- FrazerLSchallerR DChangK BKettersonJ BPoeppelmeierK R 2014 Third-harmonic generation in cuprous oxide: efficiency determination Opt. Lett. 39 618 21 618–21 10.1364/OL.39.000618
- ManiSJangJ IKettersonJ B 2010 Nonlinear optical processes at quadrupole polariton resonance in Cu2O as probed by a Z-scan technique Phys. Rev. B 82 113203 10.1103/PhysRevB.82.113203
- FrazerLChangK BPoeppelmeierK RKettersonJ B 2014 Photoionization cross section of 1s orthoexcitons in cuprous oxide Phys. Rev. B 89 245203 10.1103/PhysRevB.89.245203
- JangJ IWolfeJ P 2006 Auger recombination and biexcitons in Cu2O: a case for dark excitonic matter Phys. Rev. B 74 045211 10.1103/PhysRevB.74.045211
- KazimierczukTFröhlichDScheelSStolzHBayerM 2014 Giant Rydberg excitons in the copper oxide Cu2O Nature 514 343 7 343–7 10.1038/nature13832
- HenryC H 1980 Limiting efficiencies of ideal single and multiple energy gap terrestrial solar cells J. Appl. Phys. 51 4494 500 4494–500 10.1063/1.328272
- BriskmanR N 1992 A study of electrodeposited cuprous oxide photovoltaic cells Sol. Energy Mater. Sol. Cells 27 361 8 361–8 10.1016/0927-0248(92)90097-9
- WeiH MGongH BChenLZiMCaoB Q 2012 Photovoltaic efficiency enhancement of Cu2O solar cells achieved by controlling homojunction orientation and surface microstructure J. Phys. Chem. C 116 10510 5 10510–5 10.1021/jp301904s
- BendavidL BCarterE A 2013 First-principles predictions of the structure, stability, and photocatalytic potential of Cu2O surfaces J. Phys. Chem. B 117 15750 60 15750–60 10.1021/jp406454c
- HuangLPengFYuHWangH 2009 Preparation of cuprous oxides with different sizes and their behaviors of adsorption, visible-light driven photocatalysis and photocorrosion Solid State Sci. 11 129 38 129–38 10.1016/j.solidstatesciences.2008.04.013
- YangHOuyangJTangAXiaoYLiXDongXYuY 2006 Electrochemical synthesis and photocatalytic property of cuprous oxide nanoparticles Mater. Res. Bull. 41 1310 8 1310–8 10.1016/j.materresbull.2006.01.004
- KoiralaSNakaNTanakaK 2013 Correlated lifetimes of free paraexcitons and excitons trapped at oxygen vacancies in cuprous oxide J. Lumin. 134 524 7 524–7 10.1016/j.jlumin.2012.07.035
- JangJ ISunYWatkinsBKettersonJ B 2006 Bound excitons in Cu2O: efficient internal free exciton detector Phys. Rev. B 74 235204 10.1103/PhysRevB.74.235204
- OhkuboTUshioMUritaKMoriguchiIAhmmadBItadaniAKurodaY 2014 Nanospace-enhanced photoreduction for the synthesis of copper (I) oxide nanoparticles under visible-light irradiation J. Colloid Interface Sci. 421 165 9 165–9 10.1016/j.jcis.2014.01.035
- WuSLiuTZengWCaoSPanKLiSYanYHeJMiaoBPengX 2014 Octahedral cuprous oxide synthesized by hydrothermal method in ethanolamine/distilled water mixed solution J. Mater. Sci., Mater. Electron. 25 974 80 974–80 10.1007/s10854-013-1674-4
- LabidiAOualiHBejaouiAWoodTLambert-MauriatCMaarefMAguirK 2014 Synthesis of pure Cu2O thin layers controlled by in situ conductivity measurements Ceram. Int. 40 7851 6 7851–6 10.1016/j.ceramint.2013.12.130
- LiJMeiZYeDLiangHLiuLLiuYGaleckasAKuznetsovA YDuX 2013 Engineering of optically defect free Cu2O enabling exciton luminescence at room temperature Opt. Mater. Express 3 2072 7 2072–7 10.1364/OME.3.002072
- SunSYangZ 2014 Recent advances in tuning crystal facets of polyhedral cuprous oxide architectures RSC Adv. 4 3804 22 3804–22 10.1039/C3RA45445B
- ManiSJangJ IKettersonJ BParkH Y 2009 High-quality Cu2O crystals with various morphologies grown by thermal oxidation J. Cryst. Growth 311 3549 52 3549–52 10.1016/j.jcrysgro.2009.05.006
- TothR SKilksonRTrivichD 1960 Preparation of large area single-crystal cuprous oxide J. Appl. Phys. 31 1117 21 1117–21 10.1063/1.1735756
- KinoshitaANakanoT 1967 Cu2O crystal growth by hydrothermal technique Japan. J. Appl. Phys. 6 656 10.1143/JJAP.6.656
- ZuckerR S 1965 Growth of single crystal cuprous oxide from the melt and luminescence of cuprous oxide J. Electrochem. Soc. 112 417 20 417–20 10.1149/1.2423559
- ChangK BFrazerLSchwartzJ JKettersonJ BPoeppelmeierK R 2013 Removal of copper vacancies in cuprous oxide single crystals grown by the floating zone method Crys. Growth Des. 13 4914 22 4914–22 10.1021/cg401081m
- TrivichDPollackG P 1970 Preparation of single crystals of cuprous oxide in an arc-image furnace J. Electrochem. Soc. 117 344 5 344–5 10.1149/1.2407507
- BrowerW S 1971 Growth of single crystal cuprous oxide J. Cryst. Growth 8 227 9 227–9 10.1016/0022-0248(71)90061-3
- Schmidt-WhitleyRMartinez-ClementeMRevcolevschiA 1974 Growth and microstructural control of single crystal cuprous oxide Cu2O J. Cryst. Growth 23 113 20 113–20 10.1016/0022-0248(74)90110-9
- LoisonJ LRobinoMSchwabC 1980 Progress in melt growth of Cu2O J. Cryst. Growth 50 816 22 816–22 10.1016/0022-0248(80)90143-8
- ItoTYamaguchiHOkabeKMasumiT 1998 Single-crystal growth and characterization of Cu2O and CuO J. Mater. Sci. 33 3555 66 3555–66 10.1023/A:1004690809547
- RaebigerHLanySZungerA 2007 Origins of the p-type nature and cation deficiency in Cu2O and related materials Phys. Rev. B 76 045209 10.1103/PhysRevB.76.045209
- TanakaAKatsunoH 2011 Void-free cuprous oxide tube prepared by thermal oxidation on outside of copper tube Japan. J. Appl. Phys. 50 0205 10.7567/JJAP.50.110205
- BardeenJBrattainWShockleyW 1946 Investigation of oxidation of copper by use of radioactive Cu tracer J. Chem. Phys. 14 714 21 714–21 10.1063/1.1724091
- MooreW JSeliksonB 1951 The diffusion of copper in cuprous oxide J. Chem. Phys. 19 1539 10.1063/1.1748118
- ZhuYMimuraKIsshikiM 2004 Oxidation mechanism of Cu2O to CuO at 600–1050 C Oxid. Met. 62 207 22 207–22 10.1007/s11085-004-7808-6
- GrzesikZMigdalskaM 2011 Oxidation mechanism of Cu2O and defect structure of CuO at high temperatures High Temp. Mater. Process. 30 277 87 277–87 10.1515/htmp.2011.046
- HaydarACoretA 1980 Excitonic photoconductivity and structural defects in Cu2O crystals Le J. de Phys. Colloques 41 C6 504 C6–504 10.1051/jphyscol:19806131
- FrazerLLenferinkE JChangK BPoeppelmeierK RSternN PKetttersonJ B 2014 Evaluation of defects in cuprous oxide through exciton luminescence imaging J. Lumin. 159 294 302 294–302 10.1016/j.jlumin.2014.11.035
- IguchiEYajimaKSaitoY 1974 Growth of a cylindrical Cu2O layer by oxidizing Cu J. Cryst. Growth 24 572 5 572–5 10.1016/0022-0248(74)90381-9
- IsseroffL YCarterE A 2013 Electronic structure of pure and doped cuprous oxide with copper vacancies: suppression of trap states Chem. Mater. 25 253 65 253–65 10.1021/cm3040278
- MooreW JEbisuzakiYSlussJ A 1958 Exchange and diffusion of oxygen in crystalline cuprous oxide J. Phys. Chem. 62 1438 41 1438–41 10.1021/j150569a022
- WuDZhangQTaoM 2006 LSDA + U study of cupric oxide: electronic structure and native point defects Phys. Rev. B 73 235206 10.1103/PhysRevB.73.235206
- KoohpayehS MFortDAbellJ S 2008 The optical floating zone technique: a review of experimental procedures with special reference to oxides Prog. Cryst. Growth Charact. Mater. 54 121 37 121–37 10.1016/j.pcrysgrow.2008.06.001
- DabkowskaH ADabkowskiA B 2010 Crystal growth of oxides by optical floating zone technique Springer Handbook of Crystal Growth DhanarajG BPrasadVDudleyM Berlin Springer 367 91 pp 367–91
- KoohpayehS MFortDBradshawAAbellJ S 2009 Thermal characterization of an optical floating zone furnace: a direct link with controllable growth parameters J. Cryst. Growth 311 2513 8 2513–8 10.1016/j.jcrysgro.2009.02.017
- SchneiderC ARasbandW SEliceiriK W 2012 NIH Image to ImageJ: 25 years of image analysis Nat. Methods 9 671 5 671–5 10.1038/nmeth.2089
- PressW HTeukolskyS AVetterlingW TFlanneryB P 2007 Numerical Recipes The Art of Scientific Computing 3rd edn Cambridge Cambridge University Press
- EagleshamD JWhiteA EFeldmanL CMoriyaNJacobsonD C 1993 Equilibrium shape of Si Phys. Rev. Lett. 70 1643 10.1103/PhysRevLett.70.1643
- PrabhakaranDIslaPBoothroydA T 2002 Growth of large La SrxNiO single crystals by the floating-zone technique J. Cryst. Growth 237 815 9 815–9 10.1016/S0022-0248(01)02039-5
- DabkowskiADabkowskiH AGreedanJ E 1993 SrLaGaO4-Czochralski crystal growth and basic properties J. Cryst. Growth 132 205 8 205–8 10.1016/0022-0248(93)90263-V
- GuastiM F 1992 Analytic geometry of some rectilinear figures Int. J. Math. Educ. Sci. Technol. 23 895 913 895–913 10.1080/0020739920230607
- CerfRPicardJ 2006 The Wulff Crystal in Ising and Percolation Models vol 1878 Berlin Springer