
Abstract
Objectives
An object presented positively is often judged more favourably than the same object described negatively even when the descriptions are logically equivalent. This difference, termed the attribute‐framing bias, has been shown to be affected by numeracy, such that less numerate individuals are more susceptible to the bias than highly numerate individuals. This article examines the hypothesis that less numerate individuals are less attentive to numerical information than highly numerate individuals; hence, their judgements rely more heavily on positive and negative words that elicit the bias.
Method
In two experiments, participants’ numeracy was measured, and they were asked to rate different scenarios while attribute framing was manipulated by presenting logically equivalent scenarios described with either positive or negative outcomes in three different proportions.
Results
Significant attribute‐framing effects were found in both experiments. Critically, less numerate participants were as sensitive to different outcome proportions as highly numerate participants. Nevertheless, numeracy affected attribute framing as hypothesised: Less numerate participants were typically more susceptible to attribute‐framing bias than highly numerate individuals.
Conclusions
Individual differences in sensitivity to numerical information did not modulate the effect of numeracy on attribute framing. We discuss the implications of these findings to understanding the cognitive processes underlying attribute‐framing bias.
What is already known about this topic?
Previous research has demonstrated that numeracy moderated attribute‐framing bias.
The account offered was that high numerate individuals are more attentive to numerical information and extract number magnitudes more readily, whereas less numerate individuals are less sensitive to number magnitudes and rely more on non‐numerical information.
Numeracy moderates framing bias for various numerical values.
What this topic adds?
Replicate the moderating role of numeracy.
Two experiments do not support this account.
Numeracy moderates framing bias differentially for different numerical values.
Judgements and decisions could be influenced by the way information is framed. In this article, we focus on attribute framing, in which the critical attribute of an object or an event is described either in positive‐gain terms or in negative‐loss terms, and both descriptions are logically equivalent (Tversky & Kahneman, Citation1981). Accumulating evidence has robustly shown such unbalanced framing results in more positive evaluations in response to positive, compared to negative, framing (Levin, Schneider, & Gaeth, Citation1998). Critically, however, recent research has demonstrated that not all individuals are equally susceptible to this bias. In particular, it has been demonstrated that highly numerate participants are less susceptible to attribute‐framing bias compared to less numerate ones (for a review, see Peters, Citation2012). Understanding the reasons for these individual differences may shed light on the processes underlying the bias. Several accounts tried to explain the cognitive processes underlying the relationship between numeracy and individual differences in susceptibility to the framing bias, yet these accounts have been typically offered as post‐hoc explanations rather than as theoretical accounts that are put to empirical examination (e.g., Peters, Citation2012; Peters et al., Citation2006; Reyna, Nelson, Han, & Dieckmann, Citation2009).
In this article, we examine one account, namely, that highly numerate individuals are more attentive to the numeric information provided and are more sensitive to the magnitude represented by numbers compared to less numerate individuals, who are more sensitive to the positive versus negative valence of the description (Peters, Citation2012; Peters et al., Citation2006).
The attribute‐framing bias
Following the well‐known Asian disease problem (Tversky & Kahneman, Citation1981), many studies have examined framing biases in various contexts, demonstrating that the mere presentation of the same glass as half full or half empty affects judgement and decision‐making (Keren, Citation2011; Kühberger, Citation1998; Levin et al., Citation1998). Based on seemingly inconsistent framing‐effects findings in the literature, Levin et al. (Citation1998) classified framing studies into three types that differ in terms of their operational definitions, typical findings, and underlying processes. Here, we focus on attribute framing, which is perhaps the simplest form of framing as it relates only to the alternate labelling of a single attribute of an object or an event (Levin et al., Citation1998). Attribute framing is commonly encountered in everyday life, where test scores, weather forecasts, food labels, medical diagnoses, employment statistics, and betting averages are ‘framed’ in a particular way but could have been framed differently. For example, Levin and Gaeth (Citation1988) showed that people evaluate ground beef more positively when it was presented as ‘75% lean’ (positive framing) than when it was presented as ‘25% fat’ (negative framing). Many studies have demonstrated attribute‐framing effects in various contexts, such as health‐care decisions (McNeil, Pauker, Sox, & Tversky, Citation1982) and estimation of expected lifespan and concomitant economic decisions (Payne, Sagara, Shu, Appelt, & Johnson, Citation2013). Several meta‐analyses concluded that in most studies, positive framing results in more favourable evaluations relative to negative framing (Levin et al., Citation1998; Piñon & Gambara, Citation2005). A recent meta‐analysis reported a medium mean attribute‐framing effect size (Cohen's d) of about half a standard deviation (Freling, Vincent, & Henard, Citation2014).
The straightforward structure of attribute framing makes it especially useful for gaining a basic understanding of how framing influences information processing (Levin et al., Citation1998). Several accounts have been proposed to explain the attribute‐framing bias. Levin et al. (Citation1998) proposed that the positive labelling of an attribute evokes favourable associations in memory, whereas the negative labelling of the same attribute is likely to evoke unfavourable associations. This account is rather general and does not explain individual differences in susceptibility to the framing bias as manifested by the effect of numeracy on attribute‐framing bias. However, examining these individual differences and underpinning the processes that generate them could promote a fuller theoretical understanding of the attribute‐framing bias.
The role of numeracy in attribute‐framing bias
Individuals are routinely exposed to numerical information in contexts, such as those related to health, welfare, economics, and education. However, repeated studies have shown that numerical information is difficult to understand for significant segments of the population. Numeracy refers to the individual's ability to process basic probability and numerical concepts (Garofalo & Lester, Citation1985) and to evaluate risk (Gardner, McMillan, Raynor, Woolf, & Knapp, Citation2011; Reyna et al., Citation2009; Schwartz, Woloshin, Black, & Welch, Citation1997). Accumulating evidence has shown that low numeracy hampers individuals’ judgements and interpretations and adversely impacts their choices and decisions in both hypothetical studies and in real‐life consequential situations (Lipkus, Samsa, & Rimer, Citation2001; Reyna et al., Citation2009). For example, less numerate individuals would be more susceptible to framing when (a) evaluating a food product given its percentage of fat versus lean, (b) evaluating a medication given the probability of side effects versus the probability of no side effects, and (c) evaluating a medical procedure given the probability of failure versus success.
Several studies have demonstrated that, relative to less numerate individuals, highly numerate individuals are less susceptible to biases in judgement and decision‐making tasks (Garcia‐Retamero & Cokely, Citation2011, Citation2013, Citation2014; Garcia‐Retamero & Galesic, Citation2010; Peters et al., Citation2006), including judgements related to attribute‐framing messages (Gamliel, Kreiner, & Garcia‐Retamero, Citation2016; Peters et al., Citation2006). Peters et al. (Citation2006) examined the role of numeracy in a number of judgement and decision‐making tasks. Most relevant to the current article is the study in which they examined the effect of numeracy on attribute‐framing bias using the numeracy measure by Lipkus et al. (Citation2001) (Peters et al., Citation2006, Study 1). Their findings revealed that numeracy affected attribute‐framing bias such that less numerate participants were more susceptible to the bias than highly numerate individuals. A more recent study supplemented the Berlin Numeracy Test items (Cokely, Galesic, Schulz, Ghazal, & Garcia‐Retamero, Citation2012) to the Lipkus et al. (Citation2001) scale and replicated Peters et al.’s (Citation2006) findings, demonstrating that susceptibility to attribute‐framing bias increased as numeracy decreased (Gamliel et al., Citation2016).
Several accounts have been offered to explain the role of numeracy in attribute‐framing bias. The current research focused on an account suggesting that individuals with different numeracy abilities attend to the information differently: Less numerate decision makers rely heavily on ‘non‐numerical information’, whereas highly numerate individuals are more attentive to numerical information, expend more effort, seek greater accuracy with numbers, and extract number magnitudes more readily (Peters, Citation2012; Peters et al., Citation2006). Consequently, compared to less numerate individuals, highly numerate individuals are more attentive and more sensitive to numeric information, resulting in less biased evaluations (Peters, Slovic, Vastfjall, & Mertz, Citation2008; Peters & Levin, Citation2008). Thus, less numerate individuals are more susceptible to the framing bias than highly numerate individuals because their judgements and evaluations are less sensitive to the numerical information, and they are polarised according to the positive or negative valence of the framing presented to them. By contrast, the judgements and evaluations of highly numerate individuals are less polarised because they are moderated in correspondence to the numerical information conveying the outcome proportions.
Another account emphasises the ability to go beyond the concrete numerical information and understand the relational information represented by numerical information (e.g., proportions or percentages). According to this account, both highly numerate and less numerate individuals may be attentive and sensitive to the numerical information; however, highly numerate individuals are ‘more likely to transform given information frames into normative equivalents’ (Peters, Citation2012, p. 32). Thus, when presented with the proportion of the positive outcome, for example, 75% success rate, the highly numerate individuals are more likely to reckon the complementary proportion of the negative outcome (e.g., 25% failure rate). Being able to grasp both the positive and the negative outcome proportions results in reduced bias.
The reviewed accounts are not mutually exclusive, and it may be that both mechanisms have a role in the role of numeracy in attribute‐framing bias. However, as noted by Reyna et al. (Citation2009), much of the work on the role of numeracy in biases in judgement and decision‐making ‘is merely descriptive, rather than explanatory or, as scientific theory ought to be, predictive based on knowledge of causal mechanisms’ (p. 967). Thus, even though these accounts have been posited by several researchers, they were typically advanced as post‐hoc explanations and suggestions rather than as theoretical accounts put to empirical examination.
The current study
The aim of the current article is to examine the first account, namely, that compared to less numerate individuals, highly numerate individuals are more attentive to numeric information and are consequently more sensitive to the magnitude of numbers. Hence, highly numerate individuals are expected to be less susceptible to the attribute‐framing bias. In order to examine this account, we used the typical positive–negative attribute‐framing manipulation. Critically, however, we also manipulated the negative‐ or the positive‐outcome proportions to examine two hypotheses:
Hypothesis 1. Attribute framing would bias the responses of all participants, such that they would provide more favourable evaluations to the description that presented proportions of success than to the logically equal description that presented proportions of failure. Moreover, attribute framing would result in a greater response bias among less numerate individuals than among high numerate individuals.
Hypothesis 2. High numerate individuals would be more sensitive to numerical magnitude. That is, their evaluations to both positive and negative framing scenarios would be more affected by different outcome proportions than the evaluations of less numerate individuals. Thus, higher success (or lower failure) proportions will yield more favourable evaluations than lower success (or higher failure) proportions among high numerate individuals, whereas smaller, if any, effect is expected among less numerate individuals.
We examined these hypotheses in two experiments. Experiment 1 was a laboratory experiment conducted in Hebrew using undergraduate students in a mixed design: Attribute framing was manipulated between participants, whereas the outcome proportions of success/failure was manipulated within participants. Experiment 2 used an online panel in a 2 (framing) X 3 (outcome proportions) between‐participants design.
EXPERIMENT 1
Method
Participants
A total of 139 undergraduate students (M age = 24.1; SD age = 2.5; 29% males) were recruited using e‐mail invitations offering them a voucher for the local cafeteria, valued at 20 New Israeli Shekels (about AUD 7). Participants were randomly assigned to one of the two framing conditions. The number of participants in each condition ensured sufficient statistical power (90% for Cohen's d = 0.50; Cohen, Citation1988).
Design
The experiment consisted of a 2 × 3 mixed factorial design, in which the two levels of framing (positive vs. negative) were manipulated between participants, whereas the three levels of outcome proportions (10–90 vs. 25–75 vs. 40–60) were presented to all participants. That is, all participants in the negatively framed group were presented with the proportions 10%, 25%, and 40%, whereas all the participants in the positively framed group were presented with the corresponding proportions 90%, 75%, and 60%.
Participants’ ratings on nine different items representing the three levels of outcome proportions served as the dependent variable. Items were counterbalanced across the three levels of outcome proportions so that each participant was presented with each level of outcome proportions in three different items; however, all items were presented at each level of outcome proportions an equal number of times across all participants.
Materials
Scenario and rating items
Participants were presented with the following text (in Hebrew): ‘Assume that you need to choose an elective course among several courses offered in your department. One elective course is important and relevant to your future studies and to your career plans. In the following screens you will be asked to rate to what extent you're inclined to choose this course based on the information provided about the course’. This scenario was followed by nine items describing the probabilities of different attributes of that course: failure/success, (non) compulsory attendance, classes (not) ending on time, (non) additional classes, best friends (not) taking the course, presentations (not) being uploaded to the course's website, (no) classroom noise and interference, (un)interesting class requirements, and (un)suitable class meeting schedule. The framing valence was manipulated between participants so that half the participants were presented with the positive version of each item (e.g., ‘There is a 75% chance that the lecturer will upload the presentations to the course's website’) and half with the negative‐framing version (e.g., ‘There is a 25% chance that the lecturer will not upload the presentations to the course's website’). The three outcome proportions were presented to all participants, such that each participant was presented with three items of each level of outcome proportions (namely 10%, 25%, and 40% for the negative framing condition; 90%, 75%, and 60% for the positive condition). Items were counterbalanced so that across all participants, each item appeared with each outcome proportion an equivalent number of times. For each item, all participants were asked to rate their decision regarding the extent to which they would choose the described course on a 7‐point Likert‐type scale ranging from 1 (‘I definitely will not choose this course’) to 7 (‘I will definitely choose this course’).
Numeracy scale
Participants completed a 13‐item numeracy scale, comprising nine items from Garcia‐Retamero and Galesic (Citation2010; see Lipkus et al., 2001 for the original scale) and four items from the Advanced Berlin Numeracy Test (Cokely et al., Citation2012). The combined scale assessed the ability to compare risk magnitude, convert percentages to proportions, convert proportions to percentages, convert probabilities to proportions, and compute probabilities. The scale showed adequate internal consistency in previous research, with Cronbach's alpha coefficients ranging from .66 to .75 (Cokely et al., Citation2012; Fagerlin et al., Citation2007; Lipkus et al., Citation2001). The alpha coefficient for the current study was .63. This value is close to the lower end of the above typical values. Each participant's score was his or her proportion of correct answers out of the 13 items.
Procedure
The study was performed in a computer laboratory and was presented to the participants as a ‘judgements study’. After signing an informed consent form, participants were asked to complete the two‐part computerised questionnaire, with the scenario items preceding the numeracy items. There were no time constraints, and participants took an average of 30 min to complete the questionnaire. The questionnaire was presented in Hebrew; the authors’ Institutional Review Board approved the study.
Results and discussion
Participants solved between 23% and 100% of the 13 numeracy items (M score = 58%, SD score = 17%). Using the Peters et al. (Citation2006) paradigm, we divided the sample into two similar‐sized groups of participants: those scoring lower on numeracy (71 participants who solved between 23% and 54% of the items correctly) and those who scored higher on numeracy (68 participants who solved between 58% and 100% of the items correctly).
As the individual items were not of specific interest but rather employed to reduce the effect of random error and increase the statistical robustness, and as the internal reliability indices of the three outcome proportions in the two framing conditions were acceptable for three items (between .60 and .76, the median was .72 for the items presented as 10%, 25%, 40%, 90%, 75%, and 60%), three response indices were computed by averaging the respective three items of each outcome proportion. For example, three variables were calculated for a participant in the negative framing condition: one averaging the answers to the three items relating to 10% probability, another averaging her answers to the three items relating to 25% probability, and a third variable averaging her answers to the three items relating to 40% probability. Three variables were also calculated for a participant in the respective positive framing condition, averaging the answers to the three items relating to 90%, 75%, and 60% probabilities.
Table presents the means and SDs of the response indices as well as the attribute‐framing effects for the three outcome proportions for each numeracy group. Table clearly shows that the attribute‐framing effect was in the hypothesised direction for all three outcome proportions and for the two numeracy groups: Participants’ responses were more favourable in the positive relative to the negative framing conditions. In most conditions, this effect was significant. However, for high numerate participants, the effect was smaller and did not reach significance level for the extreme outcome proportions, namely the 10% versus 90% and the 40% versus 60%.
Table 1. Mean response indices of the three outcome proportions as a function of framing and numeracy group (Experiment 1; N = 139)
With respect to the first hypothesis, namely, that numeracy will affect attribute‐framing bias, Table shows that for each of the three outcome proportions, the attribute‐framing effect size was larger for the less numerate group relative to the high numerate group. The respective effect sizes (Cohen's d) for the less numerate and high numerate groups were 0.75 versus 0.34 for the 10–90% proportions, 1.39 versus 0.76 for the 25–75% proportions, and 0.75 versus 0.42 for the 40–60% proportions. The attribute‐framing effect was statistically significant in all three outcome proportions for the less numerate group but only for the 25–75% proportions for the high numerate group. Thus, these findings are consistent with earlier findings that numeracy affects attribute‐framing bias: Less numerate participants are more susceptible to attribute‐framing bias relative to high numerate participants.
The second and main hypothesis argued that higher success (or lower failure) proportions will yield more favourable evaluations than lower success (or higher failure) proportions among high numerate individuals, whereas smaller, if any, effect is expected among less numerate individuals. Fig. 1 illustrates the comparable sensitivity of the less numerate and the high numerate groups to the outcome proportions: Both groups responded significantly more favourably to the 10–90% scenarios compared to the 40–60% scenarios, and in both groups, the 75–25% scenarios are generally in between.
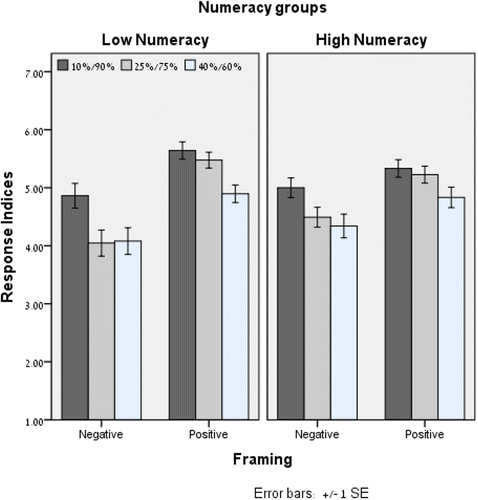
In order to examine the statistical significance of these findings, we conducted a three‐way analysis of variance for predicting participants’ responses from the outcome proportions (10–90%, 25–75%, and 40–60% as a within‐participants factor), framing conditions, and the dichotomous numeracy (as between‐participants factor). The three‐way interaction was not statistically significant, F(2, 270) = 0.42, p = .66, eta 2 = .003. This finding is consistent with the observation from Fig. 1 that participants in the two numeracy groups showed comparable sensitivity to the outcome proportions manipulation. This pattern is further supported by the analysis of the two‐way interaction of numeracy and the outcome proportion that was not statistically significant, F(2, 270) = 0.53, p = .59, eta 2 = .004. Hence, the findings provide no evidence to support the hypothesis that high numerate participants are more attentive and more sensitive to the magnitude of the outcome proportions than are lower numeracy participants.
By contrast, the interaction of framing and the outcome proportion was significant, F(2, 270) = 3.66, p = .03, eta 2 = .026, indicating that the framing‐effect sizes were different for the three outcome proportions. In addition, consistent with the first hypothesis, the interaction of framing and numeracy approached significance, F(1, 135) = 3.26, p = .07, eta 2 = .019. This finding is consistent with the pattern observed in Table where high numerate participants consistently show smaller framing bias compared to less numerate participants across the different outcome proportions conditions, suggesting that framing affected the two numeracy groups somewhat differently.
Finally, as for the main effects, as can be expected from the pattern of the interactions described above, numeracy did not have a significant main effect, F(1, 135) = 0.07, p = .79, eta 2 = .001; however, both the framing and the outcome proportion factors significantly affected the ratings, F(1, 135) = 31.81, p < .001, eta 2 = .191 and F(2, 270) = 21.36, p < .001, eta 2 = .137, respectively.
To conclude, the results of Experiment 1 were consistent with the first hypothesis as the attribute‐framing effect was higher in the less numerate group than in the high numerate group for all three outcome proportions. Critically, however, the findings were inconsistent with the second and main hypothesis as high numerate participants were not shown to be more attentive and more sensitive to the outcome proportions than their less numerate peers. One possible explanation for the latter finding is related to the specific tasks used in the within‐participant design of Experiment 1. As all participants rated the extent they would choose the described course for three different levels of outcome proportions, their ratings of later items might have been affected by their ratings of previous ones. Thus, it may be that participants’ tendency to respond coherently masked their sensitivity to the outcome proportion manipulation. Experiment 2 was designed to address this potential methodological caveat and replicate Experiment 1, using a between‐participants manipulation of the outcome proportion. Moreover, as Experiment 2 was not restricted to students, and used different scenarios that are relevant to a more general population, it is aimed to allow generalisation of the findings.
EXPERIMENT 2
Method
Participants
A total of 420 participants, recruited through Amazon Mechanical Turk (MTurk) (M age = 34.6; SD age = 11.9; 58% were male), completed the study for a compensation of AUD 0.66. Participants were pre‐screened to include only U.S. residents, aged 18 or above, who had completed at least 500 previous tasks on MTurk with a success rate of at least 95%.
Design
The design of Experiment 2 was a between‐participants 2 × 3 factorial design, including two levels of framing (positive vs. negative) and three levels of outcome proportions (10–90 vs. 25–75 vs. 40–60). Both framing and the outcome proportion factors were manipulated between participants.
Materials
Scenario and rating items
Participants were presented with the following text: ‘Imagine that you plan a vacation at an attractive destination. You find on the web a hotel that suits your budget, has all the facilities you require, and has available rooms on the dates of your planned vacation. You examine the recommendations written by guests who stayed at the hotel and discover that 90% [or 75% or 60%] were pleased with the hotel.’ (the negative framing wording replaced the last sentence by ‘… discover that 10% [or 25% or 40%] were not pleased with the hotel.’ Participants were then presented with three questions on 7‐point scales presented as sliders, relating to the scenario they read, on which they were asked to indicate how they would describe the hotel (1 = Disappointing, 7 = Amazing), how would they evaluate the hotel (1 = Terrible, 7 = Excellent), and would they order a room in the hotel (1 = Definitely not, 7 = Definitely yes).
Numeracy scale
Participants completed the 13‐item numeracy scale detailed in Experiment 1 (the alpha coefficient was .71).
Procedure
The study was administered as an online questionnaire using the MTurk platform. The study was approved by the authors’ Institutional Review Board, and it was presented to participants as research dealing with judgements and evaluations. As in Experiment 1, participants were instructed to complete a two‐part questionnaire. In the first part, participants were randomly presented with a vignette in one of the six experimental conditions manipulating the outcome proportions and the framing valence. Following the vignette questions, they were presented with the numeracy items.
Results and discussion
The internal reliability of the participants’ responses to the three items was very high (Cronbach's alpha = .94), with the three responses averaged to comprise a response index. Participants correctly solved between 0% and 100% of the 13 items numeracy test, averaging 75% (SD score = 15%; two participants failed to answer any of the 13 items correctly; since removing them from the analysis did not affect the pattern of the results, they were included in the analysis). As in Experiment 1, we divided the sample into two similar‐sized groups: those scoring lower on numeracy (237 participants solving between 0% and 69% of the items correctly) and those who scored relatively higher (183 participants solving between 77% and 100% of the items correctly). Table presents the means (and SDs) of the response indices, as well as the attribute‐framing effect for each of the three outcome proportions and the two numeracy groups.
Table 2. Mean response indices of the three outcome proportions as a function of framing and numeracy group (Experiment 2; N = 420)
Table shows that the attribute‐framing effect was very high and in the hypothesised direction for all three outcome proportions and for the two numeracy groups: Participants’ responses were more favourable in the positive relative to the negative framing conditions.
With respect to the first hypothesis, that numeracy would affect attribute‐framing bias, Table shows that the attribute‐framing effect was comparable in the two numeracy groups for the extreme outcome proportions (10–90% and 40–60%); only for the 25–75% outcome proportions, a higher bias was found for the less compared to the high numerate group (Cohen's d was 1.86 vs. 1.19).
The second and main hypothesis argued that the different outcome proportions would affect the judgements of highly numerate participants more than it would those of the less numerate participants. Fig. 2 presents participants’ responses as a function of the outcome proportions, the numeracy groups, and framing. It illustrates the comparable sensitivity of the less numerate and the high numerate groups to the outcome proportions: Both groups gave more favourable judgements to the 10–90% outcome proportions, less favourable to the 25–75%, and the lowest judgements to the 40–60% outcome proportions, and the pattern seems comparable for both positive and negative framing conditions (see Fig. 2).
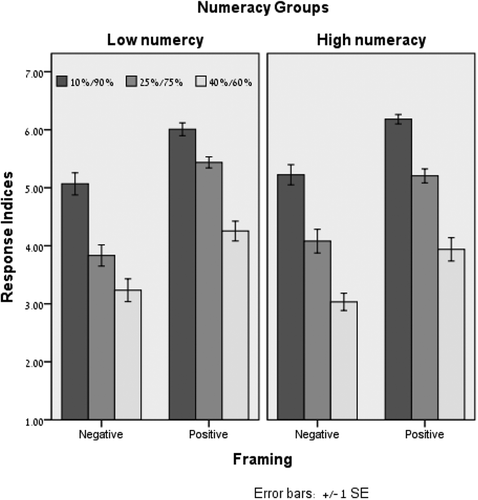
In order to examine the statistical significance of these findings, we conducted a between‐participants three‐way analysis of variance for predicting participants’ responses from the outcome proportions (10–90%, 25–75%, and 40–60%), framing, and the numeracy group. The three‐way interaction was not statistically significant, F(2, 408) = 0.61, p = .55, eta 2 = .003. None of the two‐way interactions were significant, specifically numeracy and outcome proportions, F(2, 408) = 1.66, p = .19, eta 2 = .008; framing and outcome proportions, F(2, 408) = 2.04, p = .13, eta 2 = .010; and numeracy and framing, F(1, 408) = 1.01, p = .32, eta 2 = .002. The numeracy main effect was not significant, F(1, 408) = 0.09, p = .77, eta 2 = .000; however, the other two main effects achieved significance: framing, F(1, 408) = 130.39, p < .001, eta 2 = .242, and outcome proportions, F(2, 408) = 146.00, p < .001, eta 2 = .417.
To conclude, the results of Experiment 2 were consistent with the first hypothesis in one of the three outcome proportions (25–75%) but were inconsistent with the second and main hypothesis as less numerate participants were as sensitive to the outcome proportions as were highly numerate participants.
GENERAL DISCUSSION
The findings of both experiments showed very clear attribute‐framing bias, ranging from medium to very high effect sizes (Cohen's d). These results clearly show that the framing manipulations generated a reliable and substantial bias in both experiments, each employing different scenarios and conducted in different languages.
Generally, the results were consistent with the hypothesis that numeracy would affect attribute‐framing bias. In four of the six outcome proportions across the two experiments, less numerate participants were more susceptible to attribute‐framing bias than were high numerate participants. These results are consistent with previous findings, showing that less numerate individuals are more susceptible than high numerate individuals to biases in judgement and decision‐making tasks in general (Garcia‐Retamero & Cokely, Citation2011, Citation2013, Citation2014; Garcia‐Retamero & Galesic, Citation2010; Peters et al., Citation2006) and to attribute‐framing bias in particular (Gamliel et al., Citation2016; Peters et al., Citation2006).
The novelty of this experiment was the manipulation of the outcome proportions. In both experiments, we manipulated the outcome proportions in order to examine the hypothesis that, compared to high numerate individuals, the less numerate individuals would be less attentive to numeric information, less sensitive to the magnitude of numbers, and consequently more susceptible to the framing bias. The findings of both experiments show that participants were sensitive to the outcome proportions of success/failure, such that evaluations were generally more favourable as the proportions of success increased and less favourable as the proportions of failure increased. Critically, both experiments revealed that less numerate participants were as sensitive to the different outcome proportions of success/failure as high numerate participants. Nevertheless, it seems that high numerate participants were less sensitive to the framing bias compared to their less numerate peers. These findings are inconsistent with the account maintaining that the higher susceptibility to attribute framing of the less numerate individuals, or the relative immunity to that bias of high numerate individuals, is driven by differential sensitivity to numeric magnitudes. While both groups were equally sensitive to the numerical magnitudes, the less numerate were mostly more susceptible to the framing bias than the high numerate. Were this finding to be replicated in future research, it would suggest that numeracy affects attribute‐framing bias not because of the differential sensitivity of individuals to the magnitude of numbers. Such findings would call for examining other explanations, such as the ability to go beyond the raw numbers and understand the relational information represented by proportions or percentages. According to this account, although both high numerate and less numerate individuals may be attentive to the numerical information, high numerate individuals are ‘more likely to transform given information frames into normative equivalents’ (Peters, Citation2012, p. 32).
While we did not predict an interaction between framing and the outcome proportions, the findings of both experiments revealed that the largest framing‐effect size was found for the 75–25% outcome proportions. It is possible that the values of 10%, 40%, 60%, and 90% facilitate better encoding and interpretation, either because they are round values (denominations of ten) or because they are close to actual success (10–90%) or to mere chance (40–60%). Specifically, the 10% failure could have been translated to ‘unlikely’, whereas the 90% success could have been translated to ‘almost certain’. Similarly, the 40% failure and 60% success could be translated to ‘nearly at chance level’. These explanations should be investigated in future research.
The manipulation of the outcome proportions could benefit future research on framing bias from several perspectives. As noted, this manipulation format could facilitate the investigation of the various theoretical accounts for attribute‐framing bias. In this study, we manipulated positive values above 50% and negative values lower than 50%. Future studies could compare such results to manipulating positive values lower than 50%and negative values above 50%.
Finally, the findings of this study were inconsistent with the hypothesis that high numerate individuals were more immune to the framing bias because they were more attentive and more sensitive than less numerate individuals to numerical information. The findings provide novel insights into the cognitive processes underlying the framing bias in general and the effect of numeracy: The findings revealed that it is unlikely that sensitivity to numeric magnitude modulates the effect of numeracy on attribute framing. Pending replication, these findings should encourage future research to empirically examine alternative cognitive processes that may underpin the effect of numeracy on framing bias. Future research may further extend this investigation to other biases in judgements and decision‐making associated with numeracy.
Related Research Data
REFERENCES
- Cohen, J. (1988). Statistical power analysis for the behavioral sciences (2nd ed.). Hillsdale, NJ: Erlbaum.
- Cokely, E. T. , Galesic, M. , Schulz, E. , Ghazal, S. , & Garcia‐retamero, R. (2012). Measuring risk literacy: The Berlin Numeracy Test. Judgment and Decision Making, 7, 25–47.
- Fagerlin, A. , Zikmund‐fisher, B. J. , Ubel, P. A. , Jankovic, A. , Derry, H. A. , & Smith, D. M. (2007). Measuring numeracy without a math test: Development of the subjective numeracy scale. Medical Decision Making, 27(5), 672–680. doi:https://doi.org/10.1177/0272989X07304449
- Freling, T. H. , Vincent, L. H. , & Henard, D. H. (2014). When not to accentuate the positive: Re‐examining valence effects in attribute framing. Organizational Behavior and Human Decision Processes, 124(2), 95–109. doi:https://doi.org/10.1016/j.obhdp.2013.12.007
- Gamliel, E. , Kreiner, H. , & Garcia‐retamero, R. (2016). The moderating role of objective and subjective numeracy in attribute framing. International Journal of Psychology, 51(2), 109–116. doi:https://doi.org/10.1002/ijop.12138
- Garcia‐retamero, R. , & Cokely, E. T. (2011). Effective communication of risks to young adults: Using message framing and visual aids to increase condom use and STD screening. Journal of Experimental Psychology: Applied, 17(3), 270–287. doi:https://doi.org/10.1037/a0023677
- Garcia‐retamero, R. , & Cokely, E. T. (2013). Communicating health risks with visual aids. Current Directions in Psychological Science, 22(5), 392–399. doi:https://doi.org/10.1177/0963721413491570
- Garcia‐retamero, R. , & Cokely, E. T. (2014). The influence of skills, message frame, and visual aids on prevention of sexually transmitted diseases. Journal of Behavioral Decision Making, 27(2), 179–189. doi:https://doi.org/10.1002/bdm.1797
- Garcia‐retamero, R. , & Galesic, M. (2010). How to reduce the effect of framing on messages about health. Journal of General Internal Medicine, 25, 1323–1329. doi:https://doi.org/10.1007/s11606‐010‐1484‐9
- Gardner, P. H. , Mcmillan, B. , Raynor, D. K. , Woolf, E. , & Knapp, P. (2011). The effect of numeracy on the comprehension of information about medicines in users of a patient information website. Patient Education and Counseling, 83, 398–403. doi:https://doi.org/10.1016/j.pec.2011.05.006
- Garofalo, J. , & Lester, F. K. Jr. (1985). Metacognition, cognitive monitoring, and mathematical performance. Journal for Research in Mathematics Education, 16(3), 163–176. doi:https://doi.org/10.2307/748391
- Keren, G. (2011). On the definition and possible underpinnings of framing effects: A brief review and a critical evaluation. In G. Keren (Ed.), Perspectives on framing (pp. 3–33). New York, NY: Psychology Press.
- Kühberger, A. (1998). The influence of framing on risky decisions: A meta‐analysis. Organizational Behavior and Human Decision Processes, 75(1), 23–55. doi:https://doi.org/10.1006/obhd.1998.2781
- Levin, I. P. , & Gaeth, G. J. (1988). How consumers are affected by the framing of attribute information before and after consuming the product. Journal of Consumer Research, 15(3), 374–378. doi:https://doi.org/10.1086/209174
- Levin, I. P. , Schneider, S. L. , & Gaeth, G. J. (1998). All frames are not created equal: A typology and critical analysis of framing effects. Organizational Behavior and Human Decision Processes, 76(2), 149–188. doi:https://doi.org/10.1006/obhd.1998.2804
- Lipkus, I. M. , Samsa, G. , & Rimer, B. K. (2001). General performance on a numeracy scale among highly educated samples. Medical Decision Making, 21, 37–44. doi:https://doi.org/10.1177/0272989x0102100105
- Mcneil, B. J. , Pauker, S. G. , Sox, H. C. Jr. , & Tversky, A. (1982). On the elicitation of preferences for alternative therapies. The New England Journal of Medicine, 306(21), 1259–1262. doi:https://doi.org/10.1056/nejm198205273062103
- Payne, J. W. , Sagara, N. , Shu, S. B. , Appelt, K. C. , & Johnson, E. J. (2013). Life expectancy as a constructed belief: Evidence of a live‐to or die‐by framing effect. Journal of Risk and Uncertainty, 46(1), 27–50. doi:https://doi.org/10.1007/s11166‐012‐9158‐0
- Peters, E. (2012). Beyond comprehension: The role of numeracy in judgment and decisions. Current Directions in Psychological Science, 21, 31–35. doi:https://doi.org/10.1177/0963721411429960
- Peters, E. , & Levin, I. P. (2008). Dissecting the risky‐choice framing effect: Numeracy as an individual‐difference factor in weighting risky and riskless options. Judgment and Decision Making, 3(6), 435–448.
- Peters, E. , Slovic, P. , Vastfjall, D. , & Mertz, C. K. (2008). Intuitive numbers guide decisions. Judgment and Decision Making, 3, 619–635.
- Peters, E. , Västfjäll, D. , Slovic, P. , Mertz, C. K. , Mazzocco, K. , & Dickert, S. (2006). Numeracy and decision making. Psychological Science, 17(5), 407–413. doi:https://doi.org/10.1111/j.1467‐9280.2006.01720.x
- Piñon, A. , & Gambara, H. (2005). A meta‐analytic review of framing effect: Risky, attribute and goal framing. Psicothema, 17(2), 325–331.
- Reyna, V. R. , Nelson, W. L. , Han, P. , & Dieckmann, N. F. (2009). How numeracy influences risk comprehension and medical decision making. Psychological Bulletin, 135, 943–973. doi:https://doi.org/10.1037/a0017327
- Schwartz, L. M. , Woloshin, S. , Black, W. C. , & Welch, H. G. (1997). The role of numeracy in understanding the benefit of screening mammography. Annals of Internal Medicine, 127, 966–972. doi:https://doi.org/10.7326/0003‐4819‐127‐11‐199712010‐00003
- Tversky, A. , & Kahneman, D. (1981). The framing of decisions and the psychology of choice. Science, 211(4481), 453–458. doi:https://doi.org/10.1126/science.7455683