
Abstract
Previous research has established an association between residential segregation and violent crime in urban America. Our study examines whether school-based segregation is predictive of arrests of juveniles for violent crimes in U.S. metro areas. Using Census, Uniform Crime Report, and Common Core data for 204 metro areas, a measure of school-based racial segregation, Theil's entropy index, is decomposed into two components: between- and within-district segregation. Findings reveal evidence of a significant interaction term: Within-district segregation is inversely associated with arrests for juvenile violence, but only in metropolitan areas with higher than average levels of between-district segregation.
NOTES
Notes
1 For an excellent summary of the multiple disadvantages produced by racial segregation, see CitationShihadeh and Flynn (1996:1329–33).
2 Theil's entropy index of segregation is dependent upon the measurement of diversity. Theil's measure of diversity is the entropy (E) of the population, defined as:
![]()
where Qr is the proportion of group r in the population. From this, H is defined as
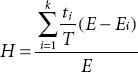
where T and ti are the total enrollment of the district (or metro area) as a whole and of school i. From this, H can be written as the sum of the between-district component and a within-district component that is the weighted average of k within-district segregation levels:
![]()
where Ed and E are the diversities for each district and the entire metro area, Td, and T are the enrollments for each district and the entire metro area, and Hd is the entropy index for a given district d. For a more comprehensive discussion of the decomposition of H, see CitationReardon et al. (2000).
3 We recognize that alternative measures of racial residential segregation have been employed to capture the association between it and violent crime (e.g., the use of a P* isolation index by CitationShihadeh and Flynn 1996). There are strengths and weaknesses to using any of the established measures of racial segregation, but we decided to utilize the most commonly used indicator of racial residential segregation because of its strengths and its popularity. However, we did examine parallel models including an exposure measure of segregation (substituting for Theil's entropy index) that excluded percent black (because such a measure is collinear with the exposure measure). The results were similar to the published results.
4 The denominator for the race-specific measures is the size of the race-specific population.
5 The Gini coefficient is the proportion of the total area below the 45-degree line that lies above the Lorenz curve, which plots the cumulative percent of households against the cumulative percent of household income.
6 We also substituted the percentage of black students in the MSA for percent black (residents) and found no substantive differences in findings (available upon request).
7 The index of dissimilarity, the measure of overall MSA residential segregation, has a correlation of .855 with Theil's entropy index, the measure of overall MSA school segregation.
8 Additionally, we did analyze a model that only included the within-segregation measure to evaluate whether the inclusion of the residential segregation (between-district) measure attenuated its association with black juvenile arrests. The within-segregation measure did not reach statistical significance in this model (results available upon request); clearly, such practices only matter in the context of between-district segregation.
9 At the urging of an anonymous reviewer, we also considered whether the associations between the school segregation measures and the race-specific dependent variables may be curvilinear (see CitationMoody 2001 for an example of such an association between school-based racial heterogeneity and friendship segregation). An examination of a partial regression leverage plot of each segregation measure and the dependent variables did not reveal support for any curvilinear relationship (graphs available upon request).