Abstract
The equity of a drug target is principally evaluated by its genetic vulnerability with tools ranging from antisense- and microRNA-driven knockdowns to induced expression of the target protein. In order to upgrade the process of antibacterial target identification and discern its most effective type of inhibition, an in silico toolbox that evaluates its genetic and chemical vulnerability leading either to stasis or cidal outcome was constructed and validated. By precise simulation and careful experimentation using enolpyruvyl shikimate-3-phosphate synthase and its specific inhibitor glyphosate, it was shown that genetic knockdown is distinct from chemical knockdown. It was also observed that depending on the particular mechanism of inhibition, viz competitive, uncompetitive, and noncompetitive, the antimicrobial potency of an inhibitor could be orders of magnitude different. Susceptibility of Escherichia coli to glyphosate and the lack of it in Mycobacterium tuberculosis could be predicted by the in silico platform. Finally, as predicted and simulated in the in silico platform, the translation of growth inhibition to a cidal effect was able to be demonstrated experimentally by altering the carbon source from sorbitol to glucose.
Introduction
Most anti-infective drug-discovery programs have focused their efforts on processes of identifying potential inhibitors against a target critical for the growth of the pathogen. A valid target at the genetic level is essential for the survival of the pathogen, and at the functional level, its structure and/or biological activity is substantially different from that of the host. This would hopefully lead to the identification of unique chemical entities that specifically inhibit the intended target. However, more often than not, target or cell based screens have either failed to generate leads that can be developed into molecules with antimicrobial potency or yielded inhibitors that kill the pathogen through a nonspecific/unknown mechanism of action. This has been exemplified in a review on anti-infective high-throughput screens by the GlaxoSmithKline research laboratories (Collegeville, Pennsylvania, USA), which indicated that the success rate of the path that linearly follows essential genes through high-throughput screens in the quest for novel anti-infectives has been abysmal.Citation1,Citation2 The lack of efficacy of potent enzyme inhibitors has been primarily attributed to the efflux of the molecule or lack of permeability across the bacterial cell wall.Citation3 This explanation has however remained predominantly unsubstantiated, as it is often difficult to determine the exact cause behind this lack of connection of “nanomolar potency” of enzyme inhibitors to concomitant antimicrobial effect. Evidence delineating enzyme inhibition and its effect on cellular growth has been demonstrated in a quantitative manner. Eisenthal and Cornish-Bowden have postulated two basic tenets by which the enzyme inhibition leads to the cessation of growth of an organism: “either the flux through an essential metabolic pathway can be decreased to a point where life is no longer possible or metabolite concentration can be increased to toxic levels.”Citation4 Recent findings have furthered our understanding of the molecular events that follow the inhibition of the target within the cell by the compound being tested, which results either in a stasis or cidal outcome. It is seen that independent of the target inhibited, bacterial cell death ultimately occurs through a generalized mechanism involving modulation of multiple pathways that generate free radicals.Citation5 Cidality due to the generation of free radicals arises when the intracellular redox ratio, ie, nicotinamide adenine dinucleotide (NAD)/reduced NAD (NADH) level, which is exquisitely balanced around 0.5–2 during growth under normal conditions, shoots beyond 5 on account of an enzyme/pathway inhibition by a bactericidal drug. Thus, anti-bacterials that are bactericidal lead to an elevated redox ratio, while there is no such change upon exposure to bacteriostatic drugs even with the cessation of growth. It would be ideal if one could predict objectively the modulation of this ratio based on a predictive in silico platform. The details of the first version of such an in silico tool for the bacteria Escherichia coli have been published.Citation6 A salient feature of this platform is its unique capability to predict the differential efficacy between the type of inhibitors (viz competitive, uncompetitive, noncompetitive). The updated version of this model has been used in the present work and it is an extension of the earlier tool with the inclusion of additional pathways built into it along with other additional features.
It is now generally accepted that instead of essential genes, vulnerable targets are more appropriate candidates in anti-infective drug discovery. Vulnerability is defined as the extent of inhibition of a target required to have a negative impact on growth, leading to cessation of cellular growth and ultimately cell death.Citation7,Citation8 The in silico platform thus offers an ideal computational base for the prediction of vulnerable targets. In addition, this tool also provides additional knowhow on the targets, such that they could then be categorized as those whose inhibition could lead to either bactericidal or bacteriostatic outcomes. In practical terms, this would entail the generation of a series of knockdown (10%–99.9%) of all the genes and then short-listing only those that translate to a growth arrest. An ideal way to test the veracity of the platform would be to identify such a vulnerable target, prove experimentally at a cellular level by generating knockdowns, and then cross-validate with an additional complementary approach, which in the current scenario would be through the use of known specific chemical moieties. There is a tacit but unsubstantiated assumption that targets that are genetically vulnerable are also chemically vulnerable and vice versa. To put this assumption to test, one needs a known small-molecule inhibitor that specifically inhibits an essential enzyme, has the capability to permeate into the cell, and in addition engages the target intracellularly. Among the many essential enzymes evaluated by the in silico platform one pair of target and a specific inhibitor was the enzyme 5-enolpyruvylshikimate-3-phosphate synthase (EPSPS) and glyphosate. This pair was used to test the equivalence of genetic and chemical vulnerability. Glyphosate (N-phosphonomethyl-glycine) is one of the most widely used herbicides in the world and exhibits broad-spectrum herbicidal activity with minimal human and environmental toxicity. The extraordinary success of this simple, small molecule is mainly attributable to the high specificity of glyphosate for the plant enzyme EPSPS coded by the gene aroA in the shikimate pathway, that leads to the biosynthesis of aromatic amino acids.Citation9,Citation10 EPSPS uses both shikimate-3-phosphate (S3P) and phosphoenolpyruvate (PEP) as substrates to produce inorganic phosphate and EPSP. Inhibition of EPSPS activity results in reduced biosynthesis of aromatic amino acids and also causes the accumulation of intermediates in the shikimate pathway (shikimic acid and some hydroxybenzoic acids), which may be toxic at high concentrations.Citation11 Using in silico modeling, we evaluated the genetic and chemical vulnerability of EPSPS and validated the predictions experimentally with the specific inhibitor glyphosate. Since the kinetic parameters of the inhibitors have to be plugged in to the platform for effective simulation, the enzymes from E. coli and Mycobacterium tuberculosis were characterized and their IC50 for glyphosate evaluated. The results unraveled a complex but logical linkage between genetic knockdown (GKD) and chemical knockdown (CKD).
Materials and methods
In silico platform
The Cellworks (Bangalore, India) E. coli platform is a virtual representation of the Gram-negative bacterium E. coli found maximally among human gut microflora. The current system is an extension of the earlier platform,Citation6 and comprises the following pathway blocks: NAD biosynthesis pathway, folate/chorismate biosynthesis pathway, purine biosynthesis pathway/pyrimidine biosynthesis pathway, pantothenate (vitamin B5) biosynthesis pathway, tricarboxylic acid cycle, glycolysis pathway, pentose phosphate pathway, Entner–Doudoroff pathway, fatty acid biosynthesis pathway, branched-chain amino acid biosynthesis pathway, and the cell-wall biosynthesis pathway.
Input towards development of in silico platforms was extracted from published data on enzyme kinetics, flux distribution, operon structures, and gene regulations. Dynamicity is conferred to the system by interconnecting ordinary differential equations describing kinetic behavior of each enzyme in the pathway, intracellular enzyme levels, and metabolite concentrations, as well as other kinetic parameters.
Once built, the system is validated against published literature. Validation ensures that the in silico system mimics the actual physiology of the biological system under the various conditions tested. The details of the validation protocol have been describer earlier;Citation6 a few additional features are described in Supplementary materials. The platform was built to model E. coli growth in media with either glucose or acetate or sorbitol as C-source under aerobic conditions.
The in silico platform can evaluate and differentiate between GKD and CKD. GKD is initiated by sequentially reducing the concentration of the target enzyme by any factor (from 10% to 99.99%). Since Vmax = kcat × [E], where E is the concentration of the enzyme, GKD is equivalent to reducing the Vmax by the same factor. In contrast, CKD has the possibility of three diverse implications. Depending upon the type of inhibition, viz competitive, uncompetitive, and noncompetitive and the Ki of the inhibitor, the relevant equation for the reaction is incorporated into the platform, and the downstream effect of the different kinds of inhibition can be modeled and measured (output in form of plots) based on biomass, growth rate, and other biochemical markers.
Biomass reduction or growth rate less than one-tenth of the wild type is indicative of stasis. On the other hand, the metric of cell death in an in silico platform is the redox ratio, which is NAD/NADH. Under normal growth conditions, this ratio is maintained at a constant value between 0.5 and 2. However, cidality causes an exponential increase in this ratio. Mutations (knockout or knockdown of genes), which cause the redox ratio to rise above 5, are found to be lethal (cidal effect) to the system. In contrast, mutations/changes either through genetic or chemical means that cause only the arrest of biomass without a concomitant increase in redox ratio are classified to be bacteriostatic. Several essential genes in E. coli were differentiated as cidal and static by this in silico platform.
Modeling and vulnerability of shikimate pathway
The shikimate pathway links the metabolism of carbohydrates to the biosynthesis of aromatic compounds. In a sequence of seven metabolic steps (), phosphoenol pyruvate and erythrose-4-phosphate are converted to chorismate, the precursor of the aromatic amino acids and many other aromatic secondary metabolites. Moreover, chorismate is also the primary substrate for the formation of folate in E. coli, which has an important contribution to biomass formation in the bacteria. One striking feature of the folate biosynthesis pathway is feedback inhibition of the folates on their own biosynthesis, which helps in maintaining their levels in the cell.
Figure 1 Network diagram of metabolic pathway of shikimic acid production in Escherichia coli.
Abbreviations: PEP, phosphoenol pyruvate; E4P, erythrose-4-phosphate; DAHP, 3-deoxy-D-arabino-heptulosonate-7-phosphate; DHQ, 3-dehydroquinate; DHS, 3-dehyroshikimate; SKM, shikimate; S3P, shikimate-3-phosphate; EPSP, 5-enolpyruvylshikimate-3-phosphate; CHA, chorismate.
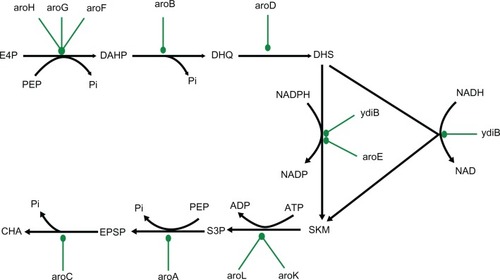
One of the genes of the shikimate pathway – aroA, has been extensively studied as it codes for aroA (EPSPS), the target enzyme for glyphosate, one of the well-known herbicides. It forms EPSP from S3P and PEP via an addition/elimination reaction.
To evaluate the vulnerability of the genes in the shikimate pathway, we have sequentially knocked down all the seven genes in the pathways from 10% to 99.99% by reducing the concentration of each of the enzymes and simulating the growth curve with glucose as the carbon source. To ascertain an interconnect between GKD and CKD, we also evaluated the vulnerability of the target gene aroA when the enzyme EPSPS was inhibited by an inhibitor like glyphosate. All the three different forms of inhibition type – competitive, uncompetitive, and noncompetitive – were tested and growth kinetics simulated at various concentrations of the inhibitor, ranging from 1 μM to 100,000 μM while keeping the Ki value at 3 μM for all the three types of inhibition.
PCR amplification, cloning, and expression of aroA from E. coli and M. tuberculosis
The aroA gene was polymerase chain reaction (PCR)-amplified from E. coli K-12 with gene sequence-specific primers with a cloning site NdeI in the forward and BamHI in the reverse primer. The primer sequences are EcoF5′ gagacatatggaatccct-gacgttacaac and EcoR5′ gagaggatcctcaggctgcctggctaatcc. For the M. tuberculosis aroA, the DNA from the strain H37Rv was used as the template. The forward primer was MtuF5′ gaga-catatgaagacatggccagcccca and the reverse primer was MtuR5′ gagaggatcctcaaccgccggacccctgcccg.Citation12 The PCR products were cloned into a TA cloning vector and the sequences confirmed. The inserts were then subcloned into the vector pET 20b at the NdeI and the BamHI sites. The clones with the confirmed insert were then transformed into E. coli BL21 (DE3) cells. It was seen that optimum soluble protein was expressed when the cells were grown overnight without the addition of the inducer isopropyl β-D-1-thiogalactopyranoside. The purification of the protein was through the usage of Q Sepharose and phosphocellulose columns. The final eluted protein was dialyzed against the storage buffer containing 50 mM Tris-HCl pH 7.5, 50 mM KCl, 0.4 mM DTT, and 10% glycerol at a concentration of 0.6 mg/mL for the E.coli EPSPS and 100 mM Tris-HCl pH 7.4, 50 mM KCl, 1 mM MgCl2, and 10% glycerol,Citation13 at a concentration of 3 mg/mL for the M. tuberculosis protein. All enzyme preparations were stored in buffer at −20°C until use. Protein quantification was done using the Bradford estimation method.Citation14 The purity of both the proteins was greater than 90%, as visualized by Coomassie blue-stained sodium dodecyl sulfate polyacrylamide gel electrophoresis.
EPSPS enzymatic activity/inhibition assay
Enzyme activity was measured by estimating the rate of inorganic phosphate released using a continuous spectrophotometric coupling assay with purine nucleoside phosphorylase (PNP EC 2.4.2.1) and 2-amino-6-mercapto-7-methylpurine ribonucleoside (MESG).Citation15 In the presence of inorganic phosphate, the substrate MESG was converted to ribose 1-phosphate and 2-amino-6-mercapto-7-methylpurine by PNP. This reaction with MESG resulted in a spectrophotometric shift in maximum absorbance from 330 nm for MESG to 360 nm for 2-amino-6-mercapto-7-methylpurine. An EnzChek® phosphate assay kit (E-6646),Citation16 from Molecular Probes (Life Technologies, Carlsbad, CA, USA) was used to monitor EPSPS enzymatic activity/inhibition assay. The reactions were carried out in a final volume of 100 μL or 200 μL in a 96-well, flat bottom, Corning (Tewksbury, MA, USA) Costar 9017 and 96-well half-area flat-bottom Costar 3695 plates. Using a SpectraMax plate reader (Molecular Devices LLC, Sunnyvale, CA, USA), all reactions were monitored for absorbance at 360 nm continuously every 30 seconds under the kinetics reading mode in SoftMax Pro (Molecular Devices). The final conditions used for 100 μL reaction were: pH 7.5, 50 mM Tris-HCl, 1 mM MgCl2, 100 μM sodium azide, 200 μM MESG, 20 ng EPSPS, 600 μM S3P, 450 μM PEP, and 0.1 U PNP. Each component in the assay was optimized and the final reaction volume was 100 μL. All reactions were started by adding the appropriate amount of EPSPS enzyme. All reactions with M. tuberculosis EPSPS were supplemented with 25 mM KCl. With excess substrate concentrations, 50 ng of enzyme maintained linearity for 15 minutes, and 12.5 ng of enzyme maintained linearity for 30 minutes. A reaction volume of 100 μl and an enzyme amount of 10–20 ng gave good linear range. PNP could be reduced to no less than 0.05 U/100 μL reaction to maintain sufficient rate for MESG modification.
Determination of kinetic parameters of E. coli EPSPS
EPSPS catalyzes a bisubstrate reaction. Therefore, in the determination of Km for the substrate, one substrate was provided in excess (5–10 Km), while the other substrate was given at various concentrations. All reactions were linear for at least 600 seconds, with R2 > 0.95. The data were collected as triplicates, and data points at the extreme ends with error > 10% were excluded. The data were plotted as rate versus substrate concentration. The average values were fitted using XLFit to equation 253 [Michaelis–Menten steady state model: v = Vmax/(1 + Km/x)].
Determination of kinetic parameters for M. tuberculosis EPSPS
Using the aforementioned conditions, we measured the Km for M. tuberculosis EPSPS for the substrates S3P and PEP using substrate concentrations ranging from 0.2 to 5 Km, as recorded for E. coli EPSPS. At lower substrate concentrations, the reaction lost linearity too soon and the data had large variations. Therefore, we reduced the enzyme to 5 ng to achieve better linearity.
Glyphosate sensitivity
Glyphosate, or N-phosphonomethyl-glycine, was procured from Sigma-Aldrich (St Louis, MO, USA). Preliminary results with glyphosate inhibition suggested that M. tuberculosis EPSPS is approximately 2 magnitudes less sensitive than E. coli EPSPS. Glyphosate has been shown to bind to the PEP-binding pocket of EPSPS. Here, we used saturating concentrations of S3P (∼5–6 Km) and saturating concentrations of PEP (10 Km for E. coli and 5 Km for M. tuberculosis) to compare the IC50 of glyphosate for E. coli and M. tuberculosis EPSPS. Using varying concentrations from 0.06 to 120 μM glyphosate, the IC50 for E. coli EPSPS was determined, whereas for M. tuberculosis EPSPS, glyphosate concentrations ranging from 3 to 3000 μM were used. The IC50 for glyphosate was calculated using GraphPad (La Jolla, CA, USA) Prism software. Rates from linear regions of the enzymatic reactions were taken. Triplicate data was plotted as %inhibition versus glyphosate concentration. The data were fit to equation 205, four-parameter sigmoidal dose-response model: y = (A + [{B − A}/{1 + ([C/x] × D)}]), where A, minimum inhibition, was set to 0% inhibition, and B, maximum inhibition was set to 100% inhibition. C gave the value of IC50 at 50% inhibition, while D gave the Hill coefficient of the sigmoidal inhibition curve.
Susceptibility testing: MIC and MBC for glyphosate
The minimum inhibitory concentration (MIC) of glyphosate against E. coli K-12 was determined using the broth microdilution method, wherein the MIC was taken as the lowest concentration at which no growth was observed. Briefly, serial twofold dilutions of the stock solution of glyphosate or an antibacterial agent were dispensed in a 96-well microplate, and to this 100 μL of inoculum (E. coli K-12 grown in M9 minimal media) with either glucose or sorbitol as the carbon source was prepared and added, such that the final cell number was approximately 5 × 10⁵ colony-forming units/mL. After 24 hours of incubation at 37°C, the plate was examined for inhibition of growth. The lowest concentration with no visible bacterial growth was defined as the MIC. Since EPSPS inhibition will lead to reduced synthesis of aromatic amino acids, supplementing the media with aromatic amino acids should lead to modulation of MIC. In order to check this reversal of MIC, the same growth media was supplemented with aromatic amino acid mixture (20 μg/mL each of tryptophan, phenylalanine, and tyrosine) and the MIC determination was redone with the modified media. Tetracycline (Sigma-Aldrich) and novobiocin (Sigma-Aldrich) were also screened for MICs under similar conditions, and these served as negative controls (drugs known to have a different mode of inhibition). Minimum bactericidal activity was determined by plating aliquots from the MIC plates on to M9 agar and enumerating the colony-forming units following 24-hour incubation at 37°C. Minimum bactericidal concentration (MBC) was defined as the concentration that caused a >99.9% reduction in colony-forming units.
Results
Predicting cidality and stasis
By definition, knockout of any essential gene would lead to the arrest of biomass that results in bacteriostasis. In some cases, there would be an additional change in the redox ratio rendering this process irreversible, and hence leading to cell death.Citation5 Following the initial revelation of the linkage between the increase in redox ratio and bacterial cidality, there has been limited corroboration of this former phenomenon,Citation17,Citation18 including the generation of reactive oxygen species. Possibly due to the diffusion/export of the cofactor to the growth media, in an experimental scale this change could be transitory and hence prove difficult to detect. In contrast, however transient the change in redox ratio is, the platform offers the advantage of capturing all the events. The upward shift in the redox ratio of the steady-state value (0.5–2) to almost 10 and above is currently considered as a generic marker of all bactericidal compounds. Studies with cidal compounds in our laboratory have corroborated this finding across bacterial species (Mycobacterium bovis bacillus Calmette–Guérin and E. coli) (unpublished observations).
Our in silico simulation indicates that knockout of some genes leads to an increase in redox ratio, while in other cases no such increase is seen. The genes showing the differential behavior once knocked out are listed in .
Table 1 Classification of genes as bacteriostatic (growth arrest) and bactericidal (growth arrest and increase in redox ratio)
Vulnerability of the genes in the shikimate pathway
In the shikimate pathway, the end-product chorismate is the essential precursor of the aromatic amino acids and many other critical metabolites (). Using the in silico E. coli platform, we simulated a graded knockdown of all the genes in the shikimate pathway with glucose as the carbon source (). All enzymes of this pathway that do not have any homologues in E. coli, viz aroB, aroD, aroA, and aroC, are deemed to be essential. What is to be noted additionally is that aroE, which has an isoform, ydiB, is also essential. This indicates that when the carbon source is glucose, in the absence of aroE, ydiB cannot compensate for the minimal flux through the pathway. The in silico simulation also indicates that none of the essential genes except aroC are vulnerable. The targets require a near-total knockdown to cause a cessation of growth. Comparing the results in and , it is also seen that in the case of aroA inhibition, the biomass arrest occurs prior to the increase of the redox ratio. The point of biomass arrest is equivalent to MIC, while the increase in redox ratio is equivalent to MBC. It is well known that MBC ≥ MIC, and the same relationship is reproduced in our in silico simulation.
Figure 2 Effect of different concentrations (250 μM, 500 μM, 1000 μM) of drug (uncompetitive inhibitor) against aroA on biomass in glucose media was estimated through in silico simulation.
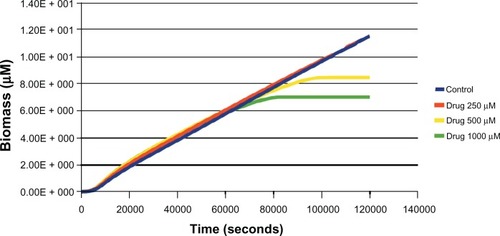
Figure 3 Effect of different concentrations (250 μM, 500 μM, 1000 μM) of drug (uncompetitive inhibitor) against aroA on redox ratio (nicotinamide adenine dinucleotide [NAD]/reduced NAD [NADH]) in glucose media.
![Figure 3 Effect of different concentrations (250 μM, 500 μM, 1000 μM) of drug (uncompetitive inhibitor) against aroA on redox ratio (nicotinamide adenine dinucleotide [NAD]/reduced NAD [NADH]) in glucose media.](/cms/asset/59c7e748-98e6-4372-b1e9-c7a83134cdd5/daab_a_39198_f0003_c.jpg)
Table 2 Graded knockdown data of shikimate pathway genes in glucose media and impact on growth
In order to compare between GKD and CKD, we compared the difference in vulnerability by simulating knockdowns by inhibitor with different mechanism, viz competitive, noncompetitive, and uncompetitive. We used the target aroA as it has a specific inhibitor – glyphosate. It was seen () that cell growth was vulnerable only at concentrations wherein the inhibitor is expected to be soluble and when the mode of inhibition was uncompetitive. It should be noted that binding of glyphosate to EPSPS has been shown to be uncompetitive with respect to S3P.Citation19 The predicted MIC of glyphosate was 500 μM when the mode of inhibition was uncompetitive. This mode of inhibition was preferred for all other essential targets from this pathway. All other types of inhibitors were found to be one to two orders of magnitude less potent (). Comparing the results from GKD () and CKD ( and ), it is evident that GKD is only a subset of CKD, as the latter has a diverse inhibition mode. As will be elaborated in the later sections, GKD is only equivalent to the noncompetitive CKD.
Figure 4 Effect of various inhibitors (uncompetitive, noncompetitive, competitive) on growth rate of Escherichia coli; uncompetitive inhibitor arrest growth at lower concentrations followed by noncompetitive and competitive inhibitors.
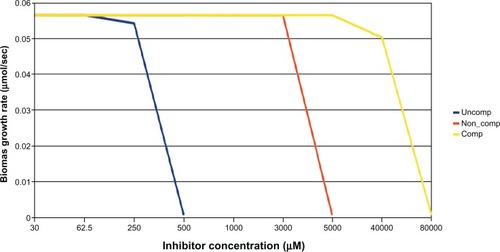
Table 3 Targets from shikimate pathway: relationship between MIC, flux, and the type of inhibition
Kinetic characterization of EPSPS
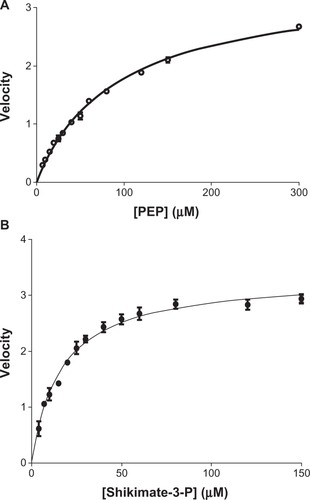
For E. coli EPSPS, the Km for S3P was ∼30 μM and the Km for PEP was ∼52 μM. All of these values lie within the range of previously reported Km values for the E. coli EPSPS enzyme.Citation20–Citation23 The current study has for the first time led to the unraveling of the kinetic characterization of M. tuberculosis EPSPS. Data reported here indicate that the Km for S3P and for PEP for the M. tuberculosis enzyme to be ∼16 μM and ∼104 μM, respectively, for the M. tuberculosis EPSPS ().
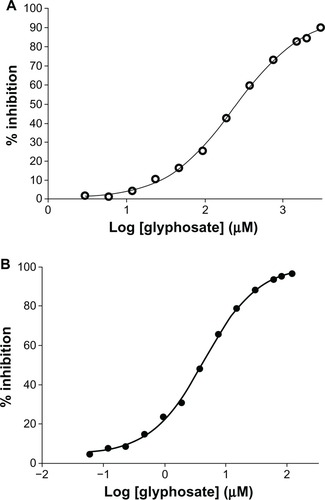
Figure 5 Determination of Km of shikimate-3-phosphate (S3P) and phosphoenolpyruvate (PEP) for Mycobacterium tuberculosis 5-enolpyruvylshikimate-3-phosphate synthase (EPSPS). Kinetic parameters of Mtu EPSPS determined at a concentration of one substrate and variable concentrations of the other. (A) Apparent Km for PEP was determined to be 104 μM (○–○); (B) apparent Km for S3P was determined to be 16 μM (•–•).
Kinetic parameters and glyphosate sensitivity
In our glyphosate IC50 studies, values for the M. tuberculosis EPSPS were about two orders of magnitude (260 μM) higher than values for the E. coli EPSPS (3 μM) (). These data may explain the lack of MIC for glyphosate in M. tuberculosis.
Figure 6 (A and B) IC50 determination. (A) Inhibition of Mycobacterium tuberculosis 5-enolpyruvylshikimate-3-phosphate synthase (EPSPS) by glyphosate. M. tuberculosis EPSPS was assayed in the presence of increasing concentrations of glyphosate. Data points (○–○) indicate mean of triplicate measurements. Analysis was done using GraphPad Prism software. The IC50 of glyphosate for the Mtu EPSPS was found to be 260 μM. (B) Inhibition of Escherichia coli EPSPS by glyphosate. E. coli EPSPS was assayed in the presence of increasing concentration of glyphosate. Data points (•–•) indicate mean of triplicate measurements. Analysis was done using GraphPad Prism software. The IC50 of glyphosate for E. coli EPSPS was found to be 3 μM.
The Km of PEP for M. tuberculosis EPSPS was marginally higher than that for the E. coli enzyme. In contrast, Eschenburg et alCitation23 have shown that for the E. coli G96A mutant EPSPS, which is insensitive to glyphosate, the Km for PEP is significantly higher. The G96A mutation affected the PEP/glyphosate-binding pocket and the interaction between the enzyme and both the substrate and the inhibitor. Our results indicate that the glyphosate insensitivity of the M. tuberculosis EPSPS is not a result of differences in the PEP/glyphosate-binding pocket, suggesting that structural differences in other parts of the EPSPS enzymes may be relevant.
MIC and MBC with glyphosate
The MIC of glyphosate for E. coli K-12 when the source of carbon is glucose was found to be similar to that when grown in sorbitol, ie, 600 μg/mL and 300 μg/mL, respectively (). In both the carbon sources, when the media is supplemented with aromatic amino acids (20 μg/mL each) the MIC shifts to a 5× - 10× higher value, thereby indicating the correct mode of action and that this agent targets the shikimate pathway. The MBC for glyphosate in glucose-containing media was ∼ MIC, which clearly indicates that the compound is bactericidal (). However, this was not the case when sorbitol was used as the carbon source. In the case of the latter, the MBC could not be deduced (≥2500 μg/mL).
Table 4 MIC of glyphosate in Escherichia coli K-12
Table 5 MBC of glyphosate for Escherichia coli K-12 estimated under different growth conditions
Discussion
The challenge in drug discovery is the identification of a specific inhibitor for a validated drug target, and an understanding of its downstream effect. With the in silico system described, it is not only possible to identify vulnerable targets but also to extend this further to aid medicinal chemists in discerning which type of inhibitor is best suited to kill the bacteria. The in silico technology offers the unique ability to perform knockdowns, knockouts, and overexpression studies and to check their effects on completely unrelated pathways and make predictions that are otherwise not obvious. In recent years, literature in anti-infective biology has seen a spurt of data for GKD of several essential genes. This has been masterfully reviewed.Citation24 It has been taken for granted that genes identified as vulnerable by GKD would be a better target than those that are not. Our results clearly indicate that this simple extrapolation may be misleading. GKD can be done in two different ways: either the mRNA of the target gene is reduced by antisense technology or the gene is put under an inducible promoter. In both these techniques, the downstream effect is the reduction of the concentration of the enzyme in the cell, which in enzymological terms is equivalent to reducing the Vmax while keeping Km unchanged. The effect of inhibitors on the kinetic parameters of a target enzyme is well known. In , we have listed the effects on Vmax and Km by different types of inhibitors. It is evident that only the inhibitors of the noncompetitive type will be equivalent to GKD. It should be borne in mind that small molecules that are pure noncompetitive inhibitors are rare, like the Mg ions binding to cysteine residues of enzymes to reduce Vmax while keeping Km unchanged and in protein–protein interaction between transcription factors.Citation25 Since there is an order of magnitude difference between efficacy pattern by different inhibitors, where uncompetitive inhibitors seem to be the most potent, it might be relevant to interrogate what value GKD brings to the anti-infective drug-discovery programs. In a similar vein, siRNA, which is equivalent to GKD, has been used in target validation in mammalian cells, and many times lack of efficacy has been observed.Citation26
Table 6 Relationship between inhibition type and kinetic parameters
The inhibition of glyphosate as a specific inhibitor of EPSPS in the area of herbicides is well documented. Similar studies were undertaken with E. coli and the mode of action confirmed using liquid chromatography-mass spectrometry (LC-MS), viz accumulation of shikimic acid following glyphosate exposure and the reversal of it in the presence of aromatic amino acids (data not shown).
The characterization of kinetic parameters of EPSPS along with the inhibition profile of glyphosate clarifies several issues. As in silico simulation suggests, the uncompetitive nature of its inhibition accentuates the MIC. In addition, as the simulation suggests (data not shown) and the experimental data indicate, there is loss of cidality () when the carbon source is switched from glucose to sorbitol. This can be explained based on the change in the NAD/NADH under both conditions. When glucose is converted to Glu-6 P, there is no net increase in NADH concentration, and consequently this does not alter the NAD/NADH ratio, whereas when the C source is changed to sorbitol, for each molecule of sorbitol that is converted to F-6P, there is a concomitant production of one molecule of NADH due to sorbitol dehydrogenase. This change brings about a decrease in the redox ratio, thereby explaining the lack of cidality when glucose is replaced with sorbitol.
As an orthogonal validation of the connection between MIC, IC50, and inhibitor type, the kinetic parameters of EPSPS of E. coli and M. tuberculosis, which share similar shikimate pathways, were evaluated. It was seen that the IC50 for glyphosate for M. tuberculosis was a couple of orders of magnitude higher than E. coli, thus explaining the lack of MIC (beyond the solubility of glyphosate, as the predicted MIC for M. tuberculosis is 30 mg/mL) for the former pathogen. With detailed structural analysis of aroA and glyphosate binding at hand, we now understand the structural features that make some aroA mutants insensitive to glyphosate.Citation27 It would thus be possible to make glyphosate analogues that are inhibitory to M. tuberculosis EPSPS, but with the added caveat that they need to be uncompetitive in their mode of inhibition to be effective.
In summary, the value of an essential target with regard to its vulnerability and the resultant translation to a cidal outcome is therefore dictated by the mode of its inhibition by the specific chemical entity as well as the milieu in which this interaction occurs.
Acknowledgements
The confirmatory mechanisms of action of glyphosate in E. coli mentioned were experimentally demonstrated by Asha Balakrishnan, Vinayak Nadiger, Ramanujulu Murugappan, and Sheela David, and the limited studies with cidal compounds across bacterial species (M. bovis bacillus Calmette–Guérin and E. coli) to identify biomarkers were performed by Pavithra Vishwanath. Thanks are due to deJonge Boudewijn, Gautam Sanyal, Suresh Solapure and Umender Sharma for internal review.
Supplementary materials
Knockout of PGI
Phosphoglucose isomerase (PGI) is the enzyme that mediates the reversible formation of fructose 6-phosphate from glucose 6-phosphate. When the gene encoding for the PGI enzyme is knocked out, glucose uptake by glycolysis is halted, since PGI initiates glycolysis. Important metabolites such as phosphoenol pyruvate and pyruvate become deficient, hence the TCA cycle slows down. This knockout shows normal cell growth due to rerouting of carbon metabolism towards the pentose phosphate and Entner–Doudoroff pathways, which otherwise (when PGI is present) contribute minimally to glucose uptake. The pentose phosphate and Entner–Doudoroff pathways replenish pyruvate and phosphoenol pyruvate; also, there is an additional contribution from glyoxylate shunt in the case of PGI knockout. This experimental observationCitation28 could be simulated in the in silico model using respective virtual gene knockout at a constant glucose source concentration of 670 μM. A comparison of the two is shown in Table S1.
Knockout of phosphoenol pyruvate carboxylase gene
Another flux-distribution study, in the case of a nonessential gene taken into account to validate the in silico system, is phosphoenol pyruvate carboxylase (ppc) gene knockout study. The ppc gene codes for the enzyme that mediates the formation of oxaloacetate from phosphoenolpyruvate. In the case of ppc gene knockout, there is a lack of formation of oxaloacetate, leading to cessation of the tricarboxylic acid cycle.
For the cell to survive, there is redistribution of flux in order to maintain the level of oxaloacetate. As a consequence, there is an observed upregulation of reaction producing oxaloacetate and downregulation of reaction using it. There is an increase in formation of oxaloacetate from malate (reaction catalyzed by the enzyme malate dehydrogenase). There is upregulation of shunt, which maintains malate levels. Also, there is a corresponding decrease in utilization of oxaloacetate to form phosphoenol pyruvate (reaction catalyzed by enzyme phosphoenol pyruvate carboxykinase).
This experimental observation reported in the literatureCitation28 could be simulated on the in silico system with glucose as the sole carbon source at a concentration of 670 μM (Table S2).
Knockout of two nonessential genes
The PGI enzyme catalyzes the conversion of glucose 6-phosphate to fructose 6-phosphate, while udhA (pyridine nucleotide transhydogenase) catalyzes the reoxidation of NADPH. Individually, both these genes are nonessential for the growth of the bacteria, as their knockout neither affects the biomass to a considerable level nor causes an increase in redox ratio (NAD/NADH ratio). Our model shows that both of these nonessential genes when knocked out together turn out to be lethal for the cell.
In a PGI mutant, glucose catabolism primarily takes place through the pentose phosphate pathway. This flux rerouting causes nearly a 100% overproduction of NADPH. PGI mutant shows low growth of the cell, while growth is abolished when udhA is knocked out in this mutant.
Such observation in wet lab suggests that udhA knockout turns out to be essential in conditions of NADPH excess in the system (such as in the case of PGI mutant), and similar results were obtained from the in silico system when simulated glucose was used as the sole carbon source with a concentration of 670 μM (Table S3 and Figure S1).
Table S1 Comparison of predicted flux distribution trends for pgi gene knockout mutant with reported experimental trends obtained using glucose as the sole carbon source
Table S2 Comparison of experimental and in silico result in case of ppc knockout mutant
Table S3 Growth rate in wild-type and pgi–udhA double knockoutCitation30
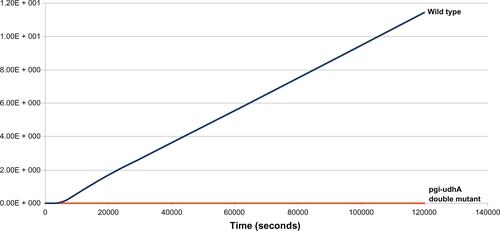
Figure S1 Effect of double knockout (pgi–udhA) on biomass levels and growth rates.
Notes: From the plot, growth rates (slope of the lines) of wild-type E. coli strain and pgi–udhA double-mutant strain can be compared. Simulation results show steady-state attainment of biomass in pgi–udhA double-mutant strain, which is indicative of growth arrest.
Disclosure
The authors report no conflicts of interest in this work.
References
- ChanPFHolmesDJPayneDJFinding the gems using genomic discovery: antibacterial drug discovery strategies – the successes and the challengesDrug Discov Today Ther Strateg20041519527
- PayneDJGwynnMNHolmesDJPomplianoDLDrugs for bad bugs: confronting the challenges of antibacterial discoveryNat Rev Drug Discov20076294017159923
- BlackMTBrutonGInhibitors of bacterial signal peptidasesCurr Pharm Des1998413315410197037
- EisenthalRCornish-BowdenAProspects for antiparasitic drugs. The case of Trypanosoma brucei, the causative agent of sleeping sicknessJ Biol Chem1998273550055059488673
- KohanskiMADwyerDJHayeteBLawrenceCACollinsJJA common mechanism of cellular death induced by bactericidal antibioticsCell200713079781017803904
- BarveAGuptaASolapureSMA kinetic platform for in silico modeling of the metabolic dynamics in Escherichia coliAdv Appl Bioinform Chem201039711021918631
- DattaSUnderstanding the characteristics of a good anti-infective drug targetJ Parasitic Dis199923139140
- KaurPAgarwalSDattaSIPTG inducible promoter system for delineating bacteristatic and bactericidal targets in mycobacteriaPloS One20094e592319526063
- PollegioniLSchonbrunnESiehlDMolecular basis of glyphosate resistance-different approaches through protein engineeringFEBS J20112782753276621668647
- BentleyRThe shikimate pathway – a metabolic tree with many branchesCrit Rev Biochem Mol Biol1990253073842279393
- de MaríaNBecerrilJMGarcía-PlazaolaJIHernandezADe FelipeMRFernandez-PascualMNew insights on glyphosate mode of action in nodular metabolism: role of shikimate accumulationJ Agric Food Chem2006542621262816569053
- OliveiraJSPintoCABassoLASantosDSCloning and over-expression in soluble form of fuctional shikimate kinase and 5-enolpyruvylshikimate 3-phosphate synthase enzymes from Mycobacterium tuberculosisProtein Expr Purif20012243043511483005
- OliveiraJSMendesMAPalmaMSBassoLASantosDSOne step purification of 5-enolpyruvylshikimate 3-phosphate synthase enzymes from Mycobacterium tuberculosisProtein Expr Purif20032828729212699693
- BradfordMA rapid and sensitive method for the quantitation of microgram quantities of protein utilizing the principle of protein-dye bindingAnal Biochem197672248254942051
- WebbMRA continuous spectrophotometric assay for inorganic phosphate and for measuring phosphate release kinetics in biological systemsProc Natl Acad Sci U S A199289488448871534409
- Molecular Probes. EnzChek Phosphate Assay Kit (E-6646) product information. 2002. Available from: http://probes.invitrogen.com/media/pis/mp06646.pdf. Accessed December 2, 2012.
- BowdenSDRamachandranVKKnudsenGMHintonJCThompsonAAn incomplete TCA cycle increases survival of Salmonella typhimurium during infection of resting and activated murine macrophagesPLoS One20105e1387121079785
- SinghAKarimpour-FardAGillRTIncreased mutation frequency in redox-impaired Escherichia coli due to RelA- and RpoS-mediated repression of DNA repairAppl Environ Microbiol2010765463547020581184
- AlibhaiMFStallingsWCClosing down on glyphosate inhibition – with a new structure for drug discoveryProc Natl Acad Sci U S A2001982944294611248008
- HuynhQKKishoreGMBildGS5-enolpyruvylshikimate 3-phosphate synthase enzymes from Escherichia coli, identification of Lys-22 as a potential active site residueJ Biol Chem19882637357393121621
- ShuttleworthWAEvansJNSSite-directed mutagenesis and NMR studies of histidine-385 mutants of 5-enolpyruvylshikimate 3-phosphate synthase enzymesBiochemistry199433706270688003471
- ShuttleworthWAPohlMEHelmsGLJakemanDLEvansJNSite-directed mutagenesis of putative active site residues of 5-enolpyruvylshikimate 3-phosphate synthase enzymesBiochemistry1999382963029890910
- EschenburgSHealyMLPriestmanMALushingtonGHSchönbrunnEHow the mutation glycine96 to alanine confers glyphosate insensitivity to 5-enolpyruvylshikimate 3-phosphate synthase enzymes from Escherichia coliPlanta200221612913512430021
- SharmaUCurrent possibilities and unresolved issues of drug target validation in Mycobacterium tuberculosisExpert Opin Drug Discov201161171118622646985
- SauroHMEnzyme Kinetics for Systems BiologyLexington (KY)Ambrosius2011
- LarssonESanderCMarksDmRNA turnover rate limits siRNA and microRNA efficacyMol Syst Biol2010643321081925
- LiLLuWHanYA novel RPMXR motif among class II 5-enolpyruvylshikimate-3-phosphate synthases is required for enzymatic activity and glyphosate resistanceJ Biotechnol200914433033619799945
- PengLArauzo-BravoMJShimizuKMetabolic flux analysis for a ppc mutant Escherichia coli based on 13C-labelling experiments together with enzyme activity assays and intracellular metabolite measurementsFEMS Microbiol Lett2004235172315158257
- FongSSNanchenAPalssonBOSauerULatent pathway activation and increased pathway capacity enable Escherichia coli adaptation to loss of key metabolic enzymesJ Biol Chem20062818024803316319065
- SauerUCanonacoFHeriSPerrenoudAFischerEThe soluble and membrane-bound transhydrogenases UdhA and PntAB have divergent functions in NADPH metabolism of Escherichia coliJ Biol Chem200427986613661914660605