
 ?Mathematical formulae have been encoded as MathML and are displayed in this HTML version using MathJax in order to improve their display. Uncheck the box to turn MathJax off. This feature requires Javascript. Click on a formula to zoom.
Abstract
Background
Transcriptional dysregulation is one of the most important features of cancer genesis and progression. Applying gene expression dysregulation information to predict the development of cancers is useful for cancer diagnosis. However, previous studies mainly focused on the relationship between a single gene and cancer. Prognostic prediction using combined gene models remains limited.
Materials and methods
Gene expression profiles were downloaded from The Cancer Genome Atlas and the data sets were randomly divided into training data sets and test data sets. A six-gene signature associated with head and neck squamous cell carcinoma (HNSCC) and overall survival (OS) was identified according to a training cohort by using weighted gene correlation network analysis and least absolute shrinkage and selection operator Cox regression. The test data set and gene expression omnibus (GEO) data set were used to validate this signature.
Results
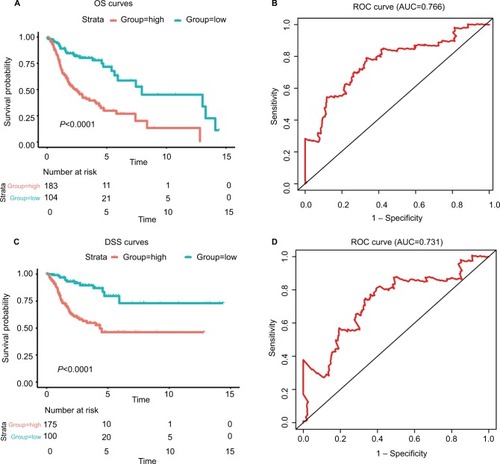
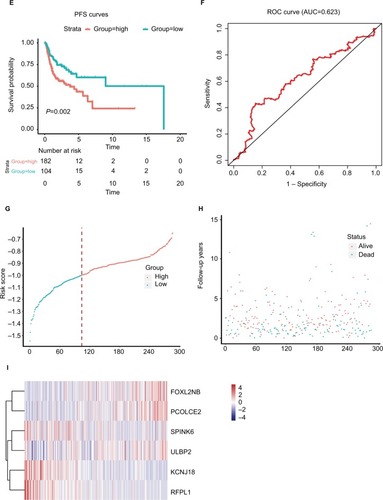
We identified six candidate genes, namely, FOXL2NB, PCOLCE2, SPINK6, ULBP2, KCNJ18, and RFPL1, and, using a six-gene model, predicted the risk of death of head and neck squamous cell carcinoma in The Cancer Genome Atlas. At a selected cutoff, patients were clustered into low- and high-risk groups. The OS curves of the two groups of patients had significant differences, and the time-dependent receiver operating characteristics of OS, disease-specific survival (DSS), and progression-free survival (PFS) were as high as 0.766, 0.731, and 0.623, respectively. Then, the test data set and the GEO data set were used to evaluate our model, and we found that the OS time in the high-risk group was significantly shorter than in the low-risk group in both data sets, and the receiver operating characteristics of test data set were 0.669, 0.675, and 0.614, respectively. Furthermore, univariate and multivariate Cox regression analyses showed that the risk score was independent of clinicopathological features.
Conclusion
The six-gene model could predict the OS of HNSCC patients and improve therapeutic decision-making.
Introduction
Head and neck cancer originates from the oral cavity, tongue, lip, gum, oropharynx, nasopharynx, and hypopharynx.Citation1 Head and neck squamous cell carcinoma (HNSCC) accounts for more than 90% of head and neck cancers and is the most common cancer in the world, causing 350,000 deaths every year.Citation2,Citation3 Furthermore, the 5-year survival rate of patients with this disease is lower than 50%.Citation4 However, in the past decade, there has been no significant improvement in the prognosis of HNSCC patients.Citation5,Citation6 Recent studies have found that tobacco use and human papillomavirus (HPV) status in patients with HNSCC had significant prognostic correlations.Citation3,Citation7–Citation9
Transcriptional dysregulation is a common feature of cancer genesis and development.Citation10 For instance, it was reported that forkhead box Q1 was closely related to pancreatic cancer, where its high-expression level correlates with a poor prognosis.Citation11 Forkhead box F2 was downregulated in esophageal squamous cell carcinoma, and low-expression levels were associated with poor prognosis.Citation12 Additionally, it was demonstrated that U3 small nucleolar ribonucleoprotein was upregulated in various cancers, and its levels are significantly associated with the survival of HNSCC patients.Citation3,Citation13 However, previous studies mainly focused on the relationship between a single gene and cancer. Due to this limitation in robustness, predicting models can result in false predictions. Prognostic prediction using combined gene models remains limited.
In this study, we applied weighted gene correlation network analysis (WGCNA) and least absolute shrinkage and selection operator (LASSO) Cox regression to identify a six-gene signature associated with HNSCC development and overall survival (OS) according to a training cohort.Citation14 The test data set and gene expression omnibus (GEO) data set were used to validate this signature, and we also demonstrated that this signature was independent from other clinical factors, including sex and age. In the training and validation data sets, patients with high-risk scores have relatively poor prognosis and receiver operating characteristic (time-dependent ROC) of OS is up to 0.766 and 0.669 in the training data set and test data set, respectively. Meanwhile, we found that the six genes had a close relationship with tumor grade, which was supported using linear regression analysis. In summary, we integrated WGCNA and LASSO Cox regression to develop a six-gene model, which could be a new prognostic marker significantly associated with prognosis and tumor grade in HNSCC.
Materials and methods
Data collection and preprocessing
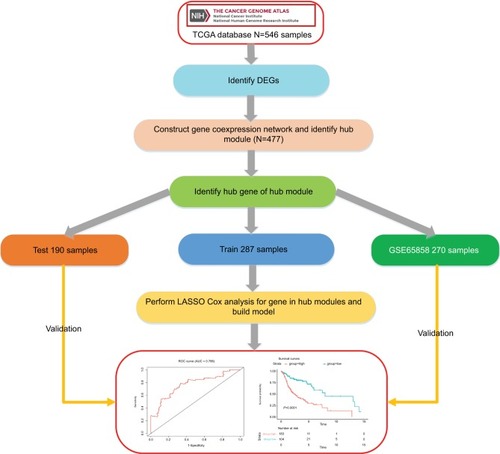
The workflow of this analysis procedure is shown in . The raw count data of HNSCC patients were downloaded from The Cancer Genome Atlas (TCGA) project (https://tcga-data.nci.nih.gov/tcga/), including 502 HNSCC patient samples and 44 control samples. The related clinical information for 502 patients was obtained from cBioportal (http://www.cbioportal.org/) and TCGA Clinical Data Resource (https://www.cell.com/cms/10.1016/j.cell.2018.02.052/attachment/f4eb6b31-8957-4817-a41f-e46fd2a1d9c3/mmc1.xlsx). After excluding the samples in which the neoplasm histologic grade could not be assessed (GX) or those without OS information, 478 samples were included in this study. The detailed information about clinical data of the 478 samples is shown in supplementary material S2.
Figure 1 Flow diagram of the analysis procedure: data collection, preprocessing, analysis, and validation.
Abbreviations: DEGs, differentially expressed genes; ROC, receiver operating characteristic; TCGA, The Cancer Genome Atlas.
Differential expression analysis
The differentially expressed genes (DEGs) of HNSCC were identified using “DESeq2” R package at a cutoff |log2 fold change|>1 and Padj < 0.01 (P-value adjusted for multiple testing using Benjamini–Hochberg method).
Construction of gene coexpression network
First, the counts data were normalized by the variance-stabilizing transformation algorithm implemented in DEseq2 package.Citation15–Citation17 Then, before network analysis, the HNSCC data were evaluated by clustering to check if there were any obvious outliers. After removing the outliers, 477 samples were retained, and the WGCNA package was used to construct the coexpression network.Citation14,Citation18 All other statistical information for the remaining samples are summarized in Table S1. In this study, we calculated Pearson’s correlation matrices and average linkage method for all pairwise genes. Then, a weighted adjacency matrix was constructed using a power function amn =|Cmn|β (Cmn=Pearson’s correlation between gene m and gene n; amn=adjacency between gene m and gene n). Parameter β is used to penalize weak correlations and emphasize strong correlations between genes. After choosing the appropriate β, the adjacency was transformed into a topological overlap matrix, and average linkage hierarchical clustering was performed according to the topological overlap matrix-based dissimilarity measure.Citation19,Citation20 In our study, we chose a minimum module size (gene group) of 30 for the gene dendrogram and a cutline (0.25) for the module dendrogram, and we merged some modules.Citation20
Identification of clinically significant modules
We identified the modules related to clinical traits using two approaches. The module eigengene (ME) of a module, calculated by the first principal component of the module, was used to represent the overall expression level of the module. Correlations between MEs and clinical traits were calculated to identify the cancer-relevant module. Then, gene significance (GS) was defined as the log10 transformation of the P-value (GS=logP) in the linear regression between gene expression and a clinical trait. In addition, the average GS for all the genes in a module was regarded as module significance (MS), and among all the modules, the module with the maximal absolute MS was regarded as the one related to clinical traits.
Construction of a weighted OS predictive score model
We randomly divided the data into training data sets (N=287) and test data sets (N=190). A Cox model was built using the LASSO algorithm with the training data set.Citation21 To find an optimal λ, tenfold cross-validation with minimum criteria was employed, and the λ with the smallest cross-validation error was chosen.Citation22,Citation23 Other parameters were set to default values. Finally, six genes were identified, and a formula for the risk score was constructed by using a linear combination of six genes weighted by the LASSO method in the training data sets. The LASSO Cox regression modeling was performed using the R package “glmnet”.Citation24,Citation25 A hazards model was constructed as follows:
Gene set enrichment analysis
In the entire data set, samples of HNSCC were divided into two groups according to the optimal cutoff value. This included 307 high-risk samples and 170 low-risk samples. To identify the potentially altered pathways in the high-risk group, we performed gene set enrichment analysis (GSEA) to search Kyoto encyclopedia of genes and genomesCitation26 (KEGG) pathways using the package “clusterProfiler”Citation27,Citation28 in R. Explicitly, we constructed a preranked gene list of all expressed genes ordered by log2 fold change from the DESeq2 package in two groups. Significant pathways with P-values<0.05 were identified.
Statistical analyses
We calculated a risk score for each patient in the training data set and divided the patients into high-risk and low-risk groups by using the optimal risk score (–1.0) as a cutoff determined by X-tile plots.Citation29,Citation30 Then, survival analysis was performed using the Kaplan–Meier method, and two-sided log rank tests were used to assess the differences in OS between the high-risk and low-risk patient groups. The sensitivity and specificity of the model was evaluated by using ROC curves. K–M survival curves and time-dependent ROC curve analyses were conducted on the survival, survminer, and survival ROC packages.Citation31–Citation33 Finally, we verified the confidence of the model using test data sets and entire data sets. Additionally, we conducted univariate Cox regression and multivariable Cox regression analyses to check whether the risk score was a prognostic factor within the available data. Meanwhile, linear regression analyses for the six genes in the entire data sets found that the six genes were highlighted, with P-values significantly <0.05. In all tests, a statistical significance was defined as a P-value <0.05, and all analyses were performed using the R program (www.r-project.org).Citation34
Results
Weighted coexpression network to identify the modules
We identified the input genes for coexpression network analysis by differential expression analysis. A total of 4,663 DEGs (2,282 upregulated and 2,381 downregulated) were selected at the threshold of |log2 fold change|>1 and Padj < 0.01 (Figure S1). After filtering the samples without suitable clinical information, 478 HNSCC samples were used. Then, we performed the first quality check, and one sample was removed from the TCGA data set for the subsequent analysis (Figure S2). At the same time, five types of clinical data, including histological grade, survival months, survival status, age, and sex of HNSCC patients, were used for clinical analysis.
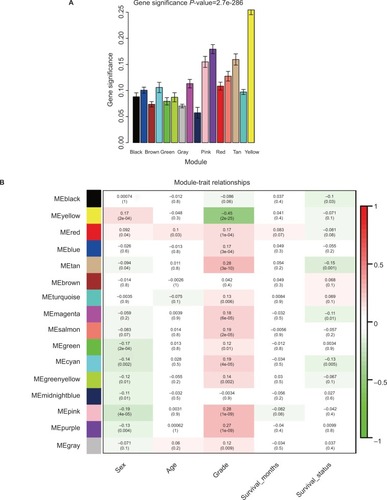
Applying the WGCNA package, the DEGs were analyzed for coexpression network analysis, and the power of β=4 (scale free R2=0.93) was selected to ensure a scale-free network, and finally, a total of 16 modules were identified (Figure S3A–E). Then, two methods were applied to test the association of each module with HNSCC progression. Modules with a larger MS were considered to have more connection with disease progression. We found that the ME of the yellow module also showed the highest GS (). In addition, the ME in the yellow module showed a higher correlation with disease progression than other modules (). Therefore, the yellow module with tumor progression was identified as the clinically significant module, which was selected for further analysis.
Figure 2 Identification of modules associated with the clinical traits of HNSCC.
Notes: (A) Distribution of average GS and errors in the modules associated with progression of HNSCC. (B) Heatmap of the correlation between MEs and clinical traits of HNSCC.
Abbreviations: GS, gene significance; HNSCC, head and neck squamous cell carcinoma; ME, module eigengene.
Six genes associated with the OS of HNSCC patients
We performed LASSO Cox regression to identify genes associated with HNSCC OS time by using hub module genes in the training data set. At the optimal λ=0.0810 in the LASSO Cox regression model, the ten fold cross-validation error was minimal (Figure S4). LASSO coefficient profiles of the hub module genes are shown in Figure S5. Finally, six genes were identified owing to their nonzero regression coefficients. By linearly combining the six mRNAs weighted by their coefficients, a hazards model was constructed as a formula of six genes:
Figure 3 The risk score performance in the training data sets.
Notes: (A-F) The survival plot and the 5-year survival ROC curve of OS, DSS, and PFS. (G–I) The relationship between risk score, survival information, and z-score transformed expression values are shown (top-down, FOXL2NB, PCOLCE2, SPINK6, ULBP2, KCNJ18, and RFPL1).
Abbreviations: AUC, area under the curve; DSS, disease-specific survival; OS, overall survival; PFS, progression-free survival; ROC, receiving operating characteristic.
Validation of the six-mRNA signature model using the test data set and GEO data set
To further verify the robustness of the hazards model, the performance of the hazards model was evaluated in the test data set (N=190). We used the same risk formula to calculate risk scores for HNSCC patients. Using the same cutoff value, patients were divided into low-risk and high-risk groups. Consistent results were observed that the OS, DSS, and PFS of the high-risk group were all significantly shorter than that of the low-risk group in the test group (P<0.05). The area under the curve (AUC) of time-dependent ROC curves for the test group was 0.669, 0.675, and 0.614, at 5 years, respectively (Figure S8A–F). Risk scores, relative expression levels, and survival information of the patients are also shown in this paper (Figure S8G–I). In addition, an independent microarray data sets GSE65858 and corresponding clinical data of 270 HNSCC patients were used to assess the prognostic power of the six-mRNA signature model developed in the TCGA data set.Citation35 The Kaplan–Meier analyses indicated that the OS time in the high-risk group was significantly shorter than that in the low-risk group (P<0.01). Meanwhile, the model could accurately distinguish high-risk patients from low-risk patients (Figure S8J).
Risk score, radiation, different HNSCC sites, HPV status, and other clinicopathological information for prognosis
To obtain a better understanding of the clinical significance of the six-gene signature in HNSCC, in the entire data set (N=477), we correlated the signature with a series of clinicopathological parameters, which include gender, age, alcohol, smoke, pathological tumor-node-metastasis (pTNM) stage, HPV status, radiotherapy, and histologic grade. As show in , the risk score is significantly associated with alcohol, pTNM stage, grade, and radiotherapy, while independent from age, gender, HPV status, and smoke. Meanwhile, to assess whether the prognostic ability of the six-gene signature was independent of other clinical features, univariate and multivariate Cox regression analyses were performed for the training data set. The result of univariate Cox regression indicated that the risk score was significantly associated with OS (high-risk group vs low-risk group, HR=3.314, 95% CI=2.135–5.145, P<0.01, n=287). Additionally, in multivariable Cox regression, the risk score also has a significant relationship with OS (high-risk group vs low-risk group, HR=3.302, 95% CI=2.080–5.242, P<0.01, n=287). Then, the same analysis was also performed in the test data set and a similar result was observed in this data set (). These results demonstrated that the prognostic ability of the six-gene was independent of other clinical features.
Table 1 Association of the six-mRNA signature with clinicopathological characteristics in HNSCC patients (n=477)
Table 2 Univariable and multivariable Cox regression analyses of the six-mRNA signature and survival of HNSCC patients in the training, test, and entire group
Since the six-mRNA signature might have different adaptability for various HNSCC sites,Citation36,Citation37 the six-mRNA signature model was assessed in larynx and oral tongue cancers. The Kaplan–Meier and ROC analyses revealed that patients in the high-risk group had significantly shorter OS and DSS compared with patients in the low-risk group in both larynx and oral tongue cancers (P<0.001), which indicated a good predictive performance (AUC was 0.798, 0.757, 0.704, and 0.767, respectively; Figure S9). In addition, HPV-positive patients were more likely than HPV-negative patients to have better survival.Citation38 According to , we found that there was no association between six-mRNA signature and HPV status. Considering the fact that HPV-positive patients had small sample size (n=14), we performed the Kaplan–Meier and ROC analyses in HPV-negative patients (n=63). The six-mRNA signature could distinguish high-risk patients from low-risk patients with high accuracy in HPV-negative patients (Figure S10). In the clinical practice, radiotherapy is the most common adjuvant of HNSCC treatment. To evaluate whether risk score is also suitable for patients underwent radiotherapy, we performed the Kaplan–Meier analysis. The results showed that the radiotherapy-treated HNSCC patients with high risk score had a significantly shorter survival rate than ones with low risk score (Figure S11). This suggests that the risk score is also feasible for the prognosis of HNSCC patients with radiotherapy.
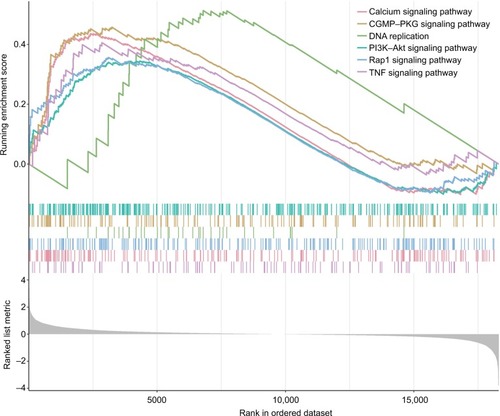
Altered pathways in high- and low-risk score group
GSEA was performed to identify the potential pathways that differentiate the high-/low-risk groups (Table S2). According to the results, we found that “Calcium signaling pathway”, “cGMP–PKG signaling pathway”, “PI3K–Akt signaling pathway”, “DNA replication”, “Rap1 signaling pathway” and “TNF signaling pathway” were significantly enriched (P-value <0.05; ), suggesting that the six-mRNA-based risk score may influence these pathways and thus predict the survival of HNSCC patients.
Figure 4 GSEA performed identify the potential pathways that differentiate the high-/low-risk groups.
Note: The graphs depict only the six common functional gene sets enriched in HNSCC samples.
Abbreviations: GSEA, gene set enrichment analysis; HNSCC, head and neck squamous cell carcinoma.
Discussion
In this paper, we applied a weighted coexpression network and found 16 modules base on DEGs from HNSCC. The correlation analyses were performed, and the yellow module showed the best correlation with tumor grade. As tumor grade always affects tumor prognosis, we then performed LASSO Cox regression to identify the key genes from hub module genes.Citation39–Citation41 Finally, a six-gene signature consisting of FOXL2NB, PCOLCE2, SPINK6, ULBP2, KCNJ18, and RFPL1 was identified from hub module genes in the training data set (n=287). The signature could also be used to classify HNSCC patients into low-risk and high-risk groups, which usually have significant differences in OS, DSS and PFS, and ROC is as high as 0.766, 0.731, and 0.623. These results suggested that this signature had a good performance in its survival predictions. Simultaneously, we evaluated the robustness of the model in the test data set and GEO data set. All of them suggested that the model was particularly good in accuracy. We also found significant differences (P<0.05) for each gene in the model across different tumor grades. To assess the independence of the six-mRNA signature in predicting OS, we performed univariate and multivariate Cox regression analyses.Citation42,Citation43 After adjusting the effects of age, grade, smoke, alcohol, and pathological tumor stage in the regression analysis, the risk scores of patients based on the six mRNA signature maintained a good correlation with OS. Overall, these results confirmed the prognostic power of the six-gene model for predicting the OS of HNSCC patients, and it was independent of other clinical features.
As for the characteristics of six mRNAs, the overexpression of FOXL2NB, PCOLCE2, and ULBP2 was associated with shorter OS (coefficient>0), whereas the overexpression of remaining SPINK6, KCNJ18, and RFPL1 was associated with longer OS (coefficient <0). Recently, some studies have revealed important roles in cancer progression of the six genes. For example, the altered expression of FOXL2NB was reported to be associated with cancer.Citation44 In addition, the expression of FOXL2NB was driven by FOXL2, which suppresses proliferation, invasion and promotes apoptosis of cervical cancer cells.Citation45,Citation46 PCOLCE2 promotes the enzymatic cleavage of type I procollagen to yield mature structured fibrils.Citation47–Citation49 Importantly, PCOLCE2 protein was detectable at appreciable levels in the ascites of ovarian cancer patients.Citation48 It was found that PCOLCE2 was involved in regulating adhesion and can predict tumors with high risk of developing metastasis within 43 months, establishing potential prognostic value.Citation50,Citation51 SPINK6 promotes nasopharyngeal carcinoma cellular motility in vitro and metastasis in vivo via autocrine and paracrine mechanisms.Citation52 In addition, SPINK6 may also play an important role in epithelial to mesenchymal transition regulation, which is a crucial process involved in development and differentiation, as well as motility of cancer cells, by binding to EGFR and activating EGFR and downstream AKT signaling pathway.Citation53 Cell surface ULBP2 was the NKG2D ligand most widely and strongly expressed by lung cancer cells, especially with non-small cell lung cancer cells.Citation54 Also, serum surface ULBP2 was detectable in lung cancer patients and it also was a prognosis indicator of ovarian cancer and melanoma.Citation54–Citation56 It also was a novel tumor marker to evaluate the risk of pancreatic cancer patients.Citation57 RFPL1 is a primate-specific target gene of Pax6, which is notably a key transcription factor for pancreas, eye and neocortex development.Citation58 RFPL1 inhibited HeLa cells proliferation through delaying cells entry into mitosis.Citation59 It has been found that RFPL1 was an antiproliferative gene, which downregulated cyclin B1 and Cdc2 expression and controlled G2–M phase transition thereby lengthened G2 phase in HeLa cells.Citation58
However, some limitations should be highlighted in our study. In this study, we just chose DEGs for coexpression analysis. They may be associated with OS in HNSCC. Then, big sample size allows a linear regression analysis to study the relationship between the expression level of six genes and tumor grade in the entire data set. Third, currently, only limited data can be used for performance evaluation and it is necessary to collect more data set for a more comprehensive evaluation. Finally, experimental studies is needed to investigate the functional roles and confirm the presence of gene products of the six genes in HNSCC by immunohistochemistry in future work.
In summary, we integrated coexpression network analysis and LASSO Cox regression to build a prognostic model. This model was validated in the test data set and in the entire data set. Our analysis results indicated its good performance in HNSCC prognosis. Functional annotation suggested that the selected genes may reflect the impact of some HNSCC related pathways, such as “Calcium signaling pathway”, “cGMP–PKG signaling pathway”,Citation60 “PI3K–Akt signaling pathway”,Citation61 “DNA replication”,Citation62,Citation63 “Rap1 signaling pathway”Citation64 and “TNF signaling pathway”.Citation65 Our findings will have important clinical implications for improving risk stratification, therapeutic decision-making and prognosis prediction in patients with HNSCC.
Conclusion
This is the first work to report a novel six-mRNA prognostic model on HNSCC prognosis and demonstrate the possible mechanism of this signature.
Acknowledgments
The work was supported by Professor of Chang Jiang Scholars Program, NSFC (81520108030, 21472238), Shanghai Engineering Research Center for the Preparation of Bioactive Natural Products (16DZ2280200), the Scientific Foundation of Shanghai China (13401900103, 13401900101), and the National Key Research and Development Program of China (2017YFC1700200).
Disclosure
The authors report no conflicts of interest in this work.
References
- ForastiereAKochWTrottiASidranskyDHead and neck cancerN Engl J Med2001345261890190011756581
- TorreLABrayFSiegelRLFerlayJLortet-TieulentJJemalAGlobal cancer statistics, 2012CA Cancer J Clin20156528710825651787
- GuoWChenXZhuLWangQA six-mRNA signature model for the prognosis of head and neck squamous cell carcinomaOncotarget20178559452829212247
- GollinSMCytogenetic alterations and their molecular genetic correlates in head and neck squamous cell carcinoma: a next generation window to the biology of diseaseGenes Chromosomes Cancer2014531297299025183546
- PfisterDGAngKKBrizelDMHead and neck cancersJ Natl Compr Canc Netw20119659665021636536
- KamangarFDoresGMAndersonWFPatterns of cancer incidence, mortality, and prevalence across five continents: defining priorities to reduce cancer disparities in different geographic regions of the worldJ Clin Oncol200624142137215016682732
- BensonELiREiseleDFakhryCThe clinical impact of HPV tumor status upon head and neck squamous cell carcinomasOral Oncol201450656557424134947
- KatiyarSKEmerging phytochemicals for the prevention and treatment of head and neck cancerMolecules201621121610
- AngKKHarrisJWheelerRHuman papillomavirus and survival of patients with oropharyngeal cancerN Engl J Med20103631243520530316
- MengGMeiHTranscriptional dysregulation study reveals a core network involving the genesis for Alzheimer’s diseasebioRxiv2017240002
- ZhanHXXuJWWangLWuDZhangGYHuSYFoxQ1 is a novel molecular target for pancreatic cancer and is associated with poor prognosisCurr Mol Med201515546947726122655
- ZhengYZWenJCaoXDecreased mRNA expression of transcription factor forkhead box F2 is an indicator of poor prognosis in patients with resected esophageal squamous cell carcinomaMol Clin Oncol20153371371926137292
- ClauditzTSWangCJGontarewiczAExpression of insulin-like growth factor II mRNA-binding protein 3 in squamous cell carcinomas of the head and neckJ Oral Pathol Med201342212513222643116
- LangfelderPHorvathSWGCNA: an R package for weighted correlation network analysisBMC Bioinformatics20089155919114008
- AndersSHuberWDifferential expression analysis for sequence count dataGenome Biol20101110R10620979621
- LoveMAndersSHuberWDifferential analysis of count data: the DESeq2 packageGenome Biol201415118655010
- LoveMAndersSHuberWPackage ‘DESeq2’2013
- ZhouZLiuSZhangMOverexpression of topoisomerase 2-alpha confers a poor prognosis in pancreatic adenocarcinoma identified by co-expression analysisDig Dis Sci201762102790280028815403
- BotíaJAVandrovcovaJForaboscoPAn additional k-means clustering step improves the biological features of WGCNA gene co-expression networksBMC Syst Biol20171114728403906
- RahmaniBZimmermannMTGrillDERecursive indirect-paths modularity (RIP-M) for detecting community structure in RNA-Seq co-expression networksFront Genet201678027242890
- GoemanJJL1 penalized estimation in the Cox proportional hazards modelBiom J2010521708419937997
- LiQBaiHChenYA fully-automatic multiparametric radiomics model: towards reproducible and prognostic imaging signature for prediction of overall survival in glioblastoma multiformeSci Rep2017711433129085044
- HaddadAQLuoJHKrabbeLMPrognostic value of tissue-based biomarker signature in clear cell renal cell carcinomaBJU Int2017119574174728075543
- FriedmanJHastieTTibshiraniRglmnet: Lasso and elastic-net regularized generalized linear models (R package version)200914
- LiHLiuJChenJA serum microRNA signature predicts trastuzumab benefit in HER2-positive metastatic breast cancer patientsNat Commun201891161429691399
- KanehisaMGotoSKEGG: Kyoto encyclopedia of genes and genomesNucleic Acids Res2000281273010592173
- SubramanianATamayoPMoothaVKGene set enrichment analysis: a knowledge-based approach for interpreting genome-wide expression profilesProc Natl Acad Sci USA200510243155451555016199517
- YuGWangLGHanYHeQYclusterProfiler: an R package for comparing biological themes among gene clustersOMICS201216528428722455463
- CampRLDolled-FilhartMRimmDLX-tile: a new bioinformatics tool for biomarker assessment and outcome-based cut-point optimizationClin Cancer Res200410217252725915534099
- TangKXuHPrognostic value of meta-signature miRNAs in renal cell carcinoma: an integrated miRNA expression profiling analysisSci Rep201551027225974855
- LumleyTTherneauTThe survival packageR News2004412628
- KassambaraAKosinskiMBiecekPsurvminer: Drawing survival curves using ‘ggplot2’ (R package version 0.3)2017 Available from: https://cran.r-project.org/web/packages/survminer/survminer.pdfAccessed December 06, 2018
- HeagertyPSahaP2013survivalROC: Time-dependent ROC curve estimation from censored survival data (R package version 1.0)
- Team RCR: A Language and Environment for Statistical Computing2013 Available from: http://softlibre.unizar.es/manuales/aplicaciones/r/fullrefman.pdfAccessed December 06, 2018
- ErixonPOxelmanBReticulate or tree-like chloroplast DNA evolution in Sileneae (Caryophyllaceae)?Mol Phylogenet Evol200848131332518490181
- KokkoLLHurmeSMaulaSMSignificance of site-specific prognosis of cancer stem cell marker CD44 in head and neck squamous-cell carcinomaOral Oncol201147651051621514878
- LlerasRASmithRVAdrienLRUnique DNA methylation loci distinguish anatomic site and HPV status in head and neck squamous cell carcinomaClin Cancer Res201319195444545523894057
- FakhryCWestraWHWangSJThe prognostic role of sex, race, and human papillomavirus in oropharyngeal and nonoropharyngeal head and neck squamous cell cancerCancer201712391566157528241096
- ZhouZChengYJiangYTen hub genes associated with progression and prognosis of pancreatic carcinoma identified by co-expression analysisInt J Biol Sci201814212413629483831
- YuanLChenLQianKCo-expression network analysis identified six hub genes in association with progression and prognosis in human clear cell renal cell carcinoma (ccRCC)Genom Data20171413214029159069
- ZhangJXSongWChenZHPrognostic and predictive value of a microRNA signature in stage II colon cancer: a microRNA expression analysisLancet Oncol201314131295130624239208
- GuoJCLiCQWangQYProtein-coding genes combined with long non-coding RNAs predict prognosis in esophageal squamous cell carcinoma patients as a novel clinical multi-dimensional signatureMol Biosyst201612113467347727714034
- GeYZXinHLuTZMicroRNA expression profiles predict clinical phenotypes and prognosis in chromophobe renal cell carcinomaSci Rep201551032825981392
- EyolEMurtagaAZhivkova-GalunskaMFew genes are associated with the capability of pancreatic ductal adenocarcinoma cells to grow in the liver of nude ratsOncol Rep20122862177218723007550
- PannetierMChassotAAChaboissierMCPailhouxEInvolvement of FOXL2 and RSPO1 in ovarian determination, development, and maintenance in mammalsSex Dev201610416718427649556
- LiuXLMengYHWangJLYangBBZhangFTangSJFOXL2 suppresses proliferation, invasion and promotes apoptosis of cervical cancer cellsInt J Clin Exp Pathol201474153424817949
- NaikMExpression of Procollagen C Proteinase Enhancer Proteins in Human Trabecular Meshwork Cells and TissuesFort WorthUniversity of North Texas Health Science Center2013
- FinkernagelFReinartzSLieberSThe transcriptional signature of human ovarian carcinoma macrophages is associated with extracellular matrix reorganizationOncotarget20167467533927659538
- BourhisJMVadon-Le GoffSAfracheHProcollagen C-proteinase enhancer grasps the stalk of the C-propeptide trimer to boost collagen precursor maturationProc Natl Acad Sci USA2013110166394639923550162
- KrólMPawlowskiKMSkierskiJTranscriptomic profile of two canine mammary cancer cell lines with different proliferative and anti-apoptotic potentialJ Physiol Pharmacol200960Suppl 195106
- LimSBTANSJWan-TeckLLIMCTAn extracellular matrix-related prognostic and predictive indicator for early-stage non-small cell lung cancerNat Commun82017173429170406
- ZhengLSYangJPCaoYSPINK6 promotes metastasis of naso-pharyngeal carcinoma via binding and activation of epithelial growth factor receptorCancer Res201777257958927671677
- ThieryJPAcloqueHHuangRYNietoMAEpithelial-mesenchymal transitions in development and diseaseCell2009139587189019945376
- YamaguchiKChikumiHShimizuADiagnostic and prognostic impact of serum-soluble UL16-binding protein 2 in lung cancer patientsCancer Sci201210381405141322587355
- WennerbergEPfefferleAEkbladLHuman anaplastic thyroid carcinoma cells are sensitive to NK cell-mediated lysis via ULBP2/5/6 and chemoattract NK cellsClin Cancer Res201420225733574425212604
- GuerraNTanYXJonckerNTNKG2D-deficient mice are defective in tumor surveillance in models of spontaneous malignancyImmunity200828457158018394936
- ChenJZhuXXXuHFangHZZhaoJQExpression and prognostic significance of unique ULBPs in pancreatic cancerOnco Targets Ther201695271527927621649
- BonnefontJLaforgeTPlastreOPrimate-specific RFPL1 gene controls cell-cycle progression through cyclin B1/Cdc2 degradationCell Death Differ201118229330320725088
- ChenWLuJQinYRet finger protein-like 3 promotes tumor cell growth by activating telomerase reverse transcriptase expression in human lung cancer cellsOncotarget20145231190925481043
- DeguchiADasKKXingSWOehlenBWeinsteinIBDown-Regulation of the cGMP/PKG Pathway in Primary Human Colon Cancers and Cancer Cell LinesProc Am Assoc Cancer Res2005465668
- MartiniMDe SantisMCBracciniLGulluniFHirschEPI3K/AKT signaling pathway and cancer: an updated reviewAnn Med201446637238324897931
- BoyerA-SWalterDSørensenCSDNA replication and cancer: from dysfunctional replication origin activities to therapeutic opportunitiesPaper presented at: Seminars in Cancer Biology2016
- MacheretMHalazonetisTDDNA replication stress as a hallmark of cancerAnnu Rev Pathol20151042544825621662
- ZhangYLWangRCChengKRingBZSuLRoles of Rap1 signaling in tumor cell migration and invasionCancer Biol Med20171419028443208
- SiveenKSSikkaSSuranaRTargeting the STAT3 signaling pathway in cancer: role of synthetic and natural inhibitorsBiochim Biophys Acta20141845213615424388873