
Abstract
Background
Several studies suggest that Proteasome 26S Subunit, ATPase (PSMC) family genes are of great importance in tumor progression and spreading, but the study for systematic evaluation of the function of PSMC genes in hepatocellular carcinoma (HCC) is currently lacking.
Methods
The functions of PSMC genes in HCC were analyzed using multiple online databases, including the TCGA database, GEO database, HPA database, cBioPortal database, DAVID, and KEGG pathway. Experiments were later conducted to verify PSMC expression.
Results
High levels of PSMC gene expression were detected in HCC tissues and PSMCs exhibited potentially powerful abilities in diagnosing HCC patients. All PSMC proteins are expressed to varying degrees in HCC tissues and high expression of the PSMC genes lead to poor prognosis in patients with HCC. Moreover, DNA methylation involves the regulation of the expression of PSMC2 and PSMC5 in HCC, and the levels of methylation of PSMC2 or PSMC5 correlate positively with patient overall survival in HCC patients. The copy number alteration and mutation of PSMC genes were observed and related to the expression of PSMCs in HCC. Functional enrichment analysis showed that many highly co-expressed genes of PSMCs had a potential role in tumor progression and metastasis, which merited further in-depth study. Functional network analysis also suggests that the primary biological function of PSMC genes is the regulation of protein homeostasis and energy metabolism in HCC. Moreover, the expression levels of PSMCs are related to immune cell infiltrates and immunomodulatory factors in HCC.
Conclusion
Our study indicates that PSMC genes are the potential target for precision immunotherapy and novel prognostic biomarkers for HCC.
Introduction
Primary liver cancer is a major worldwide health problem, with nearly 906,000 newly diagnosed patients annually and approximately 830,000 annual deaths.Citation1 Hepatocellular carcinoma (HCC) is the most common type of primary liver cancer and accounts for the great majority of liver cancer deaths.Citation2 Due to very few early-stage symptoms, HCC is often detected at a late stage, with a subsequent poor prognosis for most patients.Citation3 Nevertheless, a considerable proportion of patients still achieved remission and prolonged survival after treatment.Citation4 Exploration of the novel indicators with an ability to improve early diagnosis and therapeutic options in HCC is therefore warranted. Currently, tumor-targeted therapies are shifting the treatment outlook for patients with HCC.Citation5 An ideal therapeutic target should be highly expressed in tumor tissue and not expressed in normal, healthy tissues. However, effective molecular therapeutic targets are currently lacking, limiting the roles of molecular-targeted therapies in HCC. So, finding novel therapeutic targets is still meaningful for HCC treatment.
The 26S proteasome, an important proteasome species in eukaryotes, plays a proteolytic role in the cytoplasm and the nucleus.Citation6 The Proteasome 26S Subunit, ATPase (PSMC), acts as a regulatory subunit of the 26S proteasome, identifying the degradation signal and unfolding the target protein substrate. The PSMC gene family consists of PSMC1, PSMC2, PSMC3, PSMC4, PSMC5, and PSMC6.Citation7 It is widely believed that PSMC family genes have a significant role in tumor development in multiple human cancers. Previous studies showed that PSMC2 has tumor-promoting roles in diverse human cancers, such as gastric, ovarian, pancreatic, breast, and prostate cancer.Citation8–12 In addition, PSMC6 may also exhibit the ability to promote cancer cell growth, metastasis, and invasion in the lung.Citation13 However, at the moment, systematic research on the PSMC family genes and their potential as candidate prognostic markers and immunotherapeutic targets in HCC is lacking. Among the PSMC family genes, PSMC2 has been reported to promote HCC cell proliferation and cell cycling and holds great promise as a diagnostic and therapeutic target for HCC.Citation14 Although this study focused early on the ability of PSMC2 to evaluate the prognosis of HCC, it is still worthwhile to further explore the aberrant methylation, genetic alteration frequency, immune phenotypes, and molecular characterization of the PSMC family genes in HCC. Therefore, the systematic studies of PSMC family genes are beneficial for offering a new perspective on the biomarkers of HCC and then providing new ideas for patients’ prognosis, diagnosis, and treatment.
In the present study, we performed experiments and bioinformatics analysis to evaluate the diagnostic/prognostic/therapeutic value of PSMC family genes in HCC First, we sought to analyze the expression patterns, copy number alterations, mutations, and methylation patterns of the PSMC family genes in HCC tissues. Next, we assessed the clinical relevance of the PSMC genes and whether PSMC mRNA abundances were differentially associated with overall patient survival. We further evaluated the genes co-expressed with PSMC genes and their functional enrichment in HCC. Finally, we also assessed whether the PSMC expression levels are associated with the tumor immune cell infiltration in HCC. Our study may offer a theoretical foundation for investigating the PSMC family genes as potential diagnostic indicators, prognostic markers, and immunotherapy targets for HCC.
Materials and Methods
Public Data Acquisition
Gene expression data and patient clinicopathological information for HCC were extracted from The Cancer Genome Atlas database (TCGA, https://portal.gdc.cancer.gov/). RNA sequence data from 374 patients with HCC and 50 normal tissues were downloaded from the TCGA database. One independent microarray gene expression profiling data was downloaded from the Gene Expression Omnibus (GEO) database (https://www.ncbi.nlm.nih.gov/geo/), containing 12 normal liver tissue samples and 12 HCC tissue samples.
Differential Expression Analysis of PSMC Genes in Normal Liver and HCC Tissues
In the TCGA-HCC cohort, we used unpaired Mann–Whitney or paired Wilcoxon non-parametric tests to compare the expression of PSMC genes in different tissues. The mRNA level expression patterns of the PSMCs in a total of 24 different types of HCC cell lines were analyzed using the Expression Atlas, a value-added gene expression database (https://www.ebi.ac.uk/gxa/home).Citation15 After that, we evaluated the protein expression of PSMC genes in HCC tissues using the Human Protein Atlas (HPA) (https://www.proteinatlas.org/) server.Citation16 Furthermore, the area under the Receiver operating characteristic (ROC) curve was used to evaluate the ability of PSMC genes to distinguish between HCC patients and normal controls.
Assessing the Relationship Between PSMC Expression Levels and Clinical Variables of HCC Patients
In the TCGA-HCC cohort, the HCC patients were grouped by their clinical characteristics, including pathological T stage, histological grade, and pathological stage (Edmondson-Steiner grade). Next, we observed the differential expression of PSMC genes in those patients classified by clinical features. Significance testing was done by the Kruskal–Wallis test with a post hoc Dunn’s test.
The Survival Analysis Based on PSMC Expression Levels in HCC Patients
The TCGA HCC patients were dichotomized for survival analysis based on PSMC expression levels. Using the median PSMC expression level value as the cutoff point, we divided HCC patients into two groups (high and low). Kaplan Meier estimators of survival were used to visualize the survival curves. The Log rank test was used to compare overall survival between patients in different groups. Kaplan-Meier Plotter (https://kmplot.com/), a meta-analysis-based tumor biomarker assessment website, was also used to perform the survival analysis of PSMC in HCC patients.Citation17
Evaluation of Mutations, Copy-Number Alterations, and DNA Methylation Patterns in PSMC Genes Across HCC Patients
Gene mutation, methylation, and copy number alteration (CNA) data sets were downloaded and analyzed on the cBioPortal for Cancer Genomics platform (http://www.cbioportal.org).Citation18 Correlations between PSMC gene mRNA expression levels and methylation degree were examined by Pearson’s correlation analysis. We examined the additional prognostic value of the methylation levels in PSMC genes for predicting HCC patient outcomes using the MethSurv online tool (https://biit.cs.ut.ee/methsurv/).Citation19 In addition, we also assessed the relationship between CNA and PSMC gene expression using the Kruskal–Wallis test. Finally, the gene expression correlations between PSMC family members were analyzed by the use of Spearman’s rank correlation coefficient.
Functional Enrichment Analysis of the Co-Expressed Genes of PSMCs in HCC Patients
To identify the co-expressed genes of PSMCs, we used the TCGA HCC database from the cBioPortal server and the InteractiVenn online tool (http://www.interactivenn.net/) which confirmed the overlap in their co-expressed genes.Citation20 Therefore, we found 1369 common genes co-expressed with each PSMC family member and performed a deep analysis based on these co-expressed genes, including Kyoto Encyclopedia of Genes and Genomes (KEGG) and Gene Ontology (GO) enrichment analysis, by using a Database for Annotation, Visualization, and Integrated Discovery database (DAVID) function annotation tool (https://david.ncifcrf.gov).Citation21 Those co-expressed genes were analyzed using GO terms that provide a context of biological process (BP), cellular component (CC), and molecular function (MF), and the signaling pathways were identified by considering both p-value and count number. P values were corrected using the False discovery rate (FDR), and FDR values ≤0.05 were considered significant.
Analysis of the Correlation Between the PSMC Expression and the Abundance of Tumor-Infiltrating Immune Cells in HCC Patients
Using TCGA RNA sequencing data for HCC patients, we investigated the relationship between the PSMC expression and the abundance of eight types of immune cell infiltrates, including T cells, T helper cells, B cells, dendritic cells (DC), CD8 T cells, neutrophils, macrophages, and Regulatory T cells (TReg). We then selected eight immunomodulators that were previously identified as the regulators of the host immune response in HCC patients, including PDCD1, CD28, CD274, IDO1, IL10, CD8A, CTLA4, and LAG3.Citation22 Finally, we also determined the association between the PSMC expression and the abundance of seven immunomodulators in the TCGA-HCC cohort. Correlations were analyzed by P value and correlation coefficient.
RNA Extraction from HCC Tissue and Real-Time PCR
HCC tissue samples were from HCC patients, while normal liver tissue samples were adjacent non-cancerous tissue from HCC patients (normal tissue n=5 and HCC tissue n=5). These HCC patients were recruited from the Suining Central Hospital in 2022. The recruitment was approved by the institutional Ethics Committee, and each patient gave their informed consent. Our research complied with the Declaration of Helsinki. Total RNA was extracted from the samples using an RNAiso Kit and reverse transcription was performed to produce cDNA by using a cDNA synthesis kit according to the manufacturer’s recommendations. The mRNA levels of target genes and the housekeeping gene β-Actin in the tissues were examined by using an ABI PRISM 7900 Sequence Detection System. The primer sequences are listed in Supplementary Table 1.
Statistical Analysis
Statistical analyses were carried out using the statistical programming language R and two-tailed P values <0.05 were considered statistically significant. We used the R packages stats to analyze the differential gene expression. Survival analysis and ROC curve analysis were performed using the packages “survival” and “pROC”, respectively. Plots used in this manuscript were generated using the following R packages: survminer (time-to-event analyses), circlize (circular visualization plots), and ggplot2 (general plots).
Results
The mRNA and Protein Expression Levels of PSMC Genes in HCC
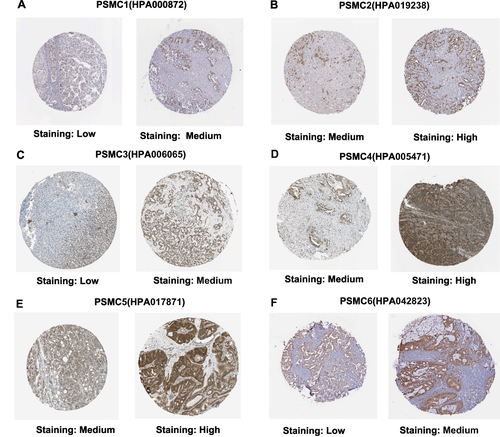
We used TCGA mRNA data to evaluate expression levels of PSMCs in HCC and showed that all PSMC genes are upregulated in HCC tissues compared with paired or unpaired normal liver tissues (). We next assessed the expression levels of PSMC genes across 24 HCC cell lines. The results showed that PSMC4 was discovered to be overexpressed in most of the selected cell lines followed by PSMC3 and PSMC2 (). All 374 TCGA HCC subjects were grouped according to the different aetiologies, including alcohol, hepatitis B/C, alcohol combined with hepatitis B/C, non-alcoholic fatty liver disease (NAFLD), and other causes. We found no significant differences in the expression levels of PSMCs in HCC tissues between groups. In addition, no significant differences in the PSMC5 expression levels were observed within normal liver tissues and NAFLD-related HCC tissues. However, PSMCs showed a higher expression level in other HCC tissue groups compared with that in normal liver tissues (Supplementary Figure S1). We also evaluated the protein levels of PSMCs in HCC tissues. The results showed that all PSMC proteins are expressed to varying degrees in HCC tissues (). The magnified immunohistochemical images showed that PSMCs localize in both the cytoplasm and nucleus (Supplementary Figure S2). PSMC proteins expressed at different levels may play various roles in both the initiation and progression of HCC. ROC curves were plotted to score the predictions of associations between PSMC genes and HCC, and the area under the ROC curve (AUC) was calculated. The accuracy of the diagnostic test is based on the AUC; the closer AUC is to 1, the better the test. Based on the estimated AUC values, all tests under evaluation had an acceptable overall diagnostic accuracy (>0.9), except PSMC1 for HCC (AUC: 0.772) (Supplementary Figure S3). The results showed the excellent diagnostic value of PSMC genes for HCC.
Figure 1 Differential expression analysis of PSMC1 (A), PSMC2 (B), PSMC3 (C), PSMC4 (D), PSMC5 (E), and PSMC6 (F) in HCC tissues compared to normal liver tissues in TCGA. Paired differential expression analysis of PSMC1 (G), PSMC2 (H), PSMC3 (I), PSMC4 (J), PSMC5 (K), and PSMC6 (L) in HCC tissues compared to matched normal adjacent tissues in TCGA. Expression patterns of PSMCs in different HCC cell lines (M).
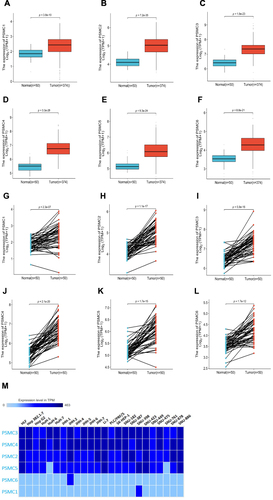
Figure 2 Immunohistochemical analysis showing different protein expression levels of PSMC1 (A), PSMC2 (B), PSMC3 (C), PSMC4 (D), PSMC5 (E), and PSMC6 (F) in HCC tissues. All representative IHC staining images are from the HPA server.
Survival Difference Between HCC Patients with High PSMC Expression and Patients with Low PSMC Expression
To assess the clinical significance of PSMCs in HCC, we examined the relationship between PSMC expression level and the clinicopathological characteristics of 374 TCGA HCC samples (Supplementary Figure S4). The results showed that PSMC4 and PSMC5 expression levels were higher in HCC patients with stage T2 than that in HCC patients with stage T1. Similarly, PSMC4 and PSMC5 expression levels in HCC patients with pathologic stage II were higher than stage I in TCGA HCC data, while PSMC1 expression levels were higher in HCC patients with pathologic stage III than that in HCC patients with stage I. We also compared HCC histologic grade with PSMC expression. The results showed that PSMC4 and PSMC5 expression levels in HCC patients with histologic grade G4 were higher than stage G1 in TCGA HCC data, while PSMC3 and PSMC4 expression levels were higher in HCC patients with histologic stage G3 than that in HCC patients with stage G1. However, there was no other significant difference in PSMC expression between different clinical stages.
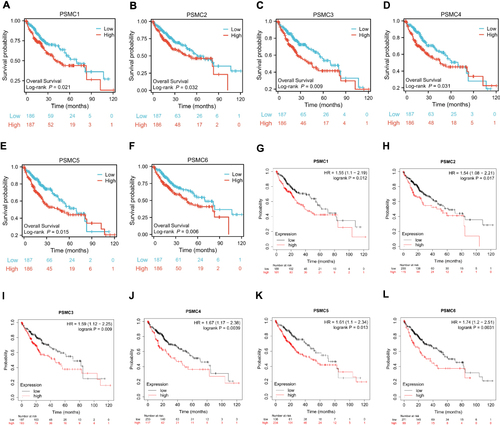
For survival analysis, TCGA HCC patients were grouped into low- and high-expression categories by use of the median expression of PSMC, and survival was assessed by Log rank test. The results revealed that high PSMC1 expression was associated with decreased overall (P=0.021) () and decreased disease-specific (P=0.031) (Supplementary Figure S5A) survival. Similarly, PSMC2 expression was negatively correlated with overall (P=0.032) () and disease-specific (P=0.031) (Supplementary Figure S5C) survival. Neither PSMC1 nor PSMC2 expression had an association with Progress Free Interval (PFI) in this cohort (Supplementary Figure S5Band D). Expression of PSMC3 (P=0.009) () or PSMC4 (P=0.031) () was also negatively correlated with overall survival (OS) but had no association with disease-specific survival (DSS) and PFI (Supplementary Figure S5E–H). Moreover, PSMC5 expression was negatively correlated with both OS (P=0.015) () and PFI (P=0.005) (Supplementary Figure S5J) but had no association with DSS (Supplementary Figure S5I). PSMC6 expression was inversely associated with OS (P=0.006) () and DSS (P=0.044) (Supplementary Figure S5K), but not with PFI (Supplementary Figure S5L). In addition to these, Kaplan–Meier survival curves were generated using Kaplan–Meier Plotter. The results also suggested that the higher expression of all PSMCs was correlated with poor OS ().
Figure 3 Kaplan-Meier overall survival curves in HCC from the TCGA consortium depicts; (A) PSMC1 expression; PSMC1 high versus PSMC1 low (B) PSMC2 expression; PSMC2 high versus PSMC2 low (C) PSMC3 expression; PSMC3 high versus PSMC3 low (D) PSMC4 expression; PSMC4 high versus PSMC4 low (E) PSMC5 expression; PSMC5 high versus PSMC5 low (F) PSMC6 expression; PSMC6 high versus PSMC6 low. Kaplan-Meier overall survival curves in HCC from the Kaplan-Meier Plotter depict; (G) PSMC1 expression; PSMC1 high versus PSMC1 low (H) PSMC2 expression; PSMC2 high versus PSMC2 low (I) PSMC3 expression; PSMC3 high versus PSMC3 low (D) PSMC4 expression; PSMC4 high versus PSMC4 low (J) PSMC5 expression; PSMC5 high versus PSMC5 low (K) PSMC6 expression; PSMC6 high versus PSMC6 low (L).
The Association of PSMC Methylation and Prognosis in Patients with HCC
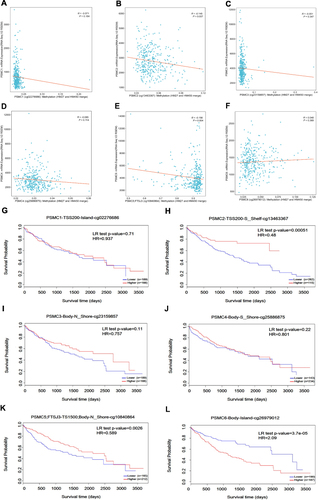
We analyzed the correlation between PSMC methylation and gene expression in HCC tissues. The results showed that the methylation levels of PSMC2 (Cor: −0.145, p= 0.007) () or PSMC5 (Cor: −0.156, p= 0.004) () were negatively correlated with gene expression, while the alterations in PSMC1, PSMC3, PSMC4, and PSMC6 methylation were not associated with the expression of genes (). We then further found the levels of methylation of PSMC2 (P=0.00051) () or PSMC5 (P=0.0026) () correlated positively with the survival of patients with HCC. However, we observed strong negative correlations between methylation levels of PSMC6 (P=3.7e-5) () and survival in HCC patients. Methylation levels of PSMC1, PSMC3, and PSMC4 were not associated with survival ().
Figure 4 Relationship between DNA methylation and PSMC gene expression (A–F) in HCC. Kaplan-Meier survival curves display the overall survival of HCC patients with high PSMC1 methylation compared to low PSMC1 methylation (G), high PSMC2 methylation compared to low PSMC2 methylation (H), high PSMC3 methylation compared to low PSMC3 methylation (I), high PSMC4 methylation compared to low PSMC4 methylation (J), high PSMC5 methylation compared to low PSMC5 methylation (K), and high PSMC6 methylation compared to low PSMC6 methylation (L).
Frequency of PSMC Mutation and Copy Number Alterations and Its Influence on Gene Expression
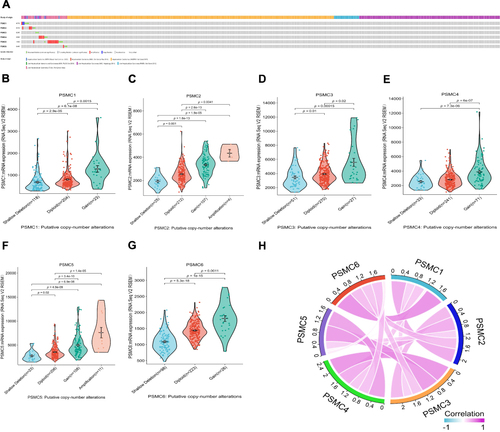
The mutation and copy number alteration frequency of PSMC genes in the studies on HCC were evaluated from the cBioPortal online tool. PSMC1, PSMC2, PSMC3, PSMC4, PSMC5, and PSMC6 showed an alteration frequency of 0.7, 0.7, 0.3, 0.8, 1.6, and 0.4%, respectively (). We next sought to assess the relationship between gene expression and CNA, including shallow deletion, diploid, gain, and amplification. We found that HCC patients with the PSMC gene copy number gain or amplification had a higher level of PSMC expression in HCC tissues, but only a small number of patients had the PSMC gene copy number gain or amplification (). This analysis suggested that CNA may not be the primary cause for the high expression of PSMC in HCC. In addition, a certain degree of gene expression correlation existed between different PSMC family members ().
Figure 5 Mutation analysis report on PSMC genes in HCC patients from cBioPortal (A). Relationship between CNA and the expression levels of PSMC1 (B), PSMC2 (C), PSMC3 (D), PSMC4 (E), PSMC5 (F), and PSMC6 (G) in HCC. The gene expression correlations between PSMC family members in HCC (H).
Functional Enrichment Analysis of the Co-Expressing Genes of PSMCs in HCC Tissues
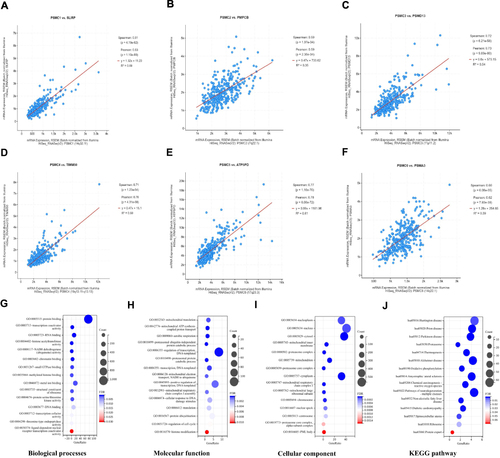
The co-expression data of PSMCs in HCC tissues were obtained using the cBioPortal for Cancer Genomics and the most significantly co-expressed gene of each PSMC was identified. The results showed a high co-expression correlation between SLIRP and PSMC1 (Cor: 0.81, p= 4.19e-82)(), a high co-expression correlation between PMPCB and PSMC2(Cor: 0.59, p= 1.97e-34) (), a high co-expression correlation between PSMD13 and PSMC3(Cor: 0.72, p= 6.21e-58) (), a high co-expression correlation between TIMM50 and PSMC4(Cor: 0.71, p= 1.23e-54) (), a high co-expression correlation between ATP5PD and PSMC5(Cor: 0.77, p= 1.16e-70) (), and a high co-expression correlation between PSMA3 and PSMC6(Cor: 0.60, p= 6.08e-35) (). Furthermore, we compared the co-expressed genes of PSMCs in HCC tissues and identified 1369 common genes. GO and KEGG enrichment analyses were conducted based on these common genes. GO enrichment analysis revealed that the biological processes involved mainly included protein binding, transcription coactivator activity, RNA binding, and histone acetyltransferase activity (). The major molecular functions of these common genes were mitochondrial translation, mitochondrial ATP synthesis coupled proton transport, aerobic respiration, and proteasomal ubiquitin-independent protein catabolic process (). In the cellular component analysis, these common genes were mainly related to the nucleosome, nucleus, cytosol, and mitochondrial inner membrane (). According to KEGG pathway analysis, these common genes were mainly involved in Huntington disease, Prion disease, Parkinson disease, and Proteasome ().
Figure 6 Top positively co-expressed genes of PSMC1 (A), PSMC2 (B), PSMC3 (C), PSMC4 (D), PSMC5 (E), and PSMC6 (F) in HCC tissues obtained from the cBioPortal. The enriched gene ontology terms of the 1369 common co-expressed genes of PSMCs in HCC tissues: (G) biological processes, (H) molecular function, (I) cellular component, and (J) KEGG pathway.
The Relationship Between Immune Infiltrate and PSMC Expression in HCC Patients
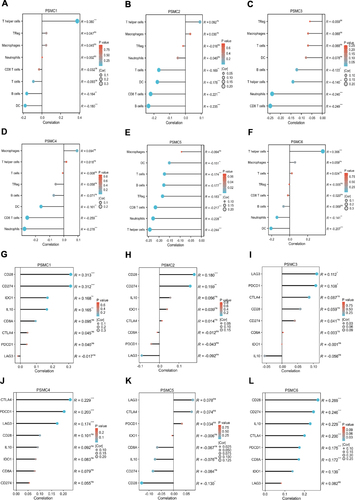
Here, we aimed to assess the relationship between the PSMC expression and the abundance of eight types of immune cell infiltrates in HCC tissues. PSMC1 positively correlates with T helper cells (Cor: 0.38, p <0.001), while it negatively correlates with B cells (Cor:-0.164, p <0.01) and DC (Cor:-0.18, p <0.001) (). The expression levels of PSMC2 negatively correlated with T cells (Cor:-0.169, p <0.01), DC (Cor:-0.178, p <0.001), CD8 T cells (Cor:-0.221, p <0.001), and B cells (Cor:-0.235, p <0.001) (). Moreover, gene expression of PSMC3 negatively correlated with T helper cells (Cor:-0.14, p <0.01), B cells (Cor:-0.122, p <0.05), CD8 T cells (Cor:-0.249, p <0.001), and neutrophils (Cor:-0.24, p <0.001) (). PSMC4 expression was also negatively correlated with DC (Cor:-0.161, p <0.01), CD8 T cells (Cor:-0.259, p <0.001), and neutrophils (Cor:-0.278, p <0.001) (). Besides that, PSMC5 expression was negatively correlated with T cells (Cor:-0.174, p <0.001), T helper cells (Cor:-0.244, p <0.001), B cells (Cor:-0.177, p <0.001), TReg (Cor:-0.183, p <0.001), CD8 T cells (Cor:-0.271, p <0.001), neutrophils (Cor:-0.228, p <0.001), and DC (Cor:-0.151, p <0.01) (). PSMC6 expression was positively correlated with T helper cells (Cor: 0.368, p <0.001), but was negatively correlated with neutrophils (Cor:-0.141, p <0.01) and DC (Cor:-0.207, p <0.001) (). We next assessed the relationship between PSMC expression and the immunomodulatory factors in HCC tissues. The expression of PSMC1 was positively correlated with the expression of CD28 (Cor: 0.313, p <0.001), CD274 (Cor: 0.312, p <0.001), IDO1 (Cor: 0.168, p <0.01), and IL10 (Cor: 0.165, p <0.01) (). PSMC2 mRNA levels showed a strong positive correlation with CD28 (Cor: 0.18, p <0.001) and CD274 (Cor: 0.159, p <0.01) expression in HCC tissues (). PSMC3 expression also showed a significant positive correlation with PDCD1 (Cor: 0.108, p <0.05) and LAG3 expression (Cor: 0.112, p <0.05) (). The expression level of PSMC4 exhibited a positive correlation with that of PDCD1 (Cor: 0.203, p <0.001), CTLA4 (Cor: 0.229, p <0.001), and LAG3 (Cor: 0.174, p <0.001) (). There was a significant negative correlation between PSMC5 expression and CD28 expression (Cor: −0.13, p <0.05) (). Finally, we found that PSMC6 expression correlated positively with the expression of PDCD1 (Cor: 0.175, p <0.001), CD28 (Cor: 0.269, p <0.001), CD274 (Cor: 0.246, p <0.001), IL10 (Cor: 0.229, p <0.001), CTLA4 (Cor: 0.2, p <0.001), CD8A (Cor: 0.172, p <0.001), and IDO1 (Cor: 0.139, p <0.01) ().
Figure 7 Association between the PSMC expression and the infiltration levels of immune cells (A–F) in HCC tissues identified in the TCGA database. Relationship between the PSMC gene expression and the immunomodulatory factors (G–L) in HCC tissues identified in the TCGA database. *p < 0.05, **p < 0.01, and ***p < 0.001.
Validation of the PSMC Genes Differentially Expressed Between HCC Tissue and Normal Liver Tissue
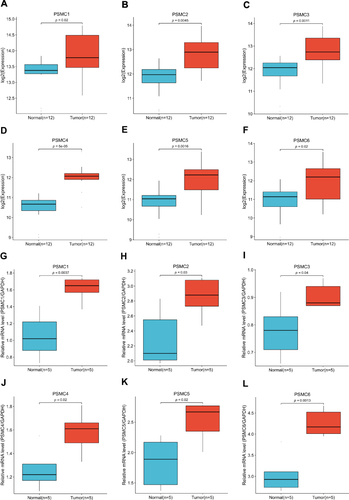
We performed external validation by downloading the full microarray dataset (GSE147888) from the GEO database. In HCC, PSMC1 (p <0.05) (), PSMC2 (p <0.01) (), PSMC3 (p <0.01) (), PSMC4 (p <0.001) (), PSMC5 (p <0.01) (), and PSMC6 (p <0.05) () were all expressed at higher levels in tumor tissues than in adjacent normal tissues. We next conducted real-time PCR to verify the PSMC genes differentially expressed between HCC tissue and normal liver tissue. As expected, the PCR validation also showed that the expression levels of PSMC1 (p <0.01) (), PSMC2 (p <0.05) (), PSMC3 (p <0.05) (), PSMC4 (p <0.05) (), PSMC5 (p <0.05) (), and PSMC6 (p <0.01) () in tumor tissues were significantly higher than that in normal tissues.
Figure 8 Expression pattern of the PSMC genes in HCC tissues (n = 12) and adjacent normal liver tissues (n = 12) obtained from the GSE147888 dataset: PSMC1 (A), PSMC2 (B), PSMC3 (C), PSMC4 (D), PSMC5 (E), and PSMC6 (F). Quantitative real-time PCR verification of the expression pattern of the PSMC genes in HCC tissues: PSMC1 (G), PSMC2 (H), PSMC3 (I), PSMC4 (J), PSMC5 (K), and PSMC6 (L).
Discussion
No previous studies have systematically investigated the roles of PSMC family genes in HCC development. In the present study, we sought to systematically identify PSMC family genes that could play a particularly important role in the initiation and development of HCC. Our findings reveal that high PSMC gene expression is associated with tumor immune cell infiltration and poor OS in HCC patients. In addition, the DNA methylation of PSMC genes may be involved in the development of HCC. Therefore, PSMC genes can be seen as oncogenes that are critical in HCC tumorigenesis and biomarkers for rapid tumor progression and poor prognosis in HCC.
Our study found that all the expression levels of PSMCs are significantly elevated in HCC tissues compared with the normal liver tissues. As expected, the expression levels of PSMCs in HCC tissues are nearly unaffected by the HCC etiologies. Accordingly, the expression of PSMCs is of diagnostic value for HCC. All PSMC proteins were also discovered to be expressed to varying degrees in HCC tissue, suggesting that they may play a certain function in the development of HCC. Previous studies have reported that PSMCs are highly expressed in multiple types of human tumor tissues.Citation23 For example, PSMC4 gene expression was found to be upregulated in a wide variety of human tumor tissues, including pituitary adenomas, oral squamous cell carcinoma, laryngeal cancer, breast cancer, and prostate cancer.Citation24–28 Not only that, PSMCs are considered to act as oncogenes and contribute to poor prognosis in multiple cancers. A previous study reported that PSMC1 promotes the proliferation and migration of lung adenocarcinoma cells and is related to poor prognosis in patients with lung adenocarcinoma.Citation29 PSMC5 may also promote the proliferation, invasion, and metastasis of colorectal cancer and its high expression correlates with poor prognosis in colorectal cancer.Citation30 Consistent with studies in other tumor types, high expression levels of PSMCs correlated with poor prognosis and shorter survival in HCC. Additionally, some of the PSMC genes’ expression in HCC were associated with clinicopathological features including pathologic stage and histologic grade. Therefore, it is essential to explore the molecular mechanisms that regulate PSMC expression in HCC.
In general, gene methylation could inhibit or activate gene expression, and sometimes differential methylation may be a potential target for epigenetic clinical decisions in cancer therapy.Citation31 In our study, we found that increased methylation of PSMC2 and PSMC5 has been associated with reduced gene expression in HCC, as has been reported for many genes. DNA methylation in the PSMC2 or PSMC5 gene body is positively correlated with the survival of patients with HCC. We thus inferred that the hypomethylation levels of PSMC2 and PSMC5 upregulate the expression of PSMC2 and PSMC5 in HCC, leading, in turn, to the very poor prognosis of patients with HCC. It is interesting to note that the PSMC6 methylation is not associated with the expression of PSMC6 in HCC, but is negatively correlated with the survival of patients with HCC. These results suggest that PSMC6 methylation may be involved in the regulatory role of PSMC6 in prognosis but not affect the expression of PSMC6 in HCC. Moreover, we also found that gene methylation is not only irrelevant to the expression of other PSMC genes in HCC but also to the roles of other PSMC genes in affecting the outcomes of patients with HCC. To our knowledge, CNA are likely to influence gene expression and are associated with various human cancers, including HCC.Citation32,Citation33 Although we also found that all the PSMCs have multiple CNA, CNA of PSMCs are not sufficient to promote high expression of PSMCs in HCC. Previous studies have shown that the gene expression correlation existed between different PSMC family members in lung adenocarcinoma.Citation34 We observed the same phenomenon in HCC and the relationship between different PSMC family members needs to be explored further.
Co-expression network analysis found that SLIRP is the gene with the highest positive correlation to PSMC1 expression in HCC, which may regulate mitochondrial function and adversely affect the prognosis of head and neck squamous cell carcinomas.Citation35 PMPCB, the gene with the highest positive correlation to PSMC2 expression, is thought to be associated with HCC resistance to sorafenib treatment.Citation36 PSMD13, the most positively correlated gene with PSMC3, is considered to be a valid predictor of prognosis and therapeutic response in patients with HCC.Citation37 Co-expressed TIMM50 gene is most relevant to the PSMC4, which negatively correlates with patient prognosis in multiple cancer types, such as lung cancer and breast cancer.Citation38,Citation39 ATP5PD, the most positively correlated gene with PSMC5, promotes hepatitis B virus (HBV) replication and expression and is considered to be a new biomarker for HBV-related HCC treatment.Citation40 Co-expressed PSMA3 gene is most relevant to the PSMC6 and its overexpression is associated with poor clinical prognosis in various malignancies, such as breast cancer and pancreatic ductal adenocarcinoma.Citation41,Citation42 In this study, we found that the expression of PSMD13, TIMM50, ATP5PD, and PSMA3 revealed negative associations with the prognosis of HCC patients (Supplementary Figure S6). Because the co-expressed genes have functional relevance, these scientific shreds of evidence indicate that the PSMC family genes likely have potential roles in driving transformation from healthy liver cells to malignancies.
According to the GO enrichment analysis, the genes co-expressed with PSMC genes in HCC were mainly enriched in functional terms related to protein homeostasis and energy metabolism. In addition, KEGG pathway analysis showed enrichment of these genes in pathways related to the diseases caused by the accumulation of denatured proteins in cells. As we now know, PSMCs, an important part of the 26S proteasome, can recognize the degradation signal and unfold the target protein substrate. Our findings are in line with previous studies, which suggested that PSMCs may also play important roles in HCC development through their effects on denatured proteins in cells.
Accumulating research has shown that immunosuppression by infiltrating immune cells leads to tumor immunotolerance.Citation43 This study found that PSMC expression was related to the tumor infiltration degrees of various immune cells in HCC. In addition, multiple PSMC expression levels were closely related to immunomodulator expression, such as CD274 (commonly known as programmed death-ligand 1; PD-L1) and CTLA4. Therapeutic targeting of CTLA4 and PD-1(alias: PDCD1) constitutes the backbone of immunotherapy for solid tumors.Citation44 In terms of the mechanism, the interaction between PD- L1 and PD-1 results in broad dephosphorylation of T cell-activating kinases and subsequent T cell inactivation. Recently, studies in HCC have found that myeloid cells (mainly the monocyte-derived macrophages) expressed PD-L1 play a critical role in regulating the hypoxic tumor microenvironment and immune escape of HCC.Citation45,Citation46 According to our results, we speculate that through this mechanism PSMCs may be involved in the regulation of the immune response in HCC. CTLA4 inhibition can lead to increased activation of naive CD4 and CD8 T cells by acting on T cell-antigen-presenting cell immune synapse. Anti-CTLA4 therapy decreases peripheral T cell clonality and increases the abundance of CD4 and CD8 T cells in patients with HCC.Citation47 Therefore, the development of novel drugs to target PSMCs holds promise for immunotherapy against HCC.
In summary, this study provides a general overview of the roles of PSMC gene expression in HCC prognosis by bridging information across multi-omics data. Moreover, this study benefits from a large number of included datasets to demonstrate the predictive and therapeutic potentials of PSMCs in HCC. However, there are also some deficiencies in this study. Our analysis was bridled by the retrospective nature of the data analysis and the understanding of the roles of PSMCs in the HCC development was limited due to lack of suitable in vivo and vitro experimental validation. To further validate our proposed conclusions, we have cultivated HCC cell lines, which are ready for further wet laboratory experiments.
Ethics Approval
The study was approved by the ethics committee of the Suining Central Hospital.
Disclosure
All authors report no conflicts of interest in this work.
Additional information
Funding
References
- Sung H, Ferlay J, Siegel RL, et al. Global Cancer Statistics 2020: GLOBOCAN estimates of incidence and mortality worldwide for 36 cancers in 185 Countries. CA Cancer J Clin. 2021;71(3):209–249. doi:10.3322/caac.21660
- Toh MR, Wong EYT, Wong SH, et al. Global epidemiology and genetics of hepatocellular carcinoma. Gastroenterology. 2023;164(5):766–782. doi:10.1053/j.gastro.2023.01.033
- Xu Q, Li Y, Gao X, et al. HNF4α regulates sulfur amino acid metabolism and confers sensitivity to methionine restriction in liver cancer. Nat Commun. 2020;11(1):3978. doi:10.1038/s41467-020-17818-w
- Zhen SH, Cheng M, Tao YB, et al. Deep learning for accurate diagnosis of liver tumor based on magnetic resonance imaging and clinical data. Front Oncol. 2020;10:680. doi:10.3389/fonc.2020.00680
- Xia Y, Tang G, Chen Y, et al. Tumor-targeted delivery of siRNA to silence Sox2 gene expression enhances therapeutic response in hepatocellular carcinoma. Bioact Mater. 2020;6(5):1330–1340. doi:10.1016/j.bioactmat.2020.10.019
- Davis C, Spaller BL, Matouschek A. Mechanisms of substrate recognition by the 26S proteasome. Curr Opin Struct Biol. 2021;67:161–169. doi:10.1016/j.sbi.2020.10.010
- Sahu I, Glickman MH. Proteasome in action: substrate degradation by the 26S proteasome. Biochem Soc Trans. 2021;49(2):629–644. doi:10.1042/BST20200382
- Liu T, Zhang J, Chen H, et al. PSMC2 promotes the progression of gastric cancer via induction of RPS15A/mTOR pathway. Oncogenesis. 2022;11(1):12. doi:10.1038/s41389-022-00386-7
- Zhu D, Huang J, Liu N, Li W, Yan L. PSMC2/CCND1 axis promotes development of ovarian cancer through regulating cell growth, apoptosis and migration. Cell Death Dis. 2021;12(8):730. doi:10.1038/s41419-021-03981-5
- Qin J, Wang W, An F, Huang W, Ding J. PSMC2 is up-regulated in pancreatic cancer and promotes cancer cell proliferation and inhibits apoptosis. J Cancer. 2019;10(20):4939–4946. doi:10.7150/jca.27616
- Wang Y, Zhu M, Li J, et al. Overexpression of PSMC2 promotes the tumorigenesis and development of human breast cancer via regulating plasminogen activator urokinase (PLAU). Cell Death Dis. 2021;12(7):690. doi:10.1038/s41419-021-03960-w
- Chen Q, Fu L, Hu J, Guo G, Xie A. Silencing of PSMC2 inhibits development and metastasis of prostate cancer through regulating proliferation, apoptosis and migration. Cancer Cell Int. 2021;21(1):235. doi:10.1186/s12935-021-01934-8
- Zhang JY, Shi KZ, Liao XY, et al. The silence of PSMC6 inhibits cell growth and metastasis in lung adenocarcinoma. Biomed Res Int. 2021;2021:9922185. doi:10.1155/2021/9922185
- Liu Y, Chen H, Li X, et al. PSMC2 regulates cell cycle progression through the p21/cyclin D1 pathway and predicts a poor prognosis in human hepatocellular carcinoma. Front Oncol. 2021;11:607021. doi:10.3389/fonc.2021.607021
- Papatheodorou I, Fonseca NA, Keays M, et al. Expression Atlas: gene and protein expression across multiple studies and organisms. Nucleic Acids Res. 2018;46(D1):D246–D251. doi:10.1093/nar/gkx1158
- Pontén F, Jirström K, Uhlen M. The human protein atlas--a tool for pathology. J Pathol. 2008;216(4):387–393. doi:10.1002/path.2440
- Lánczky A, Győrffy B. Web-based survival analysis tool tailored for medical research (KMplot): development and implementation. J Med Internet Res. 2021;23(7):e27633. doi:10.2196/27633
- Cerami E, Gao J, Dogrusoz U, et al. The cBio cancer genomics portal: an open platform for exploring multidimensional cancer genomics data. Cancer Discov. 2012;2(5):401–404. doi:10.1158/2159-8290.CD-12-0095
- Modhukur V, Iljasenko T, Metsalu T, et al. MethSurv: a web tool to perform multivariable survival analysis using DNA methylation data. Epigenomics. 2018;10(3):277–288. doi:10.2217/epi-2017-0118
- Heberle H, Meirelles GV, da Silva FR, Telles GP, Minghim R. InteractiVenn: a web-based tool for the analysis of sets through Venn diagrams. BMC Bioinf. 2015;16(1):169. doi:10.1186/s12859-015-0611-3
- Sherman BT, Hao M, Qiu J, et al. DAVID: a web server for functional enrichment analysis and functional annotation of gene lists (2021 update). Nucleic Acids Res. 2022;50(W1):W216–W221. doi:10.1093/nar/gkac194
- Donne R, Lujambio A. The liver cancer immune microenvironment: therapeutic implications for hepatocellular carcinoma. Hepatology. 2023;77(5):1773–1796. doi:10.1002/hep.32740
- Jia H, Tang WJ, Sun L, Wan C, Zhou Y, Shen WZ. Pan-cancer analysis identifies proteasome 26S subunit, ATPase (PSMC) family genes, and related signatures associated with prognosis, immune profile, and therapeutic response in lung adenocarcinoma. Front Genet. 2023;13:1017866. doi:10.3389/fgene.2022.1017866
- Normann KR, Øystese KAB, Berg JP, et al. Selection and validation of reliable reference genes for RT-qPCR analysis in a large cohort of pituitary adenomas. Mol Cell Endocrinol. 2016;437:183–189. doi:10.1016/j.mce.2016.08.030
- Kao TJ, Wu CC, Phan NN, et al. Prognoses and genomic analyses of proteasome 26S subunit, ATPase (PSMC) family genes in clinical breast cancer. Aging. 2021;13(14):17970. doi:10.18632/aging.203345
- Fan Y, Zhang J, Shi J, et al. Genetic cross-talk between oral squamous cell carcinoma and type 2 diabetes: the potential role of immunity. Dis Markers. 2022;2022:6389906. doi:10.1155/2022/6389906
- Liu B, Hu Y, Wan L, et al. Proteomics analysis of cancer tissues identifies IGF2R as a potential therapeutic target in laryngeal carcinoma. Front Endocrinol. 2022;13:1031210. doi:10.3389/fendo.2022.1031210
- Hellwinkel OJ, Asong LE, Rogmann JP, et al. Transcription alterations of members of the ubiquitin-proteasome network in prostate carcinoma. Prostate Cancer Prostatic Dis. 2011;14(1):38–45. doi:10.1038/pcan.2010.48
- Wang Y, Xu J, Fang Y, et al. Comprehensive analysis of a novel signature incorporating lipid metabolism and immune-related genes for assessing prognosis and immune landscape in lung adenocarcinoma. Front Immunol. 2022;13:950001. doi:10.3389/fimmu.2022.950001
- He Z, Yang X, Huang L, et al. PSMC5 promotes proliferation and metastasis of colorectal cancer by activating epithelial-mesenchymal transition signaling and modulating immune infiltrating cells. Front Cell Dev Biol. 2021;9:657917. doi:10.3389/fcell.2021.657917
- Mendizabal I, Zeng J, Keller TE, Yi SV. Body-hypomethylated human genes harbor extensive intragenic transcriptional activity and are prone to cancer-associated dysregulation. Nucleic Acids Res. 2017;45(8):4390–4400. doi:10.1093/nar/gkx020
- Pollen AA, Bhaduri A, Andrews MG, et al. Establishing cerebral organoids as models of human-specific brain evolution. Cell. 2019;176(4):743–756.e17. doi:10.1016/j.cell.2019.01.017
- Zucman-Rossi J, Villanueva A, Nault JC, Llovet JM. Genetic landscape and biomarkers of hepatocellular carcinoma. Gastroenterology. 2015;149(5):1226–1239.e4. doi:10.1053/j.gastro.2015.05.061
- Ullah MA, Islam NN, Moin AT, Park SH, Kim B. Evaluating the prognostic and therapeutic potentials of the Proteasome 26S Subunit, ATPase (PSMC) family of genes in lung adenocarcinoma: a database mining approach. Front Genet. 2022;13:935286. doi:10.3389/fgene.2022.935286
- Méndez-Matías G, Velázquez-Velázquez C, Castro-Oropeza R, et al. Prevalence of HPV in Mexican patients with head and neck squamous carcinoma and identification of potential prognostic biomarkers. Cancer. 2021;13(22):5602. doi:10.3390/cancers13225602
- Zheng JF, He S, Zeng Z, Gu X, Cai L, Qi G. PMPCB silencing sensitizes HCC tumor cells to sorafenib therapy. Mol Ther. 2019;27(10):1784–1795. doi:10.1016/j.ymthe.2019.06.014
- Huang W, Mei J, Liu YJ, et al. An Analysis Regarding the Association Between Proteasome (PSM) and Hepatocellular Carcinoma (HCC). J Hepatocell Carcinoma. 2023;10:497–515. doi:10.2147/JHC.S404396
- Zhang X, Han S, Zhou H, et al. TIMM50 promotes tumor progression via ERK signaling and predicts poor prognosis of non-small cell lung cancer patients. Mol Carcinog. 2019;58(5):767–776. doi:10.1002/mc.22969
- Gao SP, Sun HF, Jiang HL, et al. Loss of TIM50 suppresses proliferation and induces apoptosis in breast cancer. Tumour Biol. 2016;37(1):1279–1287. doi:10.1007/s13277-015-3878-0
- Jiang W, Wang L, Zhang Y, Li H. Circ-ATP5H induces hepatitis B virus replication and expression by regulating miR-138-5p/TNFAIP3 axis. Cancer Manag Res. 2020;12:11031–11040. doi:10.2147/CMAR.S272983
- Chiao CC, Liu YH, Phan NN, et al. Prognostic and Genomic Analysis of Proteasome 20S Subunit Alpha (PSMA) family members in breast cancer. Diagnostics. 2021;11(12):2220. doi:10.3390/diagnostics11122220
- Bi J, Liang W, Wang Y, Tian W, Cao S, Liu P. Long noncoding RNA PSMA3 Antisense RNA 1 promotes cell proliferation, migration, and invasion in pancreatic ductal adenocarcinoma via targeting MicroRNA-154-5p to positively modulate karyopherin subunit alpha 4. Pancreas. 2022;51(8):1037–1046. doi:10.1097/MPA.0000000000002136
- Devalaraja S, Folkert IW. Tumor-derived retinoic acid regulates intratumoral monocyte differentiation to promote immune suppression. Cell. 2020;180(6):1098–1114.e16. doi:10.1016/j.cell.2020.02.042
- Huo G, Liu W, Zhang S, Chen P. Efficacy of PD-1/PD-L1 plus CTLA-4 inhibitors in solid tumors based on clinical characteristics: a meta-analysis. Immunotherapy. 2023;15(3):189–207. doi:10.2217/imt-2022-0140
- Lu LG, Zhou ZL, Wang XY, et al. PD-L1 blockade liberates intrinsic antitumourigenic properties of glycolytic macrophages in hepatocellular carcinoma. Gut. 2022;71(12):2551–2560. doi:10.1136/gutjnl-2021-326350
- Fu Y, Mackowiak B, Feng D, et al. MicroRNA-223 attenuates hepatocarcinogenesis by blocking hypoxia-driven angiogenesis and immunosuppression. Gut. 2023;72(10):1942–1958. doi:10.1136/gutjnl-2022-327924
- Llovet JM, Castet F, Heikenwalder M, et al. Immunotherapies for hepatocellular carcinoma. Nat Rev Clin Oncol. 2022;19(3):151–172. doi:10.1038/s41571-021-00573-2