
Abstract
Background
Chronic obstructive pulmonary disease (COPD) is currently the third most common cause of death in the world. Patients with COPD experience airflow obstruction, weight loss, skeletal muscle dysfunction, and comorbidities. Anthropometric indicators are risk factors for mortality in geriatric assessment.
Purpose
This study examined and compared the associations of anthropometric indicators, such as low body mass index (BMI), low mid-arm circumference (MAC), and low calf circumference (CC), with the prediction of a 3-year follow-up mortality risk in patients with COPD.
Methods
We recruited nonhospitalized patients with COPD without acute conditions from a general hospital in Taiwan. The BMI, MAC, and CC of all patients were measured, and they were followed for 3 years through telephone interviews and chart reviews. The Kaplan–Meier survival curves stratified by BMI, MAC, and CC were analyzed. Variables univariately associated with survival were entered into a multivariate Cox regression model. The Bayesian information criterion was used to compare the predictive ability of the three anthropometric indicators to predict mortality rate.
Results
In total, 104 patients were included (mean ± standard deviation age, 74.2±6.9 years; forced expiratory volume in 1 second [%], 58.4±20.4 predicted; males, 94.2%); 22 patients (21.2%) died during the 36-month follow-up. During this long-term follow-up, the three anthropometric indicators could predict mortality risk in patients with COPD (low BMI [<21 kg/m2], hazard ratio [HR] =2.78, 95% confidence interval [CI] =1.10–7.10; low MAC [<23.5 cm], HR =3.09, 95% CI =1.30–7.38; low CC [<30 cm], HR =4.40, 95% CI =1.82–10.63). CC showed the strongest potential in predicting the mortality risk, followed by MAC and BMI.
Conclusion
Among the three anthropometric variables examined, CC can be considered a strong predictor of mortality risk in patients with COPD.
Introduction
Chronic obstructive pulmonary disease (COPD) is currently the third most common cause of death in the world.Citation1 COPD is a global health concern and a slowly progressive inflammatory disease caused by airflow obstructions.Citation2 COPD is not fully reversible and can lead to progressively worsening breathlessness, which affects daily activities and the health-related quality of life.Citation3 Many patients with COPD experience multiple conditions (eg, weight loss and skeletal muscle dysfunction)Citation4 and comorbidities (eg, cardiovascular disease, osteoporosis, and depression), which are known to influence the mortality and morbidity rates, hospitalization, and health-related quality of life.Citation5
Anthropometric indicators are essential for evaluating malnutrition,Citation6 functional decline, and chronic health conditions, which are risk factors for mortality in geriatric assessment.Citation7 Body mass index (BMI), mid-arm circumference (MAC), and calf circumference (CC) are accurate indicators of weight change, terminal functional decline, and functional status, respectively.Citation8,Citation9 The association between an increased mortality risk and low BMI in old age is well established.Citation10,Citation11 The association between BMI and mortality risk in patients with COPD has been a subject of research interest for decades.Citation12 In patients with COPD, independent of other prognostic variables, a mid-thigh muscle cross-sectional area of ≤70 cm2 increases the mortality risk fourfold.Citation13 In patients with stable COPD, the prognostic influence of the mid-arm muscle area estimated using anthropometric parameters is a more accurate predictor of mortality risk than BMI.Citation14 CC can be used to assess muscle mass,Citation15 because low muscle mass is more strongly related to mortality risk in adults than is low fat mass.Citation16
Apart from BMI, scant data is available on MAC and CC, all of which are comparable anthropometric predictors of mortality risk in patients with COPD. We therefore examined and compared the associations of anthropometric indicators, namely low BMI, MAC, and CC, with the prediction of mortality risk in patients with COPD in a 3-year follow-up period.
Materials and methods
Study design and patients
We conducted a cohort study in patients with COPD who were recruited from the pulmonary outpatient unit of a medical center in Northern Taiwan between January 2011 and December 2014. Patients diagnosed with susceptible COPD on the basis of the Global Initiative for Chronic Obstructive Lung Disease (GOLD) guidelines, were sampled.Citation17 Patients with forced expiratory volume in 1 second (FEV1)/forced vital capacity <0.70 confirmed by post-bronchodilator spirometry were eligible for inclusion. Patients with an acute infection or exacerbation were excluded. In total, 104 eligible patients (98 males and six females) agreed to participate. All the patients were ambulatory in stable conditions and were undergoing standard pharmacological treatment for COPD. The study protocol was approved by the Ethics Committee of the Chang-Gung Memorial Hospital, and all the patients provided written informed consent before participation.
Procedures and measurements
Each patient was interviewed face-to-face for recording demographic, lifestyle, and disease-related data. Their weight, height, fat-free mass index (FFMI), MAC, and CC were measured, following which they underwent the pulmonary functional test. We confirmed the patients with COPD and those with with other diseases, including cardiovascular disorder, skeletal muscle dysfunction, metabolic syndrome and diabetes, osteoporosis, anxiety and depression, lung cancer, and so on, according to medical charts. Current medication was recorded from the patients’ statement and mortality data were collected from the chart records at the medical center and confirmed through telephonic follow-up.
BMI was calculated as the weight in kilograms divided by the square of their height in meters (kg/m2). MAC and CC were measured to the nearest 0.1 cm using a flexible but nonstretch measuring tape.Citation18 MAC was measured with a millimeter tape at the midpoint of the nondominant arm, between the olecranon and acromion. CC was measured by wrapping the tape around the widest part of the calf with the patient in a sitting position, left knee raised at a right angle, and the calf uncovered by rolling up the trouser leg. We used the threshold values of the anthropometric cut-off points according to the Mini Nutritional Assessment Taiwan Version-II (BMI <21 kg/m2 for low BMI, MAC<23.5 cm for low MAC, CC <30 cm for low CC).Citation19
Body fat percentage was determined through a bioelectrical impedance analysis (BF-800 body fat monitor, Tanita, Tokyo, Japan),Citation6 and the FFMI was calculated by subtracting fat mass from the body weight.Citation10
A pulmonary function test was performed using Spirotrac V (Vitalograph Inc, Lenexa, KS, USA) after a 10-minute rest. The most satisfactory (ie, difference within 200 mL or <5%) of at least three reproducible FEV1 and forced vital capacity values were used in the analysis.
Statistical analysis
All data were statistically analyzed using SPSS statistics for Windows, version 19.0 (SPSS Inc. Chicago, IL, USA) and Prism5 (GraphPad Software, La Jolla, CA, USA). Descriptive data were expressed as mean ± standard deviation or percentage. Kaplan–Meier survival curves were stratified by BMI, MAC, and CC for analyses. After adjustment for age, smoking habit, and disease severity, Cox regression analyses were performed to evaluate the relative mortality risks among patients with low BMI, MAC, or CC. The Bayesian information criterion (BIC) was used to compare the extent of association between mortality rate and the anthropometric indicators considered in this study. A lower BIC value indicates a higher predictive ability or a stronger association of the indicator with the mortality risk.Citation20 Statistical significance was set at 0.05 in all analyses.
Results
lists the characteristics of the study patients. The average age was 74.2±6.9 years, and only 5.8% were female patients. Patients’ smoking statuses were as follows: 11.5% nonsmokers, 71.2% ex-smokers, and 17.3% smokers. Over one-half of the patients had mild or moderate COPD, approximately one-third (31.7%) exhibited severe COPD, and only 6.7% exhibited very severe COPD; the mean (%) FEV1 was 58.4±20.3; over half (55.8%) of patients had one or two comorbidities. In medication treatment, most of the patients had bronchodilator (83.7%) or steroid (81.7%) use. The mean ± standard deviation anthropometric values were as follows: 23.4±3.7 kg/m2, BMI; 26.3±3.2 cm, MAC; 32.9±3.1 cm, CC; and 17.6±2.2 kg/m2 FFMI.
Table 1 Characteristics of patients with COPD (n=104)
shows the characteristics of patients with COPD stratified by survival; during the 3-year follow-up period, 22 of the 104 patients died. The mean age of the surviving and dead patients was similar (73.8±7.1 vs 75.4±5.9 years, P>0.05). Most surviving and dead patients had a history of smoking. Both FEV1 (%) and GOLD stages differed significantly between the surviving and dead patients (61.4±19.5 vs 47.4±19.6, P<0.01). The three indicators (BMI, MAC, and CC) differed significantly between the surviving and dead patients (23.9±3.5 vs 21.6±3.8; 26.8±2.9 vs 24.2±3.7; 33.4±2.9 vs 30.9±3.8, respectively, all P<0.01). Some factors had no significant differences between the surviving and dead patients, including FFMI that did not differ significantly between the surviving and dead patients (17.8±1.9 vs 16.9±3.2, P>0.05), comorbidities coexistence, bronchodilator, and steroid use (all P>0.05).
Table 2 Characteristics of patients with COPD stratified by survival (n=104)
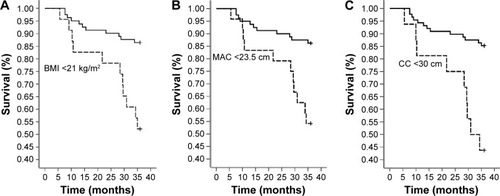
shows the 3-year follow-up Kaplan–Meier survival curves stratified by BMI, MAC, and CC. The survival rates of the patients with low BMI (<21 kg/m2), low MAC (<23.5 cm), or low CC (<30 cm) revealed a significantly high mortality during the 3-year follow-up period.
Figure 1 Three-year follow-up survival curves stratified by BMI, MAC, and CC.
Abbreviations: BMI, body mass index; CC, calf circumference; MAC, mid-arm circumference.
shows the hazard ratios and 95% confidence intervals based on the multivariate Cox regression analysis and the BIC value for the predictors of the mortality in patients with COPD. All the models were adjusted for age, smoking status, and disease severity (FEV1, % predicted). FEV1 was a significant factor on mortality risk in models I, II, and III respectively. A low BMI (<21 kg/m2) was significantly associated with a higher risk of mortality (Hazard ratio [HR]=2.8, P<0.05). In model II, a low MAC (<23.5 cm) was positively associated with a 3.0-fold increase in the mortality risk (P<0.05), whereas in model III, a low CC (<30 cm) was positively associated with an approximately 4.5-fold increase in mortality (P<0.01). Moreover, age or smoking status was not significantly associated with mortality in these three models. The differences in the BIC values between models III and I, III and II, and II and I were 4.9, 3.33, and 1.58, respectively.
Table 3 Predictors of mortality in patients with COPD based on multivariate Cox regression and the BIC
Discussion
In this study, we evaluated the predictive association between the anthropometric indicators and mortality risk in patients with COPD. The results suggest that the three anthropometric variables considered in this study can predict the long-term follow-up mortality in patients with COPD. When stratified by the cut-off points, low CC and low MAC were more effective predictors than was low BMI, showing significantly higher mortality risk during the 3-year follow-up period compared with that associated with normal CC, MAC, and BMI.
Many factors, such as aging, physical activity, nutrition, and chronic health disease, influence anthropometric indicators.Citation21 Tsai et alCitation19 demonstrated that low CC (<30 cm in males and <27 cm in females) and low MAC (<23.5 cm in males and <22 cm in females) were more effective than was low BMI (<21 kg/m2) in predicting the follow-up mortality risk in patients aged 65–74 years. However, low CC and low BMI were more effective than low MAC was in patients >75 years, and low BMI was more effective than low MAC or low CC was in Taiwanese patients aged 53–64 years. Advanced aging is often accompanied by unplanned weight loss and body protein loss.Citation22 In the current study, MAC and CC were more accurate predictors of health status and mortality risk in the institutionalized older Taiwanese people than was BMI.Citation8 The average age of the patients in our study was 74.2 years, and our results are consistent with those of Tsai et al,Citation19 where low CC and low MAC were more effective predictors of 3-year follow-up mortality risk than was low BMI after adjustment for age, smoking status, and disease severity.
The association between increased mortality and low BMI in old age is well established.Citation10,Citation11 No consensus exists on the causality of this association among patients with COPD.Citation23 Apart from BMI, low MACCitation14 and low CCCitation24 have been recommended as alternative and more accurate predictors of mortality in older participantsCitation25 and patients with COPD.Citation14 The accuracy of BMI measurement can be low in the older population for such reasons as spinal deformities, difficulties when standing, and fluid retention.Citation25 BMI and the cause-specific mortality risk were adjusted for age, sex, and smoking status.Citation23 The degree of functional impairment between the upper and lower limbs differs among patients with COPD. Lower limb muscles appear to be associated with muscle endurance and daily functional performance, whereas upper limb muscles have been correlated with both physical and pulmonary functional indicators.Citation26 Raftery (1995) suggested that a lower BIC value of 2–6 is a positive evidence for a model.Citation20 Because the differences in BIC values between the model with CC and the model with BMI were 4.9, the results of the present study indicated that CC had a stronger association with mortality rate in patients with COPD.
FEV1 is an important factor associated with mortality in our study. Esteban et al also found that FEV1 was the main predictor of mortality among patients with stable COPD.Citation27 We also found that patients rated as GOLD stage I–II (69.5%) have higher survival rate than GOLD stage III–IV (30.5%). Mattila et al demonstrated a strong association between the severity of the GOLD stage and mortality risk in a follow-up study.Citation2 FEV1 is the most crucial physiologic indicator of the severity of airflow obstruction in COPD.Citation28 Although, no single physiological survey has captured multiple factors that elevate the mortality in patients with COPD, a low FEV1 has a long-existing association with increased mortality.Citation29
The results of the present study indicated that among the investigated indicators, CC has the highest accuracy for predicting mortality in patients with COPD. Measurement of CC is easy, inexpensive, and noninvasive.
Limitation of the study
This study has a few limitations. First, the study sample was small and drawn from one hospital, which may have led to some bias during sample selection and therefore might not represent the entire spectrum of patients with COPD; this prevented us from conducting a subgroup analysis. Second, our results were based on data analyses obtained mainly from male patients, and the applicability of the study results to female patients requires additional investigations. Third, the influence of some COPD symptoms, such as dyspnea symptoms, exercising tolerance was not considered. Because patients with an acute infection or exacerbation were excluded, the data of acute exacerbation were not analyzed in the present study. In the future, we may use cluster analysis to predict mortality risks in patients with COPD.
Conclusion
Three anthropometric indicators, namely BMI, MAC, and CC, can predict long-term follow-up mortality risk in patients with COPD, among which CC is the most accurate, followed by MAC and BMI.
Acknowledgments
The authors thank the patients and personnel of the hospital unit for their cooperation. The study was supported by a grant from the Chang Gung Memorial Hospital (CMRPG391921), Ministry of Science and Technology (MOST 103-2314-B-038-066), Taipei Medical University–Shuang Ho Hospital (103TMU-SHH-01-4 & 104TMU-SHH-24), and the Taipei Medical University (TMU102-AE1-B45 & TMU103-AE1-B31). All authors have read and approved the final version of the manuscript.
Disclosure
The authors report no conflicts of interest in this work.
References
- LozanoRNaghaviMForemanKGlobal and regional mortality from 235 causes of death for 20 age groups in 1990 and 2010: a systematic analysis for the Global Burden of Disease Study 2010Lancet201238098592095212823245604
- MattilaTVasankariTKanervistoMAssociation between all-cause and cause-specific mortality and the GOLD stages 1–4: A 30-year follow-up among Finnish adultsRespir Med201510981012101826108990
- CrinerGJBourbeauJDiekemperRLExecutive summary: prevention of acute exacerbation of COPD: American College of Chest Physicians and Canadian Thoracic Society GuidelineChest2015147488389325320966
- CazzolaMBettoncelliGSessaECricelliCBiscioneGPrevalence of comorbidities in patients with chronic obstructive pulmonary diseaseRespiration201080211211920134148
- AlmagroPCabreraFJDiezJComorbidities and short-term prognosis in patients hospitalized for acute exacerbation of COPD: the EPOC en Servicios de medicina interna (ESMI) studyChest201214251126113323303399
- HsuMFHoSCKuoHPWangJYTsaiACMini-nutritional assessment (MNA) is useful for assessing the nutritional status of patients with chronic obstructive pulmonary disease: a cross-sectional studyCOPD201411332533224475999
- SeidellJCVisscherTLBody weight and weight change and their health implications for the elderlyEur J Clin Nutr200054Suppl 3S33S3911041073
- TsaiACLaiMCChangTLMid-arm and calf circumferences (MAC and CC) are better than body mass index (BMI) in predicting health status and mortality risk in institutionalized elderly TaiwaneseArch Gerontol Geriatr201254344344721663980
- HoSCHsuMFKuoHPThe relationship between anthropometric indicators and walking distance in patients with chronic obstructive pulmonary diseaseInt J Chron Obstruct Pulmon Dis2015101857186226392760
- CorradaMMKawasCHMozaffarFPaganini-HillAAssociation of body mass index and weight change with all-cause mortality in the elderlyAm J Epidemiol20061631093894916641311
- ThinggaardMJacobsenRJeuneBMartinussenTChristensenKIs the relationship between BMI and mortality increasingly U-shaped with advancing age? A 10-year follow-up of persons aged 70–95 yearsJ Gerontol A Biol Sci Med Sci201065552653120089666
- CaoCWangRWangJBunjhooHXuYXiongWBody mass index and mortality in chronic obstructive pulmonary disease: a meta-analysisPLoS One201278e4389222937118
- MarquisKDebigareRLacasseYMidthigh muscle cross-sectional area is a better predictor of mortality than body mass index in patients with chronic obstructive pulmonary diseaseAm J Respir Crit Care Med2002166680981312231489
- Soler-CatalunaJJSanchez-SanchezLMartinez-GarciaMASanchezPRSalcedoENavarroMMid-arm muscle area is a better predictor of mortality than body mass index in COPDChest200512842108211516236862
- ChumleaWCGuoSSVellasBGuigozYTechniques of assessing muscle mass and function (sarcopenia) for epidemiological studies of the elderlyJ Gerontol A Biol Sci Med Sci19955045517493217
- BigaardJFrederiksenKTjonnelandABody fat and fat-free mass and all-cause mortalityObesity Res200412710421049
- RabeKFHurdSAnzuetoAGlobal strategy for the diagnosis, management, and prevention of chronic obstructive pulmonary disease: GOLD executive summaryAm J Respir Crit Care Med2007176653255517507545
- LeeRDNiemanDCAssessment of the hospitalized patientLeeRDNiemanDCNutritional Assessment3rdNew YorkMcGraw Hill2003
- TsaiACChangTLThe effectiveness of BMI, calf circumference and mid-arm circumference in predicting subsequent mortality risk in elderly TaiwaneseBr J Nutr2011105227528121129232
- RafteryAEBayesian model selection in social researchSociol Methodol199525111163
- TsaiHJTsaiACNriaguJGhoshDGongMSandrettoAAssociations of BMI, TV-watching time, and physical activity on respiratory symptoms and asthma in 5th grade schoolchildren in Taipei, TaiwanJ Asthma200744539740117613637
- RoubenoffRSarcopenia and its implications for the elderlyEur J Clin Nutr200054Suppl 3S40S4711041074
- WhitlockGLewingtonSSherlikerPProspective Studies CollaborationBody-mass index and cause-specific mortality in 900,000 adults: collaborative analyses of 57 prospective studiesLancet200937396691083109619299006
- BonnefoyMJauffretMKostkaTJusotJFUsefulness of calf circumference measurement in assessing the nutritional state of hospitalized elderly peopleGerontology200248316216911961370
- WijnhovenHAvan Bokhorst-de van der SchuerenMAHeymansMWLow mid-upper arm circumference, calf circumference, and body mass index and mortality in older personsJ Gerontol A Biol Sci Med Sci201065101107111420547497
- MirandaEFMalagutiCCorsoSDPeripheral muscle dysfunction in COPD: lower limbs versus upper limbsJ Bras Pneumol201137338038821755195
- EstebanCQuintanaJMAburtoMPredictors of mortality in patients with stable COPDJ Gen Intern Med200823111829183418795373
- CelliBRPredictors of mortality in COPDRespir Med2010104677377920417082
- AnthonisenNRWrightECHodgkinJEPrognosis in chronic obstructive pulmonary diseaseAm Rev Respir Dis1986133114203510578