
Abstract
Objective
To evaluate differentially expressed long noncoding RNAs (lncRNAs) and the potential role of lncRNA TUG1 in patients with chronic obstructive pulmonary disease (COPD).
Methods
Total RNA was extracted from both COPD and non-COPD lung tissues, and microarray analysis was performed with 25,628 lncRNA probes and 20,106 mRNA probes. In addition, five up-regulated and five down-regulated lncRNAs were selected for identification using quantitative real-time polymerase chain reaction. COPD cell model was established by transforming growth factor β (TGF-β) treatment. Cell Counting Kit-8 assay was used to detect BEAS-2B and HFL1 cell proliferation after TUG-siRNA transfection with TGF-β treatment. In addition, the expression levels of α-SMA and fibronectin proteins were determined using Western blot in BEAS-2B and HFL1 cells after TUG-siRNA transfection with TGF-β treatment.
Results
There were 8,376 (32.7%) differentially expressed lncRNAs and 5,094 (25.3%) differentially expressed mRNAs in COPD lung tissues compared with non-COPD lung tissues. Five of the analyzed lncRNAs (BC038205, BC130595, TUG1, MEG3, and LOC646329) were markedly increased, while five lncRNAs (LOC729178, PLAC2, LOC339529, LINC00229, and SNHG5) were significantly decreased in COPD lung tissues compared with non-COPD lung tissues (n=20) (***P<0.001). Knockdown of lncRNA TUG1 promotes BEAS-2B and HFL1 cell proliferation after TGF-β treatment through inhibiting the expression levels of α-SMA and fibronectin.
Conclusion
Abundant, differentially expressed lncRNAs and mRNAs were identified by microarray analysis and these might play a partial or key role in the diagnosis of patients with COPD. LncRNA TUG1 may become a very important class of biomarker and may act as a potential diagnostic and therapeutic target for patients with COPD.
Introduction
Lung diseases mainly include chronic obstructive pulmonary disease (COPD), idiopathic pulmonary fibrosis (IPF), asthma, cystic fibrosis (CF), and non-small-cell lung cancer (NSCLC). COPD is an abnormal inflammatory reaction of lungs to harmful particles or gases (primarily cigarette smoke).Citation1 COPD has become a primary public health problem and is the fourth main reason of chronic morbidity and mortality in the US.Citation2 It has been the cause of more than 2,500,000 deaths every year worldwide, according to the 2002 report of the World Bank/World Health Organization.Citation3 There are several reasons for the development of COPD, including the inspiration of nocuous particles such as cigarette smoke, the destruction of the balance between proteolytic and antiproteolytic molecules,Citation4 and oxidative stress.Citation5 However, there are difficulties in selecting an appropriate therapeutic method for COPD, especially with regard to the lack of classical studies.Citation6 Therefore, it is also urgent to find specific and effective markers for the diagnosis of COPD. IPF presents as a common, chronic, and progressive lung disease with poor prognosis.Citation7 Asthma is characterized by periods of reversible airflow obstruction. CF presents as an autosomal recessive disease and is characterized by chronic endobronchial infection, progressive airway obstruction, and abnormal airway secretions.Citation8
Long noncoding RNAs (lncRNAs), a group of noncoding RNAs (ncRNAs) which are non-protein coding transcripts transcribed by RNA polymerase II,Citation9 have a length of more than 200 nucleotides.Citation10,Citation11 With regard to their biological functions, lncRNAs play a significant role in chromatin structure and function,Citation12 promoting numerous biological functions including gene transcription, regulating splicing and participating in epigenetics,Citation13,Citation14 genomic rearrangement,Citation15 etc. Studies indicated that lncRNAs were connected with various diseasesCitation9 and resulted in abnormal expression of abundant gene products which may, in turn, generate biological processes involving growth,Citation16 differentiation,Citation17 and carcinogenesis.Citation18 They have also been implicated in numerous human diseasesCitation19–Citation21 such as neurodegeneration diseases,Citation22 cardiovascular diseases,Citation23 and cancers.Citation24 Previously, differentially expressed lncRNAs and mRNAs between fibrotic lung and normal lung tissues were selected for microarray analysis. Among them, AJ005396 and S69206 were found to be increased in the fibrotic lung tissues.Citation25 MALAT-1 is highly expressed in NSCLC and is involved in poor prognosis.Citation26 One study has reported the aberrant expression of lncRNAs in the CF bronchial epithelium.Citation27 However, the lncRNAs involved in the development of COPD or asthma have not been studied.
Genomic screening techniques revealed that taurine treatment of mouse retinal cells resulted in the up-regulation of lncRNA TUG1 (7.1 kb in length).Citation28 LncRNA TUG1 is highly conservative, and its inactivation results in damage to the formation of photoreceptors in the developing rodent retina.Citation28 Recently, researchers have found that TUG1 was significantly decreased in NSCLC.Citation29 However, some studies showed that TUG1 was increased in gastric cancer, osteosarcoma, and bladder cancer,Citation30–Citation32 probably because lncRNAs showed predominantly tissue-specific expression,Citation33,Citation34 whereas the function and potential mechanism of TUG1 in patients with COPD are still unknown. Therefore, in our study, we explored the possible function and mechanism of TUG1 in patients with COPD.
In our study, we detected differentially expressed lncRNAs and mRNAs in COPD and non-COPD lung tissues using human microarray analysis. We conducted Kyoto Encyclopedia of Genes and Genomes (KEGG) pathway analysis and gene ontology (GO) enrichment analysis of the differentially expressed mRNAs. Then, we selected five up-regulated and five down-regulated lncRNAs, which were identified using quantitative real-time polymerase chain reaction (qRT-PCR), from 20 COPD and 20 non-COPD lung tissues. Furthermore, we selected lncRNA TUG1 and analyzed its effect on proliferation and expression levels of α-SMA and fibronectin proteins by knocking out lncRNA TUG1 through transforming growth factor β (TGF-β) treatment. The knocking out of lncRNA TUG1 inhibited the expression levels of α-SMA and fibronectin in BEAS-2B and HFL1 cells. Our results manifested that differentially expressed lncRNAs can act as potential molecular biomarkers for the diagnosis of COPD and that lncRNA TUG1, in particular, may play an important role as a diagnostic marker in the COPD patients.
Materials and methods
Patients and clinical specimens
The study was approved by the Institutional Review Board of Third Xiangya Hospital, Central South University. Lung tissues from human COPD and non-COPD patients were collected from the Third Xiangya Hospital in 2015. Written informed consent to participate in the study was acquired from all the patients. The tissue samples were immediately placed in the refrigerator at −80°C until further analysis.
Cell culture and transfection
BEAS-2B (human lung epithelial cells) and HFL1 (human lung fibroblasts) cells were obtained from American Type Culture Collection (ATCC, Manassas, VA, USA). BEAS-2B was cultured in LHC-8 medium without gentamicin (Thermo Fisher Scientific, Waltham, MA, USA) and HFL1 was cultured in F-12K medium (Thermo Fisher Scientific). Penicillin (100 U/mL), streptomycin (100 μg/mL), and 10% fetal bovine serum (FBS; Thermo Fisher Scientific) were added to all the culture media. Cell lines were cultured with 5% CO2 at 37°C. For cell treatments, we used 2 ng/mL TGF-β (R&D Systems, Inc., Minneapolis, MN, USA) for 48 h. Transient transfection was assayed using Lipofectamine 3000 (Thermo Fisher Scientific) according to the manufacturer’s protocol. NC (negative control) siRNA and TUG1-siRNA were synthesized. The siRNA sequences used to target TUG1 were 5′-GCU UGG CUU CUA UUC UGA AUC CUU U-3′ (sense) and 5′-AAA GGA UUC AGA AUA GAA GCC AAG C-3′ (antisense).Citation29 BEAS-2B and HFL1 cells were transfected with Lipofectamine 3000 (Thermo Fisher Scientific). Cells were cultured for 48 h after transfection and then were analyzed by cell viability assay and Western blot analysis.
Arraystar lncRNA array
Tissues were cryopulverized using the BioPulverizer™ (Biospec Products, Inc., Bartlesville, OK, USA) and homogenated using the Mini-Bead-Beater-16 (Biospec). The homogenized samples were separated. RNA was precipitated from the aqueous phase by mixing with isopropyl alcohol, and the precipitate was washed with 75% ethanol and redissolved with RNase-free water. Total RNA was extracted and RNA quality was determined. Labeling reaction was carried out using Quick Amp Labeling Kit, One-Color (Agilent p/n 5190-0442), then the labeled/amplified RNA was purified and labeled cRNA quality was determined. Hybridization was performed using Agilent Gene Expression Hybridization Kit (Agilent p/n 5188-5242) according to manufacturer’s instructions and the microarray was washed. Agilent microarray scanner (Agilent p/n G2565BA) was used and data were extracted using Agilent Feature Extraction software (version 11.0.1.1).
RNA preparation, reverse transcription, and qRT-PCR analysis
Total RNA was extracted from human lung cells and tissues by using TRIzol reagent according to the manufacturer’s instructions. RevertAid™ First Strand cDNA Synthesis Kit (no K1622; Thermo Fisher Scientific) was used to synthesize the cDNA with random primers and 1.0 μg RNA was included in each reverse transcription reaction. qPCR was performed with SYBR Premix Ex Taq (Takara Bio Inc., Kusatsu, Japan). The primers of objective genes and GAPDH (internal loading control) were designed and are shown in . The ABI 7500 Real-Time PCR System (Applied Biosystems, Warrington, UK) was used for PCR reactions. All the experiments were repeated at least three times and the results are displayed as the mean ± standard deviation.
Table 1 Sequence of the primers used for validation of selected lncRNAs
Cell viability assay
First, 50 μM NC siRNAs or TUG1 siRNAs (si-TUG1) were transfected into BEAS-2B and HFL1 cells for 48 h. Second, the cells were treated with TGF-β (2 ng/mL) for 48 h. BEAS-2B, BEAS-2B/TGF-β, BEAS-2B/TGF-β/NC-siRNA, and BEAS-2B/TGF-β/TUG1-siRNA cells were seeded in 96-well plates at 1×10⁴ cells per well at 37°C. At 24, 48, and 72 h, 10 μL of cholecystokinin octapeptide (CCK-8; Dojindo Laboratories, Kumamoto, Japan) was added to each well and incubated for 4 h. The absorbance was detected at a wavelength of 450 nm. The methods used for the treatment and detection of HFL1 cells were identical with those used for BEAS-2B cells.
Western blot analysis
The total proteins of BEAS-2B and HFL1 cells were extracted using a lysis buffer including 10% protease inhibitor. BCA Protein Assay kit (QCbio Science Technologies Co., Ltd., Shanghai, People’s Republic of China) was used to detect the concentrations of total protein. Approximately, 30 μg of heat-denatured proteins were added to sodium dodecyl sulfate-polyacrylamide gel. After electrophoresis, the proteins were transferred to polyvinylidene difluoride (PVDF) membranes (EMD Millipore, Billerica, MA, USA), blocked with 5% skim milk (Becton, Dickinson and Company, Franklin Lakes, NJ, USA), and incubated with primary antibody overnight at 4°C. Next day, the PVDF membranes with proteins were incubated with the secondary antibody for 2 h. Special antibodies were detected by using enhanced chemiluminescence (ECL) reagents (Amersham Biosciences, Inc., Little Chalfont, UK). The ImageJ software program was used to analyze the expression levels of special proteins. The primary antibodies, anti-α-SMA and anti-fibronectin, were purchased from Abcam (Cambridge, UK).
Statistical analysis
Statistical Product and Service Solutions (SPSS) software 21 (SPSS Inc., Chicago, IL, USA) and GraphPad Prism 5.0 (GraphPad Software, La Jolla, CA USA) were used to analyze the data of all experiments by Student’s t-tests. P-values less than 0.05 were considered to be statistically significant.
Results
Expression of lncRNAs and mRNAs in COPD lung tissues
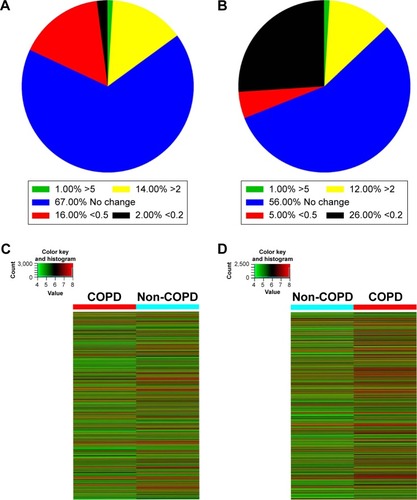
Six patient samples with or without COPD were randomly selected for this study. Histopathology was assessed by a pathologist and patient characteristics are shown in . LncRNA array (Kangcheng, Shanghai, People’s Republic of China) was employed to measure the differently expressed lncRNAs in COPD and non-COPD lung tissues. We detected the expression of 25,628 lncRNAs and 20,106 mRNAs using microarray analysis. According to fold-change (COPD vs non-COPD lung tissues) and P-value, as shown in , we screened out significantly differentially expressed lncRNAs (8,376 [32.7%]) and mRNAs (5,049 [25.1%]) in three COPD lung tissue samples and compared with non-COPD lung tissue samples (fold-change >2.0 or <0.5; P<0.05). Among the differentially expressed lncRNAs, 3,939 (15.4%) were identified to be up-regulated, whereas 4,437 (17.3%) were identified to be down-regulated in the COPD lung tissue groups. Furthermore, 396 (1.6%) lncRNAs were up-regulated, whereas 438 (1.7%) were down-regulated when the fold-change was >5 (). Among the differentially expressed mRNAs, 3,623 (18.0%) were up-regulated, whereas 1,471 (7.3%) were down-regulated in the COPD lung tissue groups. Also, 305 (1.5%) mRNAs were up-regulated, whereas 71 (0.4%) mRNAs were down-regulated when the fold-change was >5 (). Hierarchical clustering also displayed variations in the expression of lncRNAs () and mRNAs () between COPD and non-COPD lung tissues.
Table 2 Clinical characteristics of the subjects involved in the studies
Table 3 Analysis of differentially expressed lncRNAs and mRNAs between COPD and non-COPD lung tissues
Figure 1 The expression of lncRNAs and mRNAs in COPD lung tissues. (A) The percentage of differentially expressed lncRNAs in COPD lung tissues compared with non-COPD lung tissues. (B) The percentage of differentially expressed mRNAs in COPD lung tissues relative to non-COPD lung tissues. (C) The hierarchical clustering of differentially expressed lncRNAs, which are displayed on a scale from green (low) to red (high), between COPD and non-COPD lung tissues. (D) Heat map of distinguishable mRNA expression amid lung tissues samples; red shows relatively high expression and green shows relatively low expression.
Analysis of genomic locus among differentially expressed lncRNAs
According to the relationship of lncRNA with its nearby coding gene and the coordinate of the coding gene, as shown in , among the up-regulated lncRNAs, 785 (19.9%) were exon sense-overlapping lncRNAs (the lncRNA’s exon overlaps a coding transcript exon on the same genomic strand), 215 (5.5%) intron sense-overlapping lncRNAs (the lncRNA overlaps the intron of a coding transcript on the same genomic strand), 972 (24.7%) natural antisense lncRNAs (the lncRNA is transcribed from the antisense strand and overlaps with a coding transcript), 195 (5.0%) bidirectional lncRNAs (the lncRNA is oriented head to head to a coding transcript within 1,000 bp), 1,701 (43.2%) intergenic lncRNAs (there are no overlapping or bidirectional coding transcripts nearby the lncRNA), and 71 (1.8%) nonoverlapping antisense lncRNAs (the lncRNA is transcribed from the antisense strand without sharing overlapping exons). Among the down-regulated lncRNAs, 274 (6.2%) were exon sense-overlapping lncRNAs, 160 (3.6%) intron sense-overlapping lncRNAs, 1,267 (28.6%) natural antisense lncRNAs, 176 (4.0%) bidirectional lncRNAs, 1,548 (34.9%) intergenic lncRNAs, 974 (22.0%) intronic antisense lncRNAs, and 38 (0.9%) nonoverlapping antisense lncRNAs.
Table 4 The proportion of differentially expressed lncRNAs in COPD lung tissues based on genomic locus position
KEGG pathway analysis of the differentially expressed mRNAs
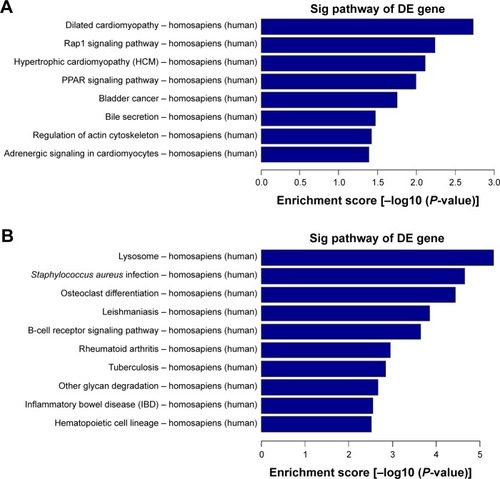
Pathway analysis is a functional analysis mapping genes to KEGG pathways.Citation35 KEGG pathway analysis demonstrated numerous enrichment-related pathways including 46 up-regulated and 8 down-regulated pathways. Among up-regulated pathways, the top 10 pathways in homosapiens (humans) are listed in , which include lysosome, Staphylococcus aureus infection, osteoclast differentiation, leishmaniasis, B-cell receptor signaling pathway, rheumatoid arthritis, tuberculosis, other glycan degradation, inflammatory bowel disease, and hematopoietic cell lineage. Simultaneously, the down-regulated pathways include dilated cardiomyopathy, rap1 signaling pathway, hypertrophic cardiomyopathy, PPAR signaling pathway, bladder cancer, bile secretion, regulation of actin cytoskeleton, and adrenergic signaling in cardiomyocytes ().
Figure 2 KEGG pathway analysis of the differentially expressed mRNAs. (A) Pathway analysis demonstrates the significant pathways of differentially down-regulated mRNAs in model vs normal group. The P-value (EASE-score, Fisher’s P-value, or hypergeometric P-value) denotes the significance of the pathway correlated to the conditions. The lower the P-value, more significant is the pathway (the recommended P-value cutoff is 0.05). (B) Differentially up-regulated mRNAs in model vs normal group.
Gene ontology enrichment analysis of the differentially expressed mRNAs
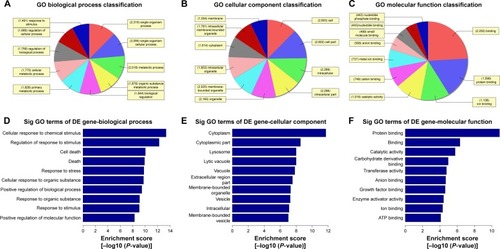
The Gene Ontology project provides a controlled vocabulary to describe gene and gene product attributes in any organism (http://www.geneontology.org). There are three domains in ontology: biological process, cellular component, and molecular function. Fisher’s exact test was used to find out if, by chance, there was more overlap between the differently expressed list and the GO annotation list than would be expected. The P-value denotes the significance of GO terms enrichment in the differently expressed genes. The lower the P-value, the more significant is the GO term (P-value ≤0.05 is recommended). According to the GO analysis results, there were 1,115 up-regulated and 346 down-regulated GO terms in the biological process (COPD vs non-COPD lung tissues). and show the GO classification for the biological process of down-regulated () and up-regulated mRNAs (). The bar plot shows the top 10 enrichment score values of the significant enrichment terms. Biological processes of down-regulated mRNAs () mainly include synaptic transmission, regulation of biological quality, growth, etc., while those of up-regulated mRNAs () mainly include cellular response to chemical stimulus, regulation of response to stimulus, cell death, etc. Similarly, there were 34 down-regulated () and 127 up-regulated GO terms () in the cellular component (COPD vs non-COPD lung tissues). There were 53 down-regulated () and 115 up-regulated GO terms () in molecular function (COPD vs non-COPD lung tissues).
Figure 3 Gene ontology (GO) enrichment analysis of the differentially down-expressed mRNAs. (A) GO biological process classification for biological process of down-regulated mRNAs. (B) GO biological process classification for cellular components of differentially down-expressed mRNAs. (C) GO biological process classification for molecular function of differentially down-expressed mRNAs. (D) GO analysis indicates the top 10 counts of enrichment score in the biological process of down-regulated mRNAs. (E) GO analysis indicates the top 10 counts of enrichment score in cellular components of down-regulated mRNAs. (F) GO analysis indicates the top 10 counts of enrichment score in molecular function of down-regulated mRNAs.
Abbreviation: Sig, significant.
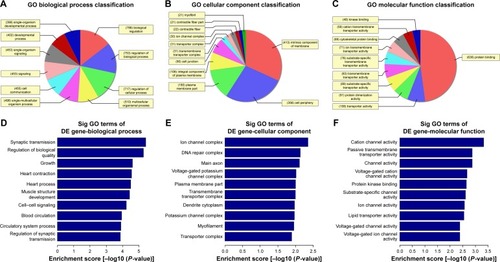
Figure 4 Gene ontology (GO) enrichment analysis of the differentially up-expressed mRNAs. (A) GO biological process classification for biological process of up-regulated mRNAs. (B) GO biological process classification for cellular components of differentially up-expressed mRNAs. (C) GO biological process classification for molecular function of differentially up-expressed mRNAs. (D) GO analysis indicates the top 10 counts of enrichment score in biological process of up-regulated mRNAs. (E) GO analysis indicates the top 10 counts of enrichment score in cellular components of up-regulated mRNAs. (F) GO analysis indicates the top 10 counts of enrichment score in molecular function of up-regulated mRNAs.
Identification of 10 differentially expressed lncRNAs
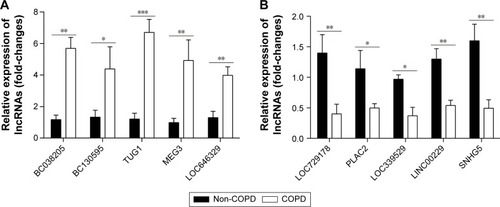
Based on the previously mentioned studies, we selected five up-regulated and five down-regulated lncRNAs. According to the qRT-PCR results, lncRNAs BC038205, BC130595, TUG1, MEG3, and LOC646329 were markedly increased in COPD lung tissues compared to non-COPD lung tissues (n=20) (***P<0.001; ). Simultaneously, lncRNAs LOC729178, PLAC2, LOC339529, LINC00229, and SNHG5 were significantly decreased in COPD lung tissues compared to non-COPD lung tissues (n=20) (***P<0.001; ). presents detailed information about significant differentially expressed lncRNAs in different diseases.
Table 5 Detailed information of significant differentially expressed lncRNAs in diseases
Figure 5 Ten differentially expressed lncRNAs are identified. (A) The relative expression levels of 10 differentially up-regulated lncRNAs in COPD lung tissues compared with non-COPD lung tissues (n=20) were measured by qRT-PCR. (B) The relative expression levels of 10 differentially down-regulated lncRNAs beween COPD and non-COPD lung tissues (n=20) were detected by qRT-PCR. GAPDH served as the control for RNA loading (*P<0.05; **P<0.01; ***P<0.001).
Silencing of TUG1 affects the proliferation ability in BEAS-2B and HFL1 cells after TGF-β pretreatment
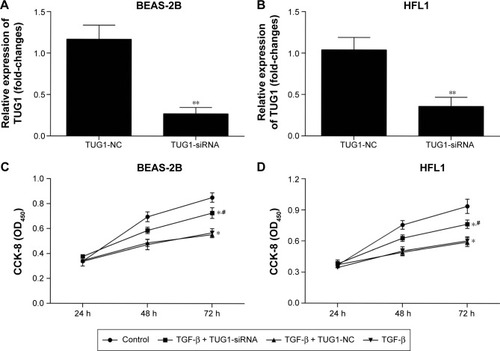
To determine whether silencing of TUG1 expression by siRNA affected the proliferation of human lung cells, the cells were cultured with 50 μM NC siRNAs or TUG1 siR-NAs (si-TUG1) for 48 h. Transfection effect was detected by qRT-PCR. The expression level of lncRNA TUG1 decreased in BEAS-2B () and HFL1 cells () with TUG1 siRNAs. Additionally, to testify whether TGF-β affected the proliferation of human lung cells, cells were treated with 2 ng/mL TGF-β for 48 h. Then growth rates were determined by Cell Counting Kit-8 (CCK-8) assay. The proliferation of BEAS-2B cells with TGF-β and si-TUG1 was markedly increased relative to BEAS-2B cells with TGF-β (P<0.05). The proliferation of BEAS-2B cells with TGF-β was markedly suppressed compared with BEAS-2B cells (*P<0.05) (). Similar results were observed in HFL1 cells ().
Figure 6 Silencing of TUG1 affects the proliferation ability of BEAS-2B and HFL1 cells after TGF-β pretreatment. (A) The relative expression levels of lncRNAs TUG1 in BEAS-2B cells were measured by qRT-PCR (**P<0.01). (B) The relative expression levels of lncRNAs TUG1 in HFL1 cells were measured by qRT-PCR (**P<0.01). (C) The capacity of proliferation was detected with CCK-8. About 50 μM of NC siRNAs or TUG1 siRNAs (si-TUG1) were transfected into BEAS-2B cells for 48 h. Silencing of TUG1 expression by siRNA promoted the capacity to proliferation in BEAS-2B cells. TGF-β (2 ng/mL) was treated for 48 h. TGF-β inhibited the capacity to proliferate. #P<0.05 as compared with BEAS-2B cells treated with 50 μM NC siRNAs and TGF-β (2 ng/mL); *P<0.05 as compared with BEAS-2B cells. (D) The capacity to proliferate was also detected using CCK-8 assay. Silencing of TUG1 expression by siRNA promoted the capacity of proliferation. TGF-β inhibited the capacity of proliferation in HFL1 cells. #P<0.05 as compared with HFL1 cells treated with 50 μM NC siRNAs and TGF-β (2 ng/mL); *P<0.05 as compared with HFL1 cells.
Silencing of TUG1 suppresses the expression levels of α-SMA and fibronectin proteins in BEAS-2B and HFL1 cells
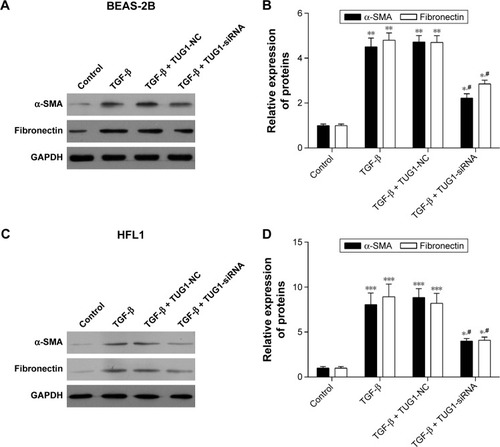
Finally, to explore the expression levels of α-SMA and fibronectin proteins, we cultured BEAS-2B and HFL1 cells. Some cells were treated with 50 μM NC siRNAs or TUG1 siRNAs (si-TUG1) and 2 ng/mL TGF-β for 48 h, while others were treated with 2 ng/mL TGF-β for 48 h. Western blot assay was performed to detect the expression of α-SMA and fibronectin proteins, which was increased in TGF-β BEAS-2B cells compared with BEAS-2B cells. When BEAS-2B cells were transfected with TUG1 siR-NAs and TGF-β for 48 h, the expression of α-SMA and fibronectin proteins was decreased relative to BEAS-2B cells with TGF-β and NC siRNAs. TGF-β promoted the expression of α-SMA and fibronectin proteins in BEAS-2B cells (). Similar results were obtained with HFL1 cells (). Relative quantities were defined as the ratio of the grayscale of α-SMA and fibronectin to that of GAPDH ().
Figure 7 Silencing of TUG1 suppresses the expression levels of α-SMA and fibronectin proteins in BEAS-2B and HFL1 cells. (A) Silencing of TUG1 expression by siRNA inhibited the expression levels of α-SMA and fibronectin proteins, while TGF-β promoted the expression levels of α-SMA and fibronectin proteins. About 50 μM negative control (NC) siRNAs or TUG1 siRNAs (si-TUG1) and 2 ng/mL TGF-β were transfected into BEAS-2B cells for 48 h. The expression levels of α-SMA and fibronectin proteins were detected by Western blot in BEAS-2B cells. (B) Gray statistical analysis of the expression levels of α-SMA and fibronectin proteins in BEAS-2B cells. #P<0.05 as compared with BEAS-2B cells treated with 50 μM NC siRNAs and TGF-β (2 ng/mL); *P<0.05 as compared with BEAS-2B cells. **P<0.01. (C) The expression levels of α-SMA and fibronectin proteins were detected by Western blot in HFL1 cells treated as mentioned earlier. GAPDH was used for internal control. (D) Gray statistical analysis of the expression levels of α-SMA and fibronectin proteins in HFL1 cells. #P<0.05 as compared with HFL1 cells treated with 50 μM NC siRNAs and TGF-β (2 ng/mL); *P<0.05 as compared with HFL1 cells. ***P<0.001.
Discussion
Currently, COPD is a primary cause of morbidity around the world and is associated with individualized development of chronic symptoms, airflow obstruction,Citation36,Citation37 and undermined health.Citation38 Even worse, it presents with acute episodes of symptom exacerbation.Citation39 Although studies related to clinical diagnoses, causes of development, and fundamental science have been conducted, the molecular mechanism underlying the development of COPD is still not fully known and effective treatment methods for COPD are urgently required. Therefore, in our study, the aim was to find potential and available biomarkers for the diagnosis and treatment of COPD.
LncRNAs are involved in various biological processes and participate in the process of RNA transcription, mRNA splicing, translation,Citation11,Citation40,Citation41 and in the pathogenesis of numerous diseases.Citation42–Citation44 However, lncRNAs that regulate the pathogenetic mechanism of COPD are unclear at present. Microarray analysis has been suggested as an available and useful tool to detect molecular mechanisms and find potential biomarkers. Therefore, we studied the differential expression of lncRNAs between COPD and non-COPD lung tissues. According to the results of our microarray analysis, we detected the differential expression of 25,628 lncRNAs and 20,106 mRNAs between COPD and non-COPD lung tissues. Among them, the expression of 8,376 (32.7%) lncRNAs and 5,049 (25.1%) mRNAs was significant (fold-change >2.0 or <0.5; P<0.05).
Based on the analysis of genomic locus and the correlation with protein-coding genes among differentially expressed lncRNAs, we found 3,249 (38.8%) intergenic lncRNAs, 2,239 (26.7%) natural antisense lncRNAs, 1,059 (12.6%) exon sense-overlapping lncRNAs, 974 (11.6%) intronic antisense lncRNAs, 375 (4.5%) intron sense-overlapping lncRNAs, 371 (4.4%) bidirectional lncRNAs, and 109 (1.3%) nonoverlapping antisense lncRNAs. Therefore, most lncRNAs are intergenic (no overlapping or bidirectional coding transcripts nearby the lncRNA), and TUG1 also belongs to the class of intergenic lncRNAs.
Moreover, microarray assay also includes the pathway analysis and GO enrichment analysis based on differentially expressed mRNAs. Previous studies have shown that COPD is related to lysosome,Citation45 Staphylococcus aureus infection,Citation46 osteoclast differentiation,Citation47 leishmaniasis,Citation48 dilated cardiomyopathy,Citation49 rap1 signaling pathway,Citation50 and PPAR signaling pathway,Citation51 which are concordant with our KEGG pathway results in patients with COPD. In addition, we found 1,115 up-regulated and 346 down-regulated GO terms in biological process, 127 up-regulated and 34 down-regulated GO terms in cellular component, and 115 up-regulated and 53 down-regulated GO terms in molecular function between COPD lung tissues and non-COPD lung tissues according to the GO analysis results. Data regarding other COPD-related pathways and genes correlated with biological process, cellular component, and molecular function can provide a lot of information for the study of COPD.
Furthermore, we selected up-regulated lncRNAs (BC038205, BC130595, TUG1, MEG3, and LOC646329) and down-regulated lncRNAs (LOC729178, PLAC2, LOC339529, LINC00229, and SNHG5) which were identified by qRT-PCR. The results were consistent with those obtained by microarray analysis. Specifically, studies have shown that lncRNA TUG1, induced by p53, inhibited specific genes related to cell-cycle regulation;Citation52 silencing of lncRNA TUG1 suppressed retinal development in a developing mouse eye.Citation28 Studies have shown that lncRNA TUG1 was highly expressed in hepatocellular carcinomaCitation53 and urothelial carcinoma of the bladder.Citation31 In our study, silencing of TUG1 by siRNA markedly increased the ability of proliferation in BEAS-2B and HFL1 cells. Results indicated that TUG1 deletion decreased the expression levels of α-SMA and fibronectin proteins which are mesenchymal markers in BEAS-2B and HFL1 cells.
TGF-β induces various cellular responses, including differentiation, inflammation, proliferation, and apoptosis, and plays a vital role in COPD, asthma, cancer, and other pathological processes.Citation54 Study showed that TGF-β enhanced extracellular matrix synthesis to influence expression of the fibrogenic cytokine in numerous tissues.Citation55 In our study, BEAS-2B and HFL1 cells were induced by TGF-β for 48 h. The ability of proliferation and expression of α-SMA and fibronectin proteins were analyzed. Results showed that TGF-β markedly inhibited the ability to proliferate and clearly promoted the expression of α-SMA and fibronectin proteins in BEAS-2B and HFL1 cells.
Conclusion
In summary, our study involving microarray analysis comprehensively indicated the expression levels of lncRNAs in COPD and non-COPD lung tissues. The target prediction of lncRNA and potential functional characteristics will help in exploring the potential effect in patients with COPD. KEGG pathway and GO enrichment analysis may help in exploring potential genomic regulatory networks and offer more new potential therapeutic targets. Furthermore, relevant research with regard to function and mechanism could make lncRNA TUG1 a potential diagnostic marker in patients with COPD.
Author contributions
All authors made substantial contributions to conception and design, acquisition of data, or analysis and interpretation of data; took part in drafting the article or revising it critically for important intellectual content; gave final approval of the version to be published; and agree to be accountable for all aspects of the work.
Disclosure
The authors report no conflicts of interest in this work.
References
- DemedtsIKDemoorTBrackeKRJoosGFBrusselleGGRole of apoptosis in the pathogenesis of COPD and pulmonary emphysemaRespir Res200675316571143
- PauwelsRABuistASCalverleyPMJenkinsCRHurdSSGOLD Scientific CommitteeGlobal strategy for the diagnosis, management, and prevention of chronic obstructive pulmonary diseaseAm J Respir Crit Care Med200116351256127611316667
- PauwelsRARabeKFBurden and clinical features of chronic obstructive pulmonary disease (COPD)Lancet2004364943461362015313363
- DemedtsIKBrusselleGGBrackeKRVermaelenKYPauwelsRAMatrix metalloproteinases in asthma and COPDCurr Opin Pharmacol20055325726315907912
- BarnesPJShapiroSDPauwelsRAChronic obstructive pulmonary disease: molecular and cellularmechanismsEur Respir J200322467268814582923
- LahzamiSAubertJDLung transplantation for COPD-evidence-basedSwiss Med Wkly20091391–24819142750
- American Thoracic SocietyIdiopathic pulmonary fibrosis: diagnosis and treatment. International consensus statement. American Thoracic Society (ATS), and the European Respiratory Society (ERS)Am J Respir Crit Care Med20001612 Pt 164666410673212
- MogayzelPJJrNaureckasETRobinsonKAPulmonary Clinical Practice Guidelines CommitteeCystic fibrosis pulmonary guidelines: chronic medications for maintenance of lung healthAm J Respir Crit Care Med2013187768068923540878
- GuttmanMAmitIGarberMChromatin signature reveals over a thousand highly conserved large non-coding RNAs in mammalsNature2009458723522322719182780
- KongLZhangYYeZ-QCPC: assess the protein-coding potential of transcripts using sequence features and support vector machineNucleic Acids Res200735Web Server issueW345W34917631615
- WangKCChangHYMolecular mechanisms of long noncoding RNAsMol Cell201143690491421925379
- RinnJLKerteszMWangJKFunctional demarcation of active and silent chromatin domains in human HOX loci by noncoding RNAsCell200712971311132317604720
- KimAZhaoHIfrimIDeanABeta-globin intergenic transcription and histone acetylation dependent on an enhancerMol Cell Biol20072782980298617283048
- ManagadzeDRogozinIBChernikovaDShabalinaSAKooninEVNegative correlation between expression level and evolutionary rate of long intergenic noncoding RNAsGenome Biol Evol201131390140422071789
- KrangelMST cell development: better living through chromatinNat Immunol20078768769417579647
- PontingCPOliverPLReikWEvolution and functions of long non-coding RNAsCell200913662964119239885
- GuttmanMDonagheyJCareyBWlincRNAs act in the circuitry controlling pluripotency and differentiationNature2011477736429530021874018
- GuptaRAShahNWangKCLong non-coding RNA HOTAIR reprograms chromatin state to promote cancer metastasisNature201046472911071107620393566
- TaftRJPangKCMercerTRDingerMMattickJSNon-coding RNAs: regulators of diseaseJ Pathol2010220212613919882673
- KlattenhoffCAScheuermannJCSurfaceLEBraveheart, a long noncoding RNA required for cardiovascular lineage commitmentCell2013152357058323352431
- GutschnerTHämmerleMEissmannMThe noncoding RNA MALAT1 is a critical regulator of the metastasis phenotype of lung cancer cellsCancer Res20137331180118923243023
- JohnsonRLong non-coding RNAs in Huntington’s disease neurodegenerationNeurobiol Dis201246224525422202438
- CongrainsAKamideKOguroRGenetic variants at the 9p21 locus contribute to atherosclerosis through modulation of ANRIL and CDKN2A/BAtherosclerosis2012220244945522178423
- SpizzoRAlmeidaMIColombattiACalinGALong non-coding RNAs and cancer: a new frontier of translational research?Oncogene201231434577458722266873
- CaoGZhangJWangMDifferential expression of long non-coding RNAs in bleomycin-induced lung fibrosisInt J Mol Med201332235536423732278
- JiPDiederichsSWangWMALAT-1, a novel noncoding RNA, and thymosin beta4 predict metastasis and survival in early-stage non-small cell lung cancerOncogene200322398031804112970751
- McKiernanPJMolloyKCryanSAMcElvaneyNGGreeneCMLong noncoding RNA are aberrantly expressed in vivo in the cystic fibrosis bronchial epitheliumInt J Biochem Cell Biol20145218419124631641
- YoungTLMatsudaTCepkoCLThe noncoding RNA taurine upregulated gene 1 is required for differentiation of the murine retinaCurr Biol200515650151215797018
- ZhangEBYinDDSunMP53-regulated long non-coding RNA TUG1 affects cell proliferation in human non-small cell lung cancer, partly through epigenetically regulating HOXB7 expressionCell Death Dis20145e124324853421
- ZhangQGengPLYinPWangXLJiaJPYaoJDown-regulation of long non-coding RNA TUG1 inhibits osteosarcoma cell proliferation and promotes apoptosisAsian Pac J Cancer Prev2013142311231523725133
- HanYLiuYGuiYCaiZLong intergenic non-coding RNA TUG1 is overexpressed in urothelial carcinoma of the bladderJ Surg Oncol2013107555555922961206
- CaoW-JWuH-LHeB-SZhangY-SZhangZ-YAnalysis of long non-coding RNA expression profiles in gastric cancerWorld J Gastroenterol201319233658366423801869
- CabiliMNTrapnellCGoffLIntegrative annotation of human large intergenic noncoding RNAs reveals global properties and specific subclassesGenes Dev201125181915192721890647
- DerrienTJohnsonRBussottiGThe GENCODE v7 catalog of human long noncoding RNAs: analysis of their gene structure, evolution, and expressionGenome Res20122291775178922955988
- KanehisaMGotoSFurumichiMTanabeMHirakawaMKEGG for representation and analysis of molecular networks involving diseases and drugsNucleic Acids Res201038D355D36019880382
- Standards for the diagnosis and care of patients with chronic obstructive pulmonary diseaseAmerican Thoracic SocietyAm J Respir Crit Care Med19951525 Pt 2S77S1217582322
- BuistASGuidelines for the management of chronic obstructive pulmonary diseaseRespir Med200296Suppl CS11S1612199486
- JonesPWQuirkFHBaveystockCMLittlejohnsPA self-complete measure of health status for chronic airflow limitation. The St George’s Respiratory QuestionnaireAm Rev Respir Dis19921456132113271595997
- SeemungalTADonaldsonGCPaulEABestallJCJeffriesDJWedzichaJAEffect of exacerbation on quality of life in patients with chronic obstructive pulmonary diseaseAm J Respir Crit Care Med19981575 Pt 1141814229603117
- MattickJSMakuninIVNon-coding RNAHum Mol Genet200615Spec1R17R2916651366
- MattickJSThe genetic signatures of noncoding RNAsPLoS Genet200954e100045919390609
- TufarelliCStanleyJAGarrickDTranscription of antisense RNA leading to gene silencing and methylation as a novel cause of human genetic diseaseNat Genet200334215716512730694
- HarriesLWLong non-coding RNAs and human diseaseBiochem Soc Trans201240490290622817756
- LinRMaedaSLiuCaKarinMEdgingtonTSA large noncoding RNA is a marker for murine hepatocellular carcinomas and a spectrum of human carcinomasOncogene200726685185816878148
- BarreiroESieckGMuscle dysfunction in COPDJ Appl Physiol201311491220122123393064
- LodiseTPMcKinnonPSSwiderskiLRybakMJOutcomes analysis of delayed antibiotic treatment for hospital-acquired Staphylococcus aureus bacteremiaClin Infect Dis200336111418142312766837
- BaiPSunYJinJDisturbance of the OPG/RANK/RANKL pathway and systemic inflammation in COPD patients with emphysema and osteoporosisRespir Res20111215722176920
- DasguptaSSahaMChakrabartiSChakrabortyJVisceral leishmaniasis with pleural effusion in an immunocompetent patientLung India2014311565824669085
- PollerWKühlUTschoepeCPauschingerMFechnerHSchultheissHPGenome–environment interactions in the molecular pathogenesis of dilated cardiomyopathyJ Mol Med(Berl)200583857958615931504
- LorenowiczMJFernandez-BorjaMHordijkPLcAMP signaling in leukocyte transendothelial migrationArterioscler Thromb Vasc Biol20072751014102217347487
- SimoneRERussoMCatalanoALycopene inhibits NF-kB-mediated IL-8 expression and changes redox and PPARγ signalling in cigarette smoke-stimulated macrophagesPLoS One201165e1965221625550
- KhalilAMGuttmanMHuarteMMany human large intergenic noncoding RNAs associate with chromatin-modifying complexes and affect gene expressionProc Natl Acad Sci U S A200910628116671167219571010
- HuangMDChenWMQiFZLong non-coding RNA TUG1 is up-regulated in hepatocellular carcinoma and promotes cell growth and apoptosis by epigenetically silencing of KLF2Mol Cancer20151416526336870
- BorovikovaLVIvanovaSZhangMVagus nerve stimulation attenuates the systemic inflammatory response to endotoxinNature2000405678545846210839541
- EpsteinFHBorderWANobleNATransforming growth factor β in tissue fibrosisN Engl J Med199433119128612927935686
- EngströmPGTommeiDStrickerSHEnderCPollardSMBertonePDigital transcriptome profiling of normal and glioblastoma-derived neural stem cells identifies genes associated with patient survivalGenome Med201247623046790
- AntúnezCBoadaMGonzález-PérezAThe membrane-spanning 4-domains, subfamily A (MS4A) gene cluster contains a common variant associated with Alzheimer’s diseaseGenome Med2011353321627779
- GerhardingerAGenomische und transkriptionelle Veränderungen im Pankreaskarzinom [dissertation]GermanyUniversitätsklinikum Ulm2012 German
- XuYWangJQiuMUpregulation of the long noncoding RNA TUG1 promotes proliferation and migration of esophageal squamous cell carcinomaTumour Biol20153631643165125366138
- BraconiCKogureTValeriNmicroRNA-29 can regulate expression of the long non-coding RNA gene MEG3 in hepatocellular cancerOncogene201130474750475621625215
- QinRChenZDingYHaoJHuJGuoFLong non-coding RNA MEG3 inhibits the proliferation of cervical carcinoma cells through the induction of cell cycle arrest and apoptosisNeoplasma201360548649223790166
- YingLHuangYChenHDownregulated MEG3 activates autophagy and increases cell proliferation in bladder cancerMol BioSyst20139340741123295831
- WangPRenZSunPOverexpression of the long non-coding RNA MEG3 impairs in vitro glioma cell proliferationJ Cell Biochem201211361868187422234798
- LiuSJNowakowskiTJPollenAASingle-cell analysis of long non-coding RNAs in the developing human neocortexGenome Biol2016176727081004
- LiHYuBLiJCharacterization of differentially expressed genes involved in pathways associated with gastric cancerPLoS One2015104e012501325928635
- KwakSHParkKSGenetic studies on diabetic microvascular complications: focusing on genome-wide association studiesEndocrinol Metab (Seoul)201530214715826194074
- ZhaoLGuoHZhouBLong non-coding RNA SNHG5 suppresses gastric cancer progression by trapping MTA2 in the cytosolOncogene Epub2016411
- IchigozakiYFukushimaSJinninMSerum long non-coding RNA, snoRNA host gene 5 level as a new tumor marker of malignant melanomaExp Dermatol2016251676926440365
- XinWLiuXDingJLong non-coding RNA derived miR-205-5p modulates human endometrial cancer by targeting PTENAm J Transl Res20157112433244126807189