

Abstract
Background
Homology is a mathematical concept that can be used to quantify degree of contact. Recently, image processing with the homology method has been proposed. In this study, we used the homology method and computed tomography images to quantify emphysema.
Methods
This study included 112 patients who had undergone computed tomography and pulmonary function test. Low-attenuation lung regions were evaluated by the homology method, and homology-based emphysema quantification (b0, b1, nb0, nb1, and R) was performed. For comparison, the percentage of low-attenuation lung area (LAA%) was also obtained. Relationships between emphysema quantification and pulmonary function test results were evaluated by Pearson’s correlation coefficients. In addition to the correlation, the patients were divided into the following three groups based on guidelines of the Global initiative for chronic Obstructive Lung Disease: Group A, nonsmokers; Group B, smokers without COPD, mild COPD, and moderate COPD; Group C, severe COPD and very severe COPD. The homology-based emphysema quantification and LAA% were compared among these groups.
Results
For forced expiratory volume in 1 second/forced vital capacity, the correlation coefficients were as follows: LAA%, −0.603; b0, −0.460; b1, −0.500; nb0, −0.449; nb1, −0.524; and R, −0.574. For forced expiratory volume in 1 second, the coefficients were as follows: LAA%, −0.461; b0, −0.173; b1, −0.314; nb0, −0.191; nb1, −0.329; and R, −0.409. Between Groups A and B, difference in nb0 was significant (P-value = 0.00858), and those in the other types of quantification were not significant.
Conclusion
Feasibility of the homology-based emphysema quantification was validated. The homology-based emphysema quantification was useful for the assessment of emphysema severity.
Supplementary materials
Figure S1 All binarized images used in the simulation study.
Notes: Left: the binarized images obtained from simulation A. Right: the binarized images obtained from simulation B. LAA% of the two images in the same row was identical. For each row, LAA% increases by 5%.
Abbreviation: LAA%, percentage of low-attenuation lung area.
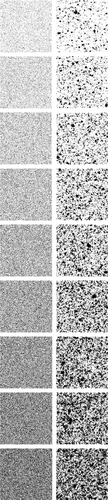
Figure S2 Representative computed tomography (CT) images and results of preprocessing of the upper, middle, and lower lung fields in a 64-year-old man with COPD.
Notes: Forced expiratory volume in 1 second (FEV1)/forced vital capacity; FEV1; b0, b1, R; and the percentage of low-attenuation lung area were 67.4%; 61.4%; 944, 39, 0.0413; and 5.13%, respectively (b0, the zero-dimensional Betti number; b1, the one-dimensional Betti number; R, b1/b0). The CT images and the binarized images are shown in (A–C) and (D–F), respectively.
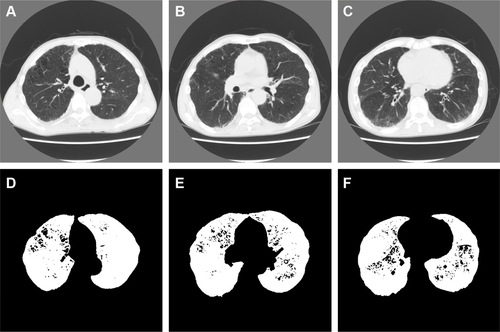
Figure S3 Representative computed tomography (CT) images and results of preprocessing of the upper, middle, and lower lung fields in a 77-year-old man with COPD.
Notes: Forced expiratory volume in 1 second (FEV1)/forced vital capacity; FEV1; b0, b1, R; and the percentage of low-attenuation lung area were 42.8%; 50.2%; 1,420, 321, 0.226; and 26.5%, respectively (b0, the zero-dimensional Betti number; b1, the one-dimensional Betti number; R, b1/b0). The CT images and the binarized images are shown in (A–C) and (D–F), respectively.
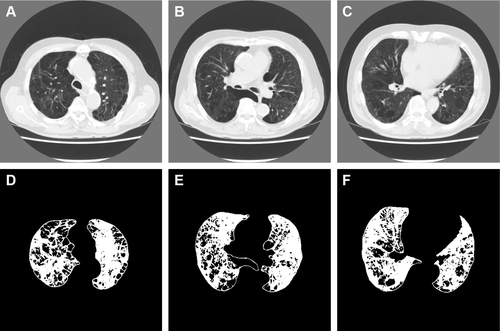
Figure S4 Representative computed tomography (CT) images and results of preprocessing of the upper, middle, and lower lung fields in a 75-year-old man with COPD.
Notes: Forced expiratory volume in 1 second (FEV1)/forced vital capacity; FEV1; b0, b1, R; and the percentage of low-attenuation lung area were 28.1%; 27.5%; 977, 443, 0.453; and 56.6%, respectively (b0, the zero-dimensional Betti number; b1, the one-dimensional Betti number; R, b1/b0). The CT images and the binarized images are shown in (A–C) and (D–F), respectively.
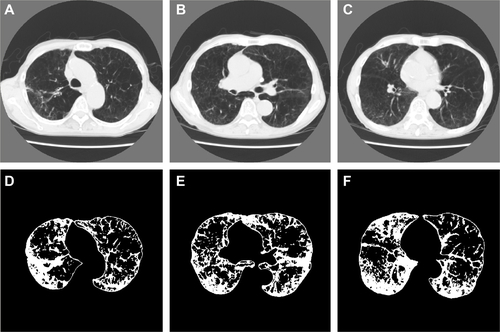
Table S1 Results of emphysema quantification in the three groups
Table S2 Summary of the emphysema quantification in all the patients, nonsmokers, smokers without COPD, and COPD patients
Acknowledgments
This study was supported by JSPS KAKENHI Grant-in-Aid for Scientific Research (B) (Grant Number 26310209).
Disclosure
The authors report no conflicts of interest in this work.