
Abstract
Background
COPD is defined as partly irreversible airflow obstruction. The response pattern of bronchodilators has not been followed in advanced lung function parameters.
Purpose
The aim of this study was to investigate bronchodilator response pattern in advanced lung function parameters in a continuous fashion along forced expiratory volume in 1 second (FEV1) percent predicted (%p) in COPD patients and controls.
Patients and methods
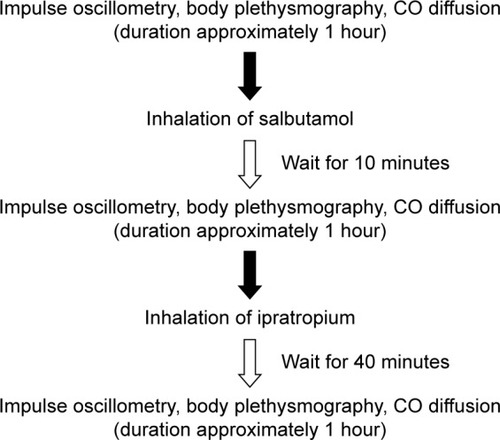
Eighty-one smokers/ex-smokers (41 controls and 40 COPD) performed spirometry, body plethysmography, impulse oscillometry and single-breath helium dilution carbon monoxide diffusion at baseline, after salbutamol inhalation and then after an additional inhalation of ipratropium.
Results
Most pulmonary function parameters showed a linear increase in response to decreased FEV1%p. The subjects were divided into groups of FEV1%p <65 and >65, and the findings from continuous analysis were verified. The exceptions to this linear response were inspiratory capacity (IC), forced vital capacity (FVC), FEV1/FVC and expiratory resistance (Rex), which showed a segmented response relationship to FEV1%p. IC and FVC, with break points (BP) of 57 and 58 FEV1%p respectively, showed no response above, but an incresed slope below the BP. In addition, in patients with FEV1%p <65 and >65, response of FEV1%p did not correlate to response of volume parameters.
Conclusion
Response of several advanced lung function parameters differs depending on patients’ baseline FEV1%p, and specifically response of volume parameters is most pronounced in COPD patients with FEV1%p <65. Volume and resistance responses do not follow the flow response measured with FEV1 and may thus be used as a complement to FEV1 reversibility to identify flow, volume and resistance responders.
Introduction
COPD is one of the world’s leading causes of death and is defined to have a progressive, partly irreversible airflow limitation due to a chronic inflammation in the airways. It is heterogenic in nature with varying degrees of emphysema and chronic bronchitis. COPD is diagnosed in patients using anamnesis and spirometry, but it is known that flow–volume spirometry mainly measures alterations in the central airways. Recently, it has been observed that destruction in the peripheral airways is present prior to changes observed by spirometry,Citation1 and methods to measure the peripheral airway changes are necessary. We have previously shown that baseline impulse oscillometry (IOS) parameters seem to be more affected in moderate-to-severe COPD patients, while volume and diffusion parameters are more affected in severe and very severe COPD patients. In addition, we showed that the lung function parameters are widely spread in Global Initiative for chronic Obstructive Lung Disease (GOLD) stage 2.Citation2 Post hoc investigations of this study identified break points (BPs) in the linear relationship between forced expiratory volume in 1 second (FEV1) percent predicted (%p) and advanced lung function parameters, identifying a change in the lung function pattern when FEV1%p drops below 65.Citation3 However, how these patterns change due to bronchodilators is not known. The topic of whether the bronchodilator response in FEV1 is limited in COPD patients has been discussed,Citation4 and studies have explored the reversibility of FEV1, forced vital capacity (FVC) and FEV1/FVC based on disease stage (based on GOLD stages).Citation5,Citation6 Other studies suggest that the reversibility of FEV1 is not a useful tool in COPD and that there might be many other relevant parameters when evaluating the response.Citation4 In some studies, other advanced lung function parameters are used to evaluate the response,Citation7–Citation13 but there is no information about the clinically significant response and the parameters that are most effective to use. The use of volume parameters for assessing bronchodilator response in patients with hyperinflation has shown that bronchodilation decreases hyperinflation.Citation14 The response of parameters of forced oscillometry (FOT) after salbutamol has recently been described in different GOLD stages. These data showed a significant response in milder stage of COPD compared to controls with a tendency of lower response in more advanced stage.Citation15 However, the bronchodilator response of parameters measured by the closely related IOS method and volume parameters measured by body plethysmography in correlation to other parameters has not been investigated in relation to COPD disease severity based on FEV1%p.
We aimed to investigate the response of advanced lung function parameters, beyond FEV1, to short-acting bronchodilators in a continuous fashion over a broad range of FEV1%p. Hence, we identified the relevant parameters that are most important when assessing bronchodilator response and at which disease severity patients benefit most from the treatment.
Patients and methods
Study participants
A total of 81 volunteers (smokers and ex-smokers) were included in the study () and were classified as controls (fixed ratio FEV1/FVC >0.7; n=41) or COPD patients (FEV1/FVC <0.7; n=40). After the continuous analysis, subjects were also divided into FEV1%p <65 and >65 (independent of FEV1/FVC) to assess subjects at different disease stages. This division was based on our previous study that indicates that the disease patterns change around FEV1%p of 65%p.Citation3 All study participants refrained from their inhaled bronchodilators 8 hours (short-acting β2 agonist [SABA] or short-acting muscarinic antagonist [SAMA]) and 48 hours (long-acting β2 agonist [LABA] or long-acting muscarinic antagonist [LAMA]), respectively, before the visit. All participants had ≥10 pack-years and had no previous diagnoses of asthma or any other pulmonary disease (except COPD) or any lower respiratory infection/exacerbation within the last 3 weeks.
Table 1 Patient characteristics, daily medication and baseline lung function
Study design
Study participants performed IOS (MasterScreen, Erich Jaeger GmbH, Würzburg, Germany) giving information about total airway resistance (R5), central airway resistance (R20), peripheral airway resistance (R5–R20), reactance at 5 Hz (X5), reactance area (AX) and resonance frequency (Fres).Citation16 Body plethysmography with spirometry (MasterScreen Body, Erich Jaeger GmbH)Citation17 provided information about flow and volume parameters, FEV1, FVC, FEV1/FVC, functional residual capacity (FRC), residual volume (RV), inspiratory capacity (IC) and total lung capacity (TLC), and resistance, including inspiratory resistance (Rin) and expiratory resistance (Rex). Single-breath helium dilution carbon monoxide diffusion (MasterScreen Diffusion, Erich Jaeger GmbH)Citation18–Citation20 was performed to obtain diffusion capacity of the lung for carbon monoxide (DL,CO), alveolar volume (VA), DL,CO/VA, RV, FRC and TLC. These measurements were performed at baseline, 10 minutes after inhalation of SABA (400 µg salbutamol; Buventol®, Easyhaler®) and then again 40 minutes after inhalation of additional SAMA (80 µg ipratropium; Atrovent®, Handihaler®) (). Lung function measurements were performed according to manufacturer’s instructions and European Respiratory Society/American Thorax Society recommendations.Citation19,Citation21,Citation22 The reference values used were established by Crapo et alCitation23 (spirometry), Quanjer et alCitation24 (body plethysmography and single breath) and VogelCitation25 (IOS). Study participants also filled the Clinical COPD Questionnaire.
Figure 1 Flowchart of the study design.
This study was approved by the Regional Ethical Review Board in Lund (431/2008) and followed the guidelines set in the Declaration of Helsinki, and all study participants signed the informed consent.
Statistics
To detect BPs, a regression model allowing segmented relationships was performed as previously described.Citation3 Shortly, this method estimates a new model having a segmented relationship from an existing linear regression (LR) model.Citation3 Ordinary LR and a nonparametric fit by the loess (local regression) line are also used for visual purpose.Citation26–Citation28
shows the FVC%p at baseline and after inhalation of SABA and additional SAMA, respectively, in relation to post-bronchodilator FEV1%p. The light gray line shows the smooth loess; the straight line the LR; and the broken line, where half the line is dotted, is the segmented linear regression (SLR). The dot in shows where the BP is with 95% confidence interval. BP is given as FEV1%p. The estimated LR () or SLR (if significant over LR; ) of each graph is then plotted into one graph to visualize the lung function before and after SABA+SAMA (), which shows a shift of the curves. This method is also applied in graphs in . LR and SLR were also investigated in the absolute response in .
Figure 2 FVC%p at (A) baseline and (B) after inhalation of SABA and additional SAMA in COPD patients and controls.
Notes: The solid line to left and the hatched line to right of the BP are the segmented linear fits that join at the BP, estimated in the top of the figure (circles with the associated 95% confidence intervals). An ordinary LR line (hatched gray) and the reference and a nonparametric fit by the loess (local regression) method (gray line) are also displayed. Dots show the values of each subject. (C) The first two (A and B) linear/segmented linear curves plotted into one graph to illustrate bronchodilator response.
Abbreviations: FVC, forced vital capacity; %p, percent predicted; SABA, short-acting β2 agonist; SAMA, short-acting muscarinic antagonist; BP, break point; LR, linear regression.
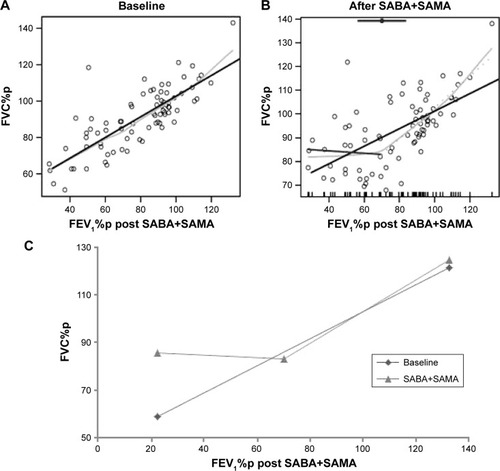
Figure 3 Lungfunction, before and after bronchodilators.
Notes: (A) FEV1/FVC, (B) IC%p, (C) Rex and (D) FEV1%p at baseline and after inhalation of SABA and additional SAMA in COPD patients and controls. Graphs show linear regression lines or segmented regression lines (if segmentation was significant).
Abbreviations: FEV1, forced expiratory volume in 1 second; FVC, forced vital capacity; IC, inspiratory capacity; %p, percent predicted; SABA, short-acting β2 agonist; SAMA, short-acting muscarinic antagonist.
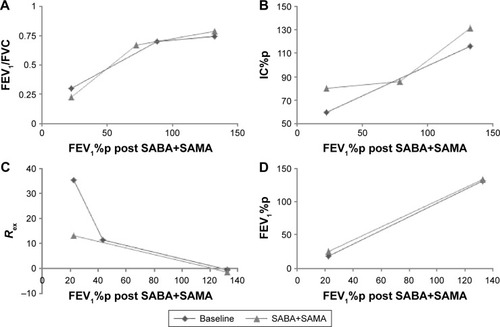
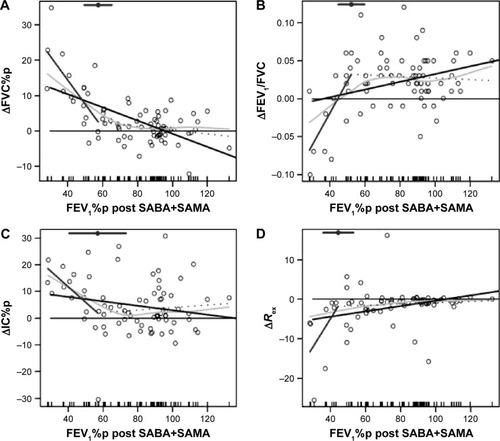
Figure 4 Bronchodilator response.
Abbreviations: FVC, forced vital capacity; FEV1, forced expiratory volume in 1 second; IC, inspiratory capacity; %p, percent predicted; BP, break point; LR, linear regression, SABA, short-acting β2 agonist (salbutamol); SAMA, short-acting muscarinic antagonist (ipratropium).
All responses shown in – and S1 are displayed as absolute response (Δ)Citation29 and with parameters expressed as %p when possible.
Table 2 LR and SLR for lung function response to SABA and additional SAMA
Table 3 Absolute response of lung function parameters after SABA with additional SAMA
Table 4 Correlation between absolute response in lung function parameters (in Δ values) after inhalation of SABA+SAMA
Normally distributed (FEV1, FVC, FVC%p and IC%p) paired data were analyzed using analysis of variance with Bonferroni’s multiple comparison test, and uneven distributed paired data were analyzed using Friedman test with Dunn’s multiple comparison test. Normally distributed unpaired data were analyzed using Unpaired students t-test, and uneven distributed unpaired data were analyzed using Mann–Whitney U test. Data are presented as median with interquartile range. A P-value <0.05 was considered significant. Statistical calculations were performed in R or GraphPad Prism (version 5).
Results
Continuous analysis of lung function at baseline and after inhalation of SABA with additional SAMA
Most of the parameters that show linearity or segmented linearity at baseline maintain this pattern even after inhalation of SABA with additional SAMA, except FVC%p (), FEV1/FVC (), IC%p () and Rex ().
FVC%p and IC%p change from favoring linear relationship at baseline to segmented relationship after inhalation of SABA+SAMA, while Rex changes from being segmented at baseline to linear after inhalation of SABA+SAMA. FEV1/FVC shows BPs at both tests, but the BP is much lower after inhalation of SABA+SAMA.
Continuous analysis of absolute response to SABA with additional SAMA
The bronchodilator response to SABA+SAMA was analyzed for LR and SLR, and the following parameters showed a significant SLR (BP within parenthesis; ; ), ie, the same parameters change their pattern as described earlier (): ΔFVC%p (58%; ), ΔFEV1/FVC (52%; ), ΔIC% (57%; ) and ΔRex (44%; ).
All the four parameters showed a significant slope at the left side of the BP (= at low FEV1%p), while the slope to the right (= at high FEV1%p) was not significant ().
The following parameters showed a significant LR slope when the response was linearly increasing to a decrease in FEV1%p (): ΔRV%p, ΔFRC%p, ΔRin, ΔRtot%p, ΔDL,CO%p, ΔR5%p, ΔR5–R20%p and ΔAX.
The remaining parameters showed no significant LR slope or SLR (), but ΔFEV1%p, ΔX5%p and ΔDL,CO/VA%p showed significant intercepts, indicating a similar response over the severity range. ΔTLC%p, ΔR20%p and ΔVA%p showed no significant slope or intercept, indicating an insignificant response over the severity range.
Response to SABA with additional SAMA in subjects with FEV1%p <65 or >65
In our previous study,Citation3 several parameters had BPs around FEV1 65%p. A related pattern is shown in this study, investigating the continuous relationship between the bronchodilator response and FEV1%p. To investigate the potential difference in the bronchodilator response (compared to baseline) of the different lung function parameters, the subjects were therefore further divided into groups of FEV1%p <65 and >65 ( and ).
Some of the lung volume parameters showed a significant bronchodilator response only in patients with FEV1%p <65 (): RV%p and FVC%p.
Other lung function parameters showed a significant bronchodilator response in both the groups (FEV1%p <65 and >65) (): FEV1%p, FRC%p, IC%p, FEV1, R5%p, R5–R20%p, X5%p, AX, Fres, Rin, Rex and Rtot%p.
All the above parameters showed a significantly higher bronchodilator response for the group below FEV1%p <65, except: FEV1, IC%p, R20%p and Fres.
The remaining parameters showed no response to the bronchodilator (or very little; data not shown): TLC%p, DL,CO%p, VA%p and DL,CO/VA%p.
Correlation between response in flow, volume, resistance and reactance parameters to SABA with additional SAMA
The correlations between ΔFEV1%p (flow), ΔFVC%p (flow volume), ΔRV%p (volume), ΔRtot%p (resistance), R5–R20%p (peripheral resistance) and ΔAX (reactance) were investigated to define the relationship within the response of different lung function parameters. In subjects with FEV1%p <65, ΔFEV1%p correlated only with ΔFVC%p, while ΔFVC%p, ΔRV%p, ΔRtot%p and ΔAX correlated with most of each other (). In contrast, in subjects with FEV1%p >65, ΔFEV1%p correlated with ΔFVC%p, ΔR5–R20%p and ΔAX, while no correlations were found among ΔFVC%p, ΔRV%p, ΔRtot%p and ΔAX ().
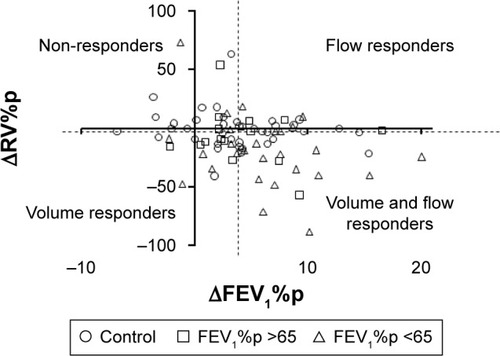
Response in volume, resistance and reactance correlated with each other but not with FEV1%p. To visualize the relationships and the individual responses, ΔRV%p was plotted against ΔFEV1%p (). Some patients were both flow and volume responders, while some were either flow or volume responders, but no clear grouping could be demonstrated. Flow responders were defined as having a response in FEV1%p above the median response in this cohort, while volume responders were defined as having a response in RV%p above the median response in this cohort. With this definition, 18 subjects (11 controls and 7 COPD) were classified as neither flow nor volume responders (nonresponders in ).
Figure 5 Relationship between ΔFEV1%p and ΔRV%p.
Abbreviations: FEV1, forced expiratory volume in 1 second; %p, percent predicted; RV, residual volume.
Analysis of response to only SABA
All patients were also tested for the response to only SABA. A similar pattern was seen for the “continuous analysis of lung function at baseline and after inhalation of SABA” and for the “continuous analysis of absolute response to SABA” (Table S1) as for the double bronchodilators. Although FEV1/FVC did not show any response, DL,CO%p and R5%p did not have a significant slope, while R20%p did have. For “response to SABA in subjects with FEV1%p <65 or >65”, there seemed to be less effect of only SABA on several parameters compared to SABA+SAMA (Table S2). When looking at the “correlations between flow/volume/resistance/reactance response to SABA”, a similar pattern was observed for SABA+SAMA with few correlations to ΔFEV1 in the FEV1%p <65 group, but to all except volume in the FEV1%p >65 group (Table S3).
Discussion
In this study, we found that several volume and resistance parameters (measured by body plethysmography and IOS) differ from the response pattern seen in FEV1%p. We found that parameters reflecting volume response were more prominent in patients with more severe stage of COPD, while resistance parameters were more significant in less advanced stage. Most of the resistance and reactance parameters from IOS and body plethysmography responded to SABA, while the volume parameters were affected only mainly in patients with FEV1%p <65 or in patients who needed not only SABA but also the addition of SAMA to gain a significant effect.
The overall clinical aim in COPD should be to improve function in the small peripheral airways both by improving flow and by decreasing the degree of alveolar hypoventilation (flow responders) as well as decreasing air trapping and hyperinflation (volume responders). The degree of air trapping relates to the degree of dyspnea and the functional aspects, including BODE index as a composite score.Citation30 In order to evaluate the effect of bronchodilators, it is thus important to go beyond the information provided by FEV1, mainly reflecting flow resistance in the central airways.Citation4 These results indicate that the use of FEV1%p as a tool to investigate the effect of bronchodilators is not representative of the changes occurring in the respiratory system. Also, the bronchodilator response of many parameters, such as RV and Rtot, tends to be greater in patients with more severe disease (lower FEV1%p) and not correlating to the FEV1%p response. The addition of SAMA to SABA seems to be most effective in more severe patients whose volume parameters are affected, although data show that the combination of therapies can be beneficial to patients already in an early stage.
Regarding the response of IOS parameters, most of the parameters showed a better response with more severe disease, as previously stated. This is almost in accordance with the findings of da Costa et alCitation15 regarding bronchodilator response using FOT, since we had more patients with milder disease.
Response to SABA was 1.4%–4% (40–120 mL), which is very low compared to the clinically relevant response.Citation31 Additional inhalation of SAMA increased the response, especially in patients with FEV1%p <65, to 6% (210 mL). The continuous analysis did not detect higher response in more severe patients (nonsignificant slope), but the intercept was significant and thereby in accordance with the response analysis. Calverley et alCitation4 questioned the clinical relevance of reversibility tests in COPD, which is in line with our SABA data, showing the importance of not only using double bronchodilators for optimal bronchodilation but also addition of other parameters measuring volume, resistance and reactance.
Only patients with lower FEV1%p (FEV1%p <65) showed a significant response in RV%p and FVC%p, and this improvement also differed significantly compared to subjects with FEV1%p >65. ΔFVC%p showed a significant SLR with BP at FEV1%p at 57, with no improvement in patients over this BP. This suggests that these improvements are a trait only in patients with more severe COPD and that there is no use in measuring at least FVC%p response over FEV1%p at 57. ΔRV%p showed a highly significant LR, crossing the X-axis around FEV1%p at 100%, implying that the response is very low in high FEV1%p but gradually increases as the disease progresses.
All parameters (except for Fres) that were significantly reversible in both groups to SABA and SABA+SAMA showed a significantly higher improvement in patients with more severe COPD. These data imply that the main effects of bronchodilators on lung function parameters other than FEV1%p are in the more severe group.
When the correlations and relationship of the difference in bronchodilator response were investigated, we observed a bronchodilator effect in the volume, resistance and reactance, beyond what can be measured with ΔFEV1%p. Data suggest that it might be beneficial to use RV%p in addition to FEV1%p when evaluating response to bronchodilators, since this parameter did not correlate with FEV1%p but with those of the peripheral airways (R5–R20%p, AX) in patients with FEV1%p <65. This also implies that there might be an importance in measuring the response but that more parameters should be evaluated to provide a fair picture of the response pattern. To visualize if a patient is a flow or a volume responder, the ratio of ΔRV%p/ΔFEV1%p may be used, since there seems to be patients being only flow responders, only volume responders, or both flow and volume responders. However, this method should be further verified to define a stable limit, dividing nonresponders from responders. Here, we used the median in the population. Another approach could be using zero response or a set limit (eg, what is clinical relevant). Further characterization of these patient subgroups in a clinical context would be of interest. This could also be applied to identify resistance and reactance parameters by using ΔAX/ΔFEV1%p and ΔRtot%p (or ΔR5–R20%p)/ΔFEV1%p, respectively.
Many lung function parameters did significantly improve, and many improvements were significantly better in the FEV1%p <65 group than in the subjects with FEV1%p >65, and this is supported by the fact that many parameters showed LR and SLR in the same direction. This also implies that the changes, even those in the peripheral airways, are only partially irreversible and that patients below the BP could benefit from bronchodilators even if they are not reversible in FEV1%p.
A limitation of this study is not only the number of patients but also the distribution of disease severity. Due to difficulties in performing all maneuvers repeatedly or difficulties refraining from medications, the population is a bit skewed toward the milder/moderate disease.
By identifying the parameters that show an effect in response to bronchodilators, it is possible to obtain a deeper understanding about what happens in the airways when bronchodilators are inhaled. By studying these parameters, it would be possible to measure the effectiveness of bronchodilators in different phenotypes/severities of COPD patients. A future perspective is to elucidate if these data hold true in a longitudinal study with long-acting bronchodilators to connect the effects in lung function parameters to those of clinical symptoms and dyspnea.
Conclusion
Some lung function parameters are significantly reversible along FEV1%p, while resistance and volume parameters show different response patterns along the FEV response curve. Measuring the response to resistance may be more informative in milder stages, while volume response parameters are more important in patients with lower FEV1%p. Thus, knowing that the bronchodilator effect in volume and resistance does not follow the FEV1%p response, those parameters should therefore be considered when characterizing patients according to bronchodilator response. This approach can help us in gaining insight into individualizing the diagnosis and therapy of COPD.
Acknowledgments
The authors would like to thank the staff at the Lung and Allergy Research Unit, Skåne, and also Dr Anders Olin for help and support. This work was supported by independent research grants from the Swedish Heart and Lung Foundation, Swedish Research Council, Evy and Gunnar Sandberg’s Foundation, Crafoord Foundation, and Royal Physiographic Society in Lund.
Supplementary materials
Table S1 Continuous analysis of SABA
Table S2 Response to SABA
Table S3 Correlation of lung Δ function parameters after inhalation of SABA
Disclosure
The authors report no conflicts of interest in this work.
References
- FrantzSNihlenUDenckerMEngstromGLofdahlCGWollmerPImpulse oscillometry may be of value in detecting early manifestations of COPDRespir Med201210681116112322613172
- JarenbackLAnkerstJBjermerLTufvessonEFlow-volume parameters in COPD related to extended measurements of lung volume, diffusion, and resistancePulm Med2013201378205223844288
- ErikssonGJarenbäckLPetersonSAnkerstJBjermerLTufvessonEA new approach to assess COPD by identifying lung function break-pointsInt J Chron Obstruct Pulmon Dis2015102193220226508849
- CalverleyPMAlbertPWalkerPPBronchodilator reversibility in chronic obstructive pulmonary disease: use and limitationsLancet Respir Med20131756457324461617
- AlbertPAgustiAEdwardsLBronchodilator responsiveness as a phenotypic characteristic of established chronic obstructive pulmonary diseaseThorax201267870170822696176
- SchermerTHeijdraYZadelSFlow and volume responses after routine salbutamol reversibility testing in mild to very severe COPDRespir Med200710161355136217098407
- BorrillZLHoughtonCMWoodcockAAVestboJSinghDMeasuring bronchodilation in COPD clinical trialsBr J Clin Pharmacol200559437938415801931
- BorrillZLHoughtonCMTal-SingerRThe use of plethysmography and oscillometry to compare long-acting bronchodilators in patients with COPDBr J Clin Pharmacol200865224425218251761
- ZerahFLorinoAMLorinoHHarfAMacquin-MavierIForced oscillation technique vs spirometry to assess bronchodilatation in patients with asthma and COPDChest1995108141477606989
- TimminsSCDibaCSchoeffelRESalomeCMKingGGThamrinCChanges in oscillatory impedance and nitrogen washout with combination fluticasone/salmeterol therapy in COPDRespir Med2014108234435024144670
- AbeTSetoguchiYKonoYEffects of inhaled tiotropium plus transdermal tulobuterol versus tiotropium alone on impulse oscillation system (IOS)-assessed measures of peripheral airway resistance and reactance, lung function and quality of life in patients with COPD: a randomized crossover studyPulm Pharmacol Ther201124561762421689775
- MineshitaMShikamaYNakajimaHCOPD EXHALATION InvestigatorsThe application of impulse oscillation system for the evaluation of treatment effects in patients with COPDRespir Physiol Neurobiol20142021525046279
- SinojiaRShaikhMKodguleRPriming of beta-2 agonist and antimuscarinic induced physiological responses induced by 1200mg/day NAC in moderate to severe COPD patients: a pilot studyRespir Physiol Neurobiol2014191525924211316
- NewtonMFO’DonnellDEForkertLResponse of lung volumes to inhaled salbutamol in a large population of patients with severe hyperinflationChest200212141042105011948031
- da CostaGMFariaACDi MangoAMLopesAJLopes de MeloPRespiratory impedance and response to salbutamol in healthy individuals and patients with COPDRespiration201488210111124992904
- OostveenEMacLeodDLorinoHERS Task Force on Respiratory Impedance MeasurementsThe forced oscillation technique in clinical practice: methodology, recommendations and future developmentsEur Respir J20032261026104114680096
- GoldmanMDSmithHJUlmerWTWhole-body plethysmographyEur Respir Monogr2005311543
- HughesJMBPulmonary gas exchangeEur Respir Monogr200531106126
- MacintyreNCrapoROViegiGStandardisation of the single-breath determination of carbon monoxide uptake in the lungEur Respir J200526472073516204605
- HorstmanMMertensFStamHTransfer factor for carbon monoxideEur Respir Monogr200531127145
- MillerMRHankinsonJBrusascoVStandardisation of spirometryEur Respir J200526231933816055882
- WangerJClausenJLCoatesAStandardisation of the measurement of lung volumesEur Respir J200526351152216135736
- CrapoROMorrisAHGardnerRMReference spirometric values using techniques and equipment that meet ATS recommendationsAm Rev Respir Dis198112366596647271065
- QuanjerPHTammelingGJCotesJEPedersenOFPeslinRYernaultJCLung volumes and forced ventilatory flows. Report working party standardization of lung function tests, European Community for Steel and Coal. Official Statement of the European Respiratory SocietyEur Respir J Suppl1993165408499054
- VogelSImplementation der Sollwertgleichungen für IOS“Impuls-Oszillometrie” pmi-Verlag1994S.148S.152 German
- MuggeoVMEstimating regression models with unknown break-pointsStat Med200322193055307112973787
- MuggeoVMSegmented: an R package to fit regression models with broken-line relationshipsR News2008812025
- ClevelandWSGrosseEShyuWMLocal regression modelsChambersSJMHastieTJStatistical ModelsWadsworth & Brooks/Cole1992309376
- BrandPLQuanjerPHPostmaDSInterpretation of bronchodilator response in patients with obstructive airways disease. The Dutch Chronic Non-Specific Lung Disease (CNSLD) Study GroupThorax19924764294361496502
- LeeYKOhYLeeJKOLD Study GroupQuantitative assessment of emphysema, air trapping, and airway thickening on computed tomographyLung200818615718351420
- TanWCVollmerWMLamprechtBWorldwide patterns of bronchodilator responsiveness: results from the burden of obstructive lung disease studyThorax201267871872622544896