
Abstract
This study aimed to evaluate the effects of a high refined carbohydrate diet and pulmonary inflammatory response in C57BL/6 mice exposed to cigarette smoke (CS). Twenty-four male mice were divided into four groups: control group (CG), which received a standard diet; cigarette smoke group (CSG), which was exposed to CS; a high refined carbohydrate diet group (RG), which received a high refined carbohydrate diet; and a high refined carbohydrates diet and cigarette smoke group (RCSG), which received a high refined carbohydrate diet and was exposed to CS. The animals were monitored for food intake and body weight gain for 12 weeks. After this period, the CSG and RCSG were exposed to CS for five consecutive days. At the end of the experimental protocol, all animals were euthanized for subsequent analyses. There was an increase of inflammatory cells in the bronchoalveolar lavage fluid (BALF) of CSG compared to CG and RCSG compared to CG, CSG, and RG. In addition, in the BALF, there was an increase of tumor necrosis factor alpha in RCSG compared to CG, CSG, and RG; interferon gamma increase in RCSG compared to the CSG; and increase in interleukin-10 in RCSG compared to CG and RG. Lipid peroxidation increased in RCSG compared to CG, CSG, and RG. Furthermore, the oxidation of proteins increased in CSG compared to CG. The analysis of oxidative stress showed an increase in superoxide dismutase in RCSG compared to CG, CSG, and RG and an increase in the catalase activity in RCSG compared with CG. In addition, there was a decrease in the glutathione reduced/glutathione total ratio of CSG, RG, and RCSG compared to CG. Therefore, the administration of a high refined carbohydrate diet promoted an increase in pulmonary inflammation and oxidative stress in mice exposed to CS.
Introduction
Obesity is defined as an abnormal or excessive fat accumulation, a consequence of the sedentary lifestyle of modern society, and harmful to health.Citation1 Although the pathogenesis has not been fully elucidated,Citation2 it is well known that this disease is not defined by a single cause, but by a heterogeneous set of conditions caused by multiple factors, resulting in the phenotype of this disease. Its etiology has genetic contributions, which can be mitigated or exacerbated by factors such as the external environment and psychosocial interactions that interfere in physiological mediators of energy control.Citation3 Studies on obesity have intensified due to increased prevalence of this disease in recent decades, becoming a worldwide epidemic.Citation4 The World Health Organization estimates that 2.8 million people die each year as a result of overweight or obesity.Citation5 Obesity, particularly the accumulation of visceral fat, is considered as a chronic low-grade inflammationCitation6 and presents important factors in the initiation and progression of metabolic disorders.Citation7 Thus, the adipocytokines include proinflammatory mediators, such as tumor necrosis factor alpha (TNF-α), interleukin-6, resistin, and leptin, responsible for disease progression. Moreover, anti-inflammatory adipocytokines, such as interleukin-10 (IL-10) and adiponectin, normally found at low levels in obese individuals are responsible for protection against the development of obesity-related complications.Citation8
Cigarette smoking and obesity is a global public health problem and risk factor for many diseases, such as chronic obstructive pulmonary disease and cancer, and it represents the second cause of avoidable morbidity and mortality in the world.Citation9,Citation10 It causes the death of 6 million people worldwide every year.Citation9,Citation11–Citation13 In addition, some studies have shown that the risk of some diseases increases when obesity and smoking are present.Citation14 Cigarette smoke (CS) is composed of >5,000 substances, which makes it an exogenous source of free radicals capable of initiating chemical reactions that cause cellular dysfunction and cytotoxicity.Citation15 Reactive oxygen species and reactive nitrogen species are produced in living organisms as a result of cellular metabolism and in low concentrations they act in cell signaling (control of pathogens).Citation16,Citation17 CS produces reactive species that, at high concentrations, promote biological damage in molecules, such as deoxyribonucleic acid (DNA), protein, and polyunsaturated fatty acids of cell membranes. However, the human body is composed of an antioxidant defense system composed of enzymes, such as superoxide dismutase (SOD), catalase (CAT), and glutathione peroxidase, which act on the decomposition of the superoxide anion (O2−), hydrogen peroxide (H2O2), and lipoperoxide, respectively. The imbalance between the production of these reactive species and the antioxidant enzymes results in oxidative stress.Citation18–Citation21
Particulate matter of CS is deposited in the airways and on the surfaces of alveolar epithelial cells, thus nonspecific and specific defense mechanisms are involved in the removal of these substances. The innate and adaptive immune responses are ways to protect against toxic substances, which affect the pulmonary alveoli. The lung defense system is stimulated by acute inflammatory response that causes tissue injury by the recruitment and activation of neutrophils, eosinophils, and macrophages.Citation22 Therefore, this study aimed at evaluating the effects of a high refined carbohydrates diet and pulmonary inflammatory response in C57BL/6 mice exposed to CS.
Materials and methods
Animals
Twenty-four male C57BL/6 mice aged between 5 and 7 weeks were obtained from the Laboratory of Experimental Nutrition (LABNEX), School of Nutrition – Federal University of Ouro Preto (UFOP). The animals were kept in boxes with controlled temperature, light, and humidity (21°C±2°C, 12 hours light/dark, 50%±10%, respectively) and received water and standard feed ad libitum. This study was performed according to the rules of animal protection and the ethical principles of the Brazilian Society of Science in Laboratory Animals (SBCAL) and was approved by the Ethics Committee on Animal Use (CEUA) UFOP (Protocol number 2014/06).
Diet and CS protocols
Animals were divided into four groups (n=6) where the control group (CG) received a standard chow for rodents of Labina-Purina® (Evialis Group, São Paulo, Brazil) over 12 weeks; the control diet and exposure to cigarette smoke group (CSG) received standard chow for rodents of Labina-Purina over 12 weeks and were exposed to CS for 5 consecutive days; a high refined carbohydrate group (RG) received a diet with high content of refined carbohydrate over 12 weeks; and high refined carbohydrates diet and cigarette smoke group (RCSG) received a diet with high content of refined carbohydrate over 12 weeks and were exposed to CS for 5 consecutive days. Mice of RG and RCSG groups were fed with high palatability diet consisting of 10% refined sugar, 45% of standard chow, and 45% of Nestlé® condensed milk (São Paulo, Brazil), which is used to promote body weight gain in animals.Citation23–Citation25 Mice of RCSG and CSG groups were exposed to 12 commercial filtered cigarette Virginia (10 mg tar, 0.9 mg nicotine, and 10 mg of carbon monoxide per cigarette) per day divided into three times daily (morning, afternoon, and night, four cigarettes per inhalation) for 5 consecutive days. Mice were placed in the inhalation chamber (40 cm long, 30 cm wide, and 25 cm high). Each cigarette was coupled to a 60-mL plastic syringe, through which the smoke was injected inside the inhalation chamber. The animals of each group were kept in these conditions for 6 minutes. After this time, the lid was removed from the chamber for 1 minute for a complete exhaustion of the air and, then, the procedure was repeated with the remaining cigarettes.Citation26–Citation29 CG was subjected to the same conditions mentioned earlier, except for the use of cigarettes. Twenty-four hours after the end of the experiment, the animals were euthanized by overdose of ketamine (130 mg/kg) and xylazine (0.3 mg/kg).
Food intake and body mass
The control of food intake and body mass gain was carried out once a week. The food intake before being served to the animals and the feces were weighed weekly. For the control of body weight gain, the animals were also weighed individually using a digital balance (Mark®; M Series/Bel Analytical Equipment LTDA, São Paulo, Brazil).
Oral glucose tolerance test (OGTT)
After 11 weeks of experiment, the insulin sensitivity in animals was measured using an OGTT. To perform the test, animals remained 12 hours on a fast and received a solution containing 2.5 g of glucose per kilogram of body mass via the orogastric gavage. Blood glucose was first measured and followed by the administration of the solution with the aid of an automatic glucometer (Accu-Chek Advantage/Roche Diagnostics Brazil Ltda, São Paulo, Brazil) and tapes to measure blood glucose at 0, 15, 30, 60, and 90 minutes.Citation23–Citation25
Bronchoalveolar lavage fluid (BALF) analysis
Immediately after euthanasia, the thorax of each animal was opened for the collection of BALF. The left lung was clamped, the trachea was cannulated, and the right lung was washed with 1.5 mL saline solution (3×500 μL). Samples were kept on ice until the end of the procedure to avoid cell lysis. For total leukocyte count in BALF, a Neubauer chamber with trypan blue dye 0.2% was used. For differential cell counts in BALF, the cytospin centrifuge (Shandon, Waltham, MA, USA) was used, on which slides at 1,000 rpm for 1 minute were placed. After obtaining the slides, they were stained with Panotic Quick kit (Laborclin, Pinhais, Paraná).Citation30
Analysis of hematological parameters
Two hundred microliters of blood was collected by cardiac puncture and diluted in saline (1:2). The hematological parameters were evaluated by the electronic counting device (micro 60; ABX diagnostics, Horiba, Tokyo, Japan) from Pilot Laboratory of Clinical Analyses (LAPAC – UFOP).
Analysis of lung
After BALF collection, the right ventricle of each animal was perfused with saline for the removal of the blood of the lungs. The right lung was clamped so that only the left lung was perfused with buffered 4% formalin (pH 7.2) via the trachea. The left lung was removed and immersed in formalin for 48 hours. The material was then processed and stained with hematoxylin and eosin (H&E) for histological analysis. The right lung was removed and stored in labeled tubes. Afterwards, the right lung was homogenized in phosphate buffer (pH 7.5) and centrifuged at 10,000 rpm for 10 minutes, its supernatant was collected, and the samples were stored in a freezer at −80°C for biochemical analyses.
Analysis of adipose tissue
The adipose tissue (retroperitoneal, epididymal, and mesenteric) was collected during euthanasia and subsequently weighed to determine the adiposity index, which was calculated according to Oliveira et al.Citation23
Immunoassays for inflammatory markers
Lung and adipose tissues and BALF were used for the analyses of TNF-α, interferon gamma (IFN-γ), IL-10, and leptin. The immunoassays were performed in 96-well plates in which 100 μL of monoclonal antibody to protein (or peptide) was added, which was diluted in phosphate-buffered saline (PBS) containing 0.1% bovine serum albumin (BSA; Sigma-Aldrich, Billerica, MA, USA). After incubation for 12 hours at room temperature, the plates were blocked with 300 μL/well of a PBS solution containing 1% BSA for 1 hour at 37°C. Samples were applied in a volume of 100 μL to each well. The reading of the intensity of staining was performed using an enzyme-linked immunosorbent assay (ELISA) reader at wavelength of 490 nm. All chemokine ELISA kits were purchased from Peprotech (Ribeirão Preto, Brazil).
Oxidative stress biomarkers and antioxidant activities
Lipid peroxidation was determined by the assay of thiobarbituric acid reactive substances as described by Buege and Aust.Citation31 The material was centrifuged for 10 minutes at 13,000 rpm, and the supernatant was read in a spectrophotometer at 535 nm. The carbonyl protein assay was performed by the method described by Levine et al.Citation32 The CAT activity was measured by the decrease rate of H2O2 to an absorbance of 240 nm represented by U/mg of protein.Citation33 The SOD activity was measured according to the method described by Marklund and Marklund;Citation34 based on the enzyme ability to inhibit the autoxidation of pyrogallol; the absorbances were read in the ELISA reader at a wavelength of 570 nm. Glutathione is present in the cells mainly in its reduced form (GSH) and its remainder in oxidized form (GSSG). The glutathione assay was adapted from Sigma® commercial kit # CS0260 and kinetic method was used to measure the levels of glutathione (GSH + GSSH) by the reduction of 5,5′-dithio-bis-2-nitrobenzoic acid in thionitrobenzoic acid. Protein content was analyzed on the samples of tissue homogenate by the Bradford method, and its concentration was represented in mg/mL.Citation35
Morphometric analysis of lung and adipose tissues
The analysis of volume density (Vv) of the alveolar septa Vv [sa] was performed on a test system consisting of 16 points and a known test-area where the forbidden line was taken as the limit, in order to avoid an overestimation in the number of structures. The test system was coupled to a screen connected to a microscope. The number of points (Pp) which reached the alveolar septa (Vv [sa]) and the alveolar spaces (Vv [a]) were evaluated according to the total number of points of a test system (Pt). To obtain uniform and proportional lung samples, we analyzed 18 random fields in a cycloid test system attached to the monitor screen. The reference volume is estimated by point counting using the system test point (Pt). The total area of 1.94 mm2 was analyzed to determine the volume density of alveolar septa (Vv [sa]) and the alveolar spaces (Vv [a]) in sections stained with H&E, respectively.
Histomorphometric analysis of adipocytes was performed using photomicrographs of the slides in a light microscope equipped with digital camera (Leica DFC 300 FX) attached, and associated with the Leica Application Suite image capture software, and an objective lens with 10-fold increase was used. The area was obtained by randomly measuring 50 adipocytes per slide through ImageJ® software (National Institutes of Health, Bethesda, MD, USA).Citation23,Citation24
Statistical analysis
Data were expressed as mean ± standard error of the mean. Evaluation of data normality was performed using the Kolmogorov–Smirnov test. The analyses univariate and bivariate variances (ANOVA one-way and two-way) followed by Bonferroni post-test were used for parametric data. The Kruskal–Wallis test followed by Dunn’s post-test was used for nonparametric data. The significant difference was considered when P-value was less than 0.05. All analyses were performed using GraphPad Prism software version 5.00 for Windows 7, GraphPad Software (San Diego, CA, USA).
Results
Food intake and body mass
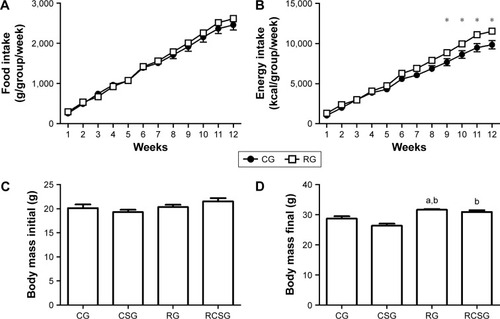
There was no significant difference in cumulative food intake (g/group/week) of animals fed with standard chow and high refined carbohydrate diet during the 12-week experimental protocol, as shown in . However, the animals of RG showed higher cumulative food intake (kcal/group/week) in the last 4 weeks of the protocol compared with CG, as shown in . It can be seen from that there were no significant differences in body weights of the groups prior to initiation of diet protocol. There was also an increase of body mass in RG compared with CG and CSG. In addition, body weight in RCSG increased compared with CSG, as shown in .
Figure 1 Cumulative food intake of animals fed a standard diet and diet high in refined carbohydrates, and body mass of the experimental groups.
Abbreviations: ANOVA, analysis of variance; CG, control group; CSG, cigarette smoke group; RG, high refined carbohydrate group; RCSG, high refined carbohydrates diet and cigarette smoke group.
Oral glucose tolerance test
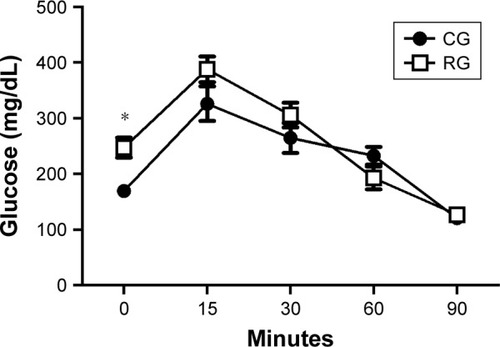
There was an increase of the blood glucose levels in RG compared with CG at time zero. However, there was no significant difference between groups at different times, as shown in .
Figure 2 Blood glucose levels of the experimental groups.
Abbreviations: ANOVA, analysis of variance; CG, control group; RG, high refined carbohydrate group (n=6).
Inflammatory cells influx analysis in bronchoalveolar lavage
There was an increase in the total number of leukocytes in the CSG compared with CG and in RCSG compared with the other groups. In addition, there was an increase in macrophages in RCSG compared with CG and CSG. There was an increase in lymphocytes in RCSG compared with the other groups and an increase of neutrophils in CSG and RCSG compared with CG and CSG ().
Table 1 Cell influx in the bronchoalveolar lavage of the experimental groups
Analysis of hematological parameters
There was an increase in the concentrations of erythrocyte, hematocrit, and hemoglobin in CSG compared with CG, CSG, and RCSG, as shown in .
Table 2 Hematological parameters of the experimental groups
Oxidative damage and antioxidant defense
There was an increase in lipid peroxidation in RCSG compared with the other groups and there was an increase in protein oxidation in CSG compared with CG. There was an increase in SOD activity in RCSG compared with the other groups and an increased CAT activity in RCSG compared with CG. Regarding the glutathione system, the results showed a decrease in the GSH/GSSG ratio in CSG, RG, and RCSG compared with CG, as shown in .
Table 3 Biochemical analysis in lung samples from the CG, CSG, RG, and RCSG groups
BALF and lung homogenate immunoenzymatic assays
There was a decrease in TNF-α of the homogenized lung tissue in RCSG compared with CSG and RG, a decrease in IFN-γ in RG and RCSG compared with CG, and a decrease in IL-10 in RCSG compared with CG (). Regarding BALF, there was an increase in TNF-α in RCSG compared with CG, CSG, and RG, an increase in IFN-γ in RCSG compared with CSG, and an increase in IL-10 in RCSG compared with CG and RG ().
Table 4 Levels of TNF-α, IFN-γ, and IL-10 of the pulmonary parenchyma in lung samples of the experimental groups
Table 5 Levels of TNF-α, IFN-γ, and IL-10 of the bronchoalveolar lavage fluid pulmonary parenchyma in lung samples of the experimental groups
Morphometry of the lung tissue
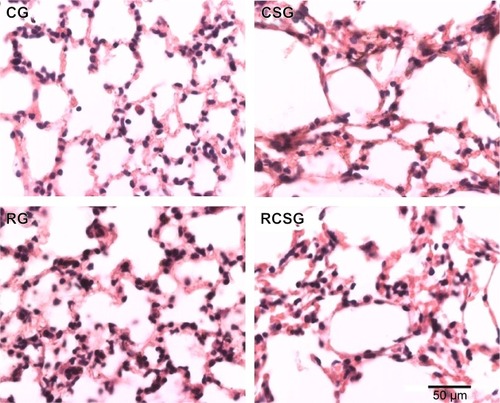
There was an increase in Vv [a] in CSG and RCSG compared with CG and RG (). There was a decrease in Vv [sa] in CSG compared with the other groups and a decrease in RCSG compared with CG and RG (). shows in photomicrographs an increased Vv [a] and decreased Vv [sa] in experimental groups.
Figure 3 Morphometry of lung tissue.
Notes: (A) Alveolar volume density. (B) Volume density of the alveolar septa. aSignificant difference between the CSG and RCSG compared to CG, bsignificant difference between the groups when compared with the CSG, and csignificant difference between the CSG and RCSG compared to RG. Data are expressed as median, minimum and maximum values and were analyzed by Kruskal–Wallis test followed by Dunn’s post-test (P<0.05). RCSG (n=6).
Abbreviations: CG, control group; CSG, cigarette smoke group; RG, high refined carbohydrate group; RCSG, high refined carbohydrates diet and cigarette smoke group.
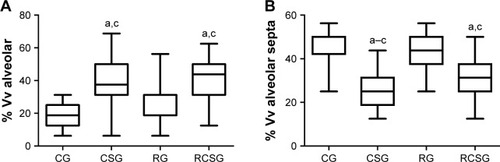
Figure 4 Photomicrographs of lung sections stained with hematoxylin and eosin.
Abbreviations: CG, control group; CSG, cigarette smoke group; RG, high refined carbohydrate group; RCSG, high refined carbohydrates diet and cigarette smoke group; Vv, volume density.
Adipose tissue analysis
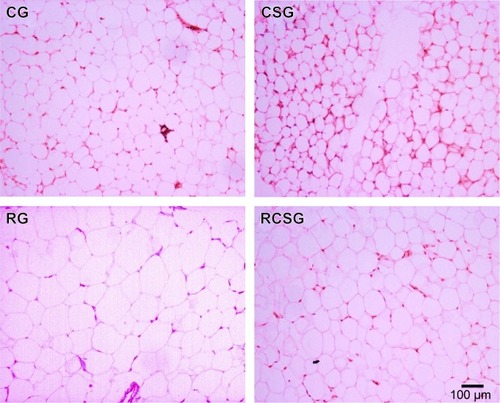
There was an increase in body adiposity index (BAI) and the area of adipocytes in RG compared with CG, CSG, and RCSG (). The area of adipocytes was measured to evaluate the diet efficiency. Thus, the area of adipocytes increased in RG compared with CG, CSG, and RCSG and also increased in RCSG compared with CG and CSG, as shown in . Plasma leptin levels were measured to evaluate the diet efficiency, as previously mentioned for the BAI. Thus, shows that there were increasing concentrations of leptin in the RG, and RCSG compared with CG. shows the photomicrographs of the expansion of adipocytes.
Figure 5 Adipose tissue analysis. (A) Adiposity index in the experimental groups. (B) Area adiposity. (C) Plasma leptin levels.
Notes: aSignificant difference between the RG and RCSG compared to CG, bsignificant difference between RG and RCSG compared to CSG, csignificant difference between the RCSG compared to RG, and dsignificant difference between RG compared to RCSG. Data are expressed as mean ± SEM and were analyzed by one-way ANOVA followed by Bonferroni’s post-test (P<0.05). RCSG group size, n=6.
Abbreviations: ANOVA, analysis of variance; CG, control group; CSG, cigarette smoke group; RG, high refined carbohydrate group; RCSG, high refined carbohydrates diet and cigarette smoke group; SEM, standard error of the mean.
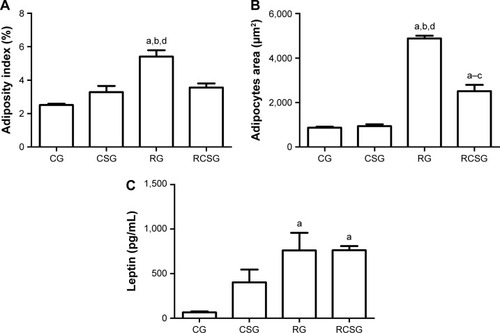
Figure 6 Representative photomicrographs of epididymal adipose tissue stained with hematoxylin and eosin.
Abbreviations: CG, control group; CSG, cigarette smoke group; RCSG, high refined carbohydrates diet and cigarette smoke group; RG, high refined carbohydrate group.
Discussion
In this study, we evaluated the association between a high refined carbohydrate diet and pulmonary inflammatory response in C57BL/6 mice exposed to CS. The effects of the diet on food intake, body weight, and BAI of animals were observed. Cell influx into the lung parenchyma, hematological parameters, and oxidative stress parameters in the lungs were also analyzed.
As previously reported by Oliveira et al,Citation23 the high refined carbohydrate diet did not induce higher food consumption (g/group) of the experimental groups, but caused a greater cumulative energy consumption (kcal/group/week) in RG compared with CG. The high-carbohydrate diet provided a 10% increase in kcal ingested by the animals, which caused significant difference between the diets when the accumulated consumption exceeded 1,916.15 g/group/week, despite not having a hypercaloric character. Combined with the higher energy consumption of animals fed with high refined carbohydrate diet, an increase in body weight of these animals compared with the other experimental groups was observed. This increase in body mass is associated with the increase in BAI because the chronic energy overload tends to store the excess energy as lipids in adipose tissue.Citation24 This happens because obesity is a low-intensity chronic inflammationCitation36 characterized by the increase of the area of adipocytes and serum levels of adipocytokines, such as leptin, among other factors. However, BAI results were not observed in animals which consumed the diet and were exposed to CS compared with the animals that had only consumed the diet because CS is related to various systemic inflammatory processes by the activation and release of inflammatory cells.Citation37 Our results corroborate with the studies of Dourado et alCitation38 and Mehta et al,Citation39 where in some cases the inflammatory processes caused loss of body mass and inhibition of growth of the adipose tissues. In the studies of Oberman et alCitation40 and Xue and Ideraabdullah,Citation41 mass gain resulting from increased BAI is related to various obesity-associated diseases, such as diabetes mellitus, cardiovascular diseases, cancer, and hyperglycemia. It is known that the composition of the diet offered during the induction of obesity directly influences the development of such diseases since the nutrients act as cellular signal.Citation42,Citation43 Hao et alCitation44 highlighted that the diet with higher amounts of sucrose, as in this study, leads to increased glycemic index and in turn to increased blood glucose levels, promoting fat storage. Thus, upon insulin stimulation induced by a high-carbohydrate diet, there will be the activation of glycolysis, the inhibition of gluconeogenesis, and the accumulation of acetylcoenzyme A and triacylglycerols. Therefore, the fasting hyperglycemia of the animals was caused by insulin resistance.Citation45
CS is composed of various chemical substances, such as, carbon monoxide, which has a high affinity for hemoglobin and binds to it to form carboxyhemoglobin, an inactive form of hemoglobin that has no ability to load O2 molecules. The CS causes a decrease in blood O2 levels. As a result, the body increases the production of red blood cells (erythrocytes, hemoglobin, and hematocrit) to compensate for the decrease in oxygen carrying capacity.Citation46 These data corroborate our results, as there was an increase in red blood cell levels in the CS compared with CG.
The exposure to CS caused an increase in the influx of inflammatory cells in BALF, which corroborates with the previous studies of Bezerra et al,Citation47 who reported an increase in cell influx into the lungs in the groups exposed to CS. In association, an increase in the number of neutrophils in the group exposed to CS was observed, which is explained by the fact that CS influences the accumulation of these cells in the airways, according to Baines et al.Citation48 In addition, neutrophils are associated with the production of mediators of innate immunity and the increased airflow obstruction.Citation48 The experimental group that received a high refined carbohydrate diet presented an increase of inflammatory cells compared with CG. Therefore, it is important to highlight, according to Williams et al, Milner et al, and Calixto et al, that there are studies in the literature that correlate to diet-induced obesity with pulmonary inflammation triggered by several factors, but this correlation has not yet been studied with exposure to CS.Citation49–Citation51
Cytokines are produced by diverse cells at the site of injury and immune cells, such as monocytes and macrophages via the activation of protein kinases activated by mitogens.Citation52 Through immunoenzymatic analysis carried out in lung homogenate, a decrease of TNF-α, IFN-γ, and IL-10 was observed. These results are related to the increase observed in the analysis of macrophages in BALF since IFN-γ is a cytokine responsible for macrophage activation and has proinflammatory function.Citation52 The activation of macrophages also influences the release of IL-10, a regulatory and anti-inflammatory cytokine that inhibits proinflammatory cytokines, such as TNF-α and IFN-γ.Citation52 In addition, the increase in TNF-α, IFN-γ, and IL-10 concentrations in BALF justifies the results found in the lung homogenate, since the release of these cytokines decreases their respective concentrations.
One approach used to verify the occurrence of oxidative stress is to measure lipid peroxidation and protein oxidation.Citation53 Obesity was able to intensify the pulmonary inflammatory process arising from various causes and, in our study, we observed lipid peroxidation when the exposure to CS was associated with diet-induced obesity. In addition, the protein oxidation process was observed in animals exposed to CS, which demonstrates the influence of CS on the cell damage and consequent loss of cell functionality.Citation54 The association of cell damage with CS toxins activates enzymes that compose the antioxidant system in the body. SOD is an enzyme responsible for catalyzing the reduction of superoxide into H2O2. Since this is a short-term exposure protocol, our results showed no increase in the SOD activity in animals exposed to CS, however, when this exposure was associated with the inflammatory process brought about by obesity, we observed an increase in the activity of this enzyme. The SOD activity increased in response to the increase in superoxide radicals, which in turn are derived in large part from the O2 reduction process triggered by hydroquinones and quinones present in CS.Citation28 In addition, obesity potentiated pulmonary inflammatory process and caused an increase in neutrophils and macrophages. The inflammatory processes resulting from the exposure to obesity and CS are both responsible for the imbalance of SOD. As a cascade reaction, the imbalance of SOD also triggered the imbalance of other systems related to the redox homeostasis of the lungs. We observed that in an attempt to neutralize the superoxide excess, SOD generated an excess of H2O2, which in turn caused an increase in the concentrations of the glutathione system. In addition, the H2O2 concentration induced the obese animals exposed to CS to increase the activity of CAT, one of the enzymes responsible for catalyzing the reduction of water to H2O2.Citation16,Citation17,Citation54
The remodeling of the histoarchitecture of the lungs is mediated by protein oxidation, peroxidation of membrane lipids, and breaking of DNA strands.Citation55 Valença and PortoCitation56 affirmed that neutrophils and macrophages are some of the main arms responsible for elastolytic damage and the remodeling of the lung architecture. Thus, the stereological analyses of our study corroborate the results obtained by cell counts in BALF. We observed an increase in alveolar volume density and a decrease in alveolar septa volume density, which are characteristics that indicate the presence of acute pulmonary inflammation and are related to the production of matrix metalloproteinases by inflammatory cells.Citation57 Therefore, the administration of a high-refined carbohydrate diet promoted an increase in pulmonary inflammation and oxidative stress in mice exposed to CS.
Limitations of the study
This experimental study has focused on understanding the association between the administration of a high refined carbohydrate diet and the exposure to cigarette smoke in animals, therefore, our results cannot be compared with studies in humans.
Disclosure
The authors report no conflicts of interest in this work.
References
- MarinouKTousoulisDAntonopoulosASStefanadiEStefanadisCObesity and cardiovascular disease: from pathophysiology to risk stratificationInt J Cardiol201013813819398137
- ZhuBYangCHuaFLeptin disturbance probably involved in the pathogenesis of obesity-induced depressive symptomsMaturitas201580333525596812
- FrancischiRPPPereiraLOFreitasCSObesity: updated information about its etiology, morbidity and treatmentRev Nutr20001311728
- World Health OrganizationObesity and overweight [Fact sheet] updated June 2016. Available from: http://www.who.int/mediacentre/factsheets/fs311/en/Accessed May 3, 2015
- BeskeSDAlvarezGEBallardTPDavyKPReduced cardiovagal baroreflex gain in visceral obesity: implications for the metabolic syndromeAm J Physiol Heart Circ Physiol20022822H630H63511788412
- LeiteRDPrestesJBernardesCFEffects of ovariectomy and resistance training on lipid content in skeletal muscle, liver, and heart; fat depots; and lipid profileAppl Physiol Nutr Metab20093461079108620029517
- OhashiKShibataRMuroharaTOuchiNRole of anti-inflammatory adipokines in obesity-related diseasesTrends Endocrinol Metab201425734835524746980
- OuchiNParkerJLLugusJJWalshKAdipokines in inflammation and metabolic diseaseNat Rev Immunol2011112859721252989
- PintoMTPichon-RiviereABardachAEstimativa da carga do tabag-ismo no Brasil: mortalidade, morbidade e custos [The burden of smoking-related diseases in Brazil: mortality, morbidity and costs]Cadernos de Saúde Pública20153112831297 Portuguese26200375
- World Health OrganizationGlobal status report on noncommunicable diseases 2010: Description of the global burden of NCDs, their risk factors and determinants2011 Available from: http://www.who.int/nmh/publications/ncd_report2010/en/Accessed April 10, 2016
- MonsUMuscatJEModestoJRichieJPJrBrennerHEffect of smoking reduction and cessation on the plasma levels of the oxidative stress biomarker glutathione – Post-hoc analysis of data from a smoking cessation trialFree Radic Biol Med20169117217726708755
- BeckettELStevensRLJarnickiAGA new short-term mouse model of chronic obstructive pulmonary disease identifies a role for mast cell tryptase in pathogenesisJ Allergy Clin Immunol2013131375276223380220
- HasselbalchHCSmoking as a contributing factor for development of polycythemia vera and related neoplasmsLeuk Res2011391111371145
- TiltonSCKarinNJWeb-RobertsonBJImpaired transcriptional response of the murine heart to cigarette smoke in the setting of high fat diet and obesityChem Res Toxicol20132671034104223786483
- HoffmannDHoffmannIEl-BayoumyKThe less harmful cigarette: a controversial issue a tribute to Ernst L. WynderChem Res Toxicol200114776779011453723
- BirbenESahinerUMSackesenCErzurumSKalayciOOxidative stress and antioxidant defenseWorld Allergy Organ J20125191923268465
- BindoliARigobelloMPPrinciples in redox signaling: from chemistry to functional significanceAntioxid Redox Signal201318131557159323244515
- HalliwellBFree radicals, reactive oxygen species and human disease: a critical evaluation with special reference to atherosclerosisBr J Exp Pathol19897067377572557883
- YuBPCellular defenses against damage from reactive oxygen speciesPhysiol Rev19947411391628295932
- FubiniBHubbardAReactive oxygen species (ROS) and reactive nitrogen species (RNS) generation by silica in inflammation and fibrosisFree Radic Biol Med200334121507151612788471
- PerlsteinTSLeeRTSmoking, metalloproteinases, and vascular diseaseArterioscler Thromb Vasc Biol200626225025616339501
- MisharinAVMorales-NebredaLMutluGMBudingerGRPerlmanHFlow cytometric analysis of macrophages and dendritic cell subsets in the mouse lungAm J Respir Cell Mol Biol201349450351023672262
- OliveiraMCMenezes-GarciaZHenriquesMCAcute and sustained inflammation and metabolic dysfunction induced by high refined carbohydrate-containing diet in miceObesity (Sliver Spring)2013219E396E406
- Menezes-GarciaZOliveiraMCLimaRLLack of platelet-activating factor receptor protects mice against diet-induced adipose inflammation and insulin-resistance despite fat pad expansionObesity (Sliver Spring)2014223663672
- SoaresNPCamposKKDPenaKBThe effects of combination of a refined carbohydrate diet and exposure to hyperoxia in miceOxid Med Cell Longev20162016 Article ID 1014928
- BezerraFSValençaSSPiresKMLong-term exposure to cigarette smoke impairs lung function and increases HMGB-1 expression in miceRespir Physiol Neurobiol2011177212012621457800
- ValençaSSda HoraKCastroPMoraesVGCarvalhoLPortoLCEmphysema and metalloelastase expression in mouse lung induced by cigarette smokeToxicol Pathol200432335135615204978
- CamposKKMansoRGGonçalvezEGTemporal analysis of oxidative effects on the pulmonary inflammatory response in mice exposed to cigarette smokeCell Immunol20132841–2293623921078
- CamposKKDouradoVADinizMFBezerraFSLimaWGExposure to cigarette smoke during pregnancy causes redox imbalance and histological damage in lung tissue of neonatal miceExp Lung Res201440416417124669879
- ValençaSSCastroPPimentoWALight cigarette smoke-induced emphysema and NFkappaB activation in mouse lungInt J Exp Pathol200687537338116965565
- BuegeJAAustSDMicrosomal lipid peroxidationMethods Enzymol197852302310672633
- LevineRLWilliamsJAStadtmanERShacterECarbonyl assays for determination of oxidatively modified proteinsMethods Enzymol19942333463578015469
- AebiHCatalase in vitroMethods Enzymol19841051211266727660
- MarklundSMarklundGInvolvement of the superoxide anion radical in the autoxidation of pyrogallol and a convenient assay for superoxide dismutaseEur J Biochem19744734694744215654
- BradfordMMA rapid and sensitive method for the quantitation of microgram quantities of protein utilizing the principle of protein-dye bindingAnal Biochem197672248254942051
- BoglLHKayeSMRämöJTAbdominal obesity and circulating metabolites: a twin study approachMetabolism201665311112126892522
- RomOAvezovKAizenbudDReznickAZCigarette smoking and inflammation revisitedRespir Physiol Neurobiol2013187151023376061
- DouradoLPNoviello MdeLAlvarengaDMExperimental food allergy leads to adipose tissue inflammation, systemic metabolic alterations and weight loss in miceCell Immunol2011270219820621636080
- MehtaNNMcGillicuddyFCAndersonPDExperimental endotoxemia induces adipose inflammation and insulin resistance in humansDiabetes201059117218119794059
- ObermanBKhakuACamachoFGoldenbergDRelationship between obesity, diabetes and the risk of thyroid cancerAm J Otolaryngol201536453554125794786
- XueJIderaabdullahFYAn assessment of molecular pathways of obesity susceptible to nutrient, toxicant and genetically induced epigenetic perturbationJ Nutr Biochem20163011327012616
- EnosRTDavisJMVelázquezKTInfluence of dietary saturated fat content on adiposity, macrophage behavior, inflammation, and metabolism: composition mattersJ Lipid Res201354115216323103474
- KakimotoPAKowaltowskiAJEffects of high fat diets on rodent liver bioenergetics and oxidative imbalanceRedox Biol2016821622526826574
- HaoQLillefosseHHFjaereEHigh-glycemic index carbohydrates abrogate the antiobesity effect of fish oil in miceAm J Physiol Endocrinol Metab20123029E1097E111222338077
- OishiKYamamotoSItohNWheat alkylresorcinols suppress high-fat, high-sucrose diet-induced obesity and glucose intolerance by increasing insulin sensitivity and cholesterol excretion in male miceJ Nutr2015145219920625644338
- ShahBKNepalAKAgrawalMSinhaAKThe effects of cigarette smoking on hemoglobin levels compared between smokers and nonsmokersSunsari Technical College J20131113
- BezerraFSValençaSSLanzettiMAlpha-tocopherol and ascorbic acid supplementation reduced acute lung inflammatory response by cigarette smoke in mouseNutrition20062211–121192120117095405
- BainesKJSimpsonJLGibsonPGInnate immune responses are increased in chronic obstructive pulmonary diseasePLoS One201163e1842621483784
- WilliamsASMathewsJAKasaharaDIAugmented pulmonary responses to acute ozone exposure in obese mice: roles of TNFR2 and IL-13Environ Health Perspect2013121555155723434795
- MilnerJJSheridanPAKarlssonEASchultz-CherrySShiQBeckMADiet-induced obese mice exhibit altered heterologous immunity during a secondary 2009 pandemic H1N1 infectionJ Immunol201319152474248523904168
- CalixtoMCLintomenLSchenkaASaadMJZanescoAAntunesEObesity enhances eosinophilic inflammation in a murine model of allergic asthmaBr J Pharmacol2010159361762520100278
- KaralisKPGiannogonasPKodelaEKoutmaniYZoumakisMTeliTMechanisms of obesity and related pathology: linking immune responses to metabolic stressFEBS J2009276205747575419754872
- FrançaBKAlvesMRMSoutoFMSPeroxidação lipídica e obesidade: métodos para aferição do estresse oxidativo em obesos [Lipid peroxidation and obesity: methods to measure the oxidative stress in obese patients]GE Jornal Português de Gastrenterologia201320599206
- CantinAMRichterMVCigarette smoke-induced proteostasis imbalance in obstructive lung diseasesCurr Mol Med201212783684922697342
- CamposKKLealSFCostaDCde LimaWGBezerraFSLong-term exposure to ultrasonically nebulized distilled water and saline causes cellular influx and oxidative stress in lung tissue of ratsExp Lung Res2015411054655326651882
- ValençaSSPortoLCEstudo imunohistoquímico do remodelamento pulmonar em camundongos expostos à fumaça de cigarro [Immu-nohistochemical study of lung remodeling in mice exposed to cigarette smoke]Jornal Brasileiro de Pneumologia200834787795 Portuguese19009211
- MurtaGLCamposKKBandeiraACOxidative effects on lung inflammatory response in rats exposed to different concentrations of formaldehydeEnviron Pollut201621120621326774767